S&P 500 Futures Market Outlook - Trends and Levels ES MES

After today’s trading it appears that the market potentially rejected the lows it made below the high on 7/15.

The 3 hourly bars after the low were all up and made higher lows except for the second bar with a long tail.

Will be watching to see if buyers potentially come into the market and back up the move.

There is a substantial risk of loss in futures trading. Past performance is not indicative of future results. The figures here represent an opinion. The placement of contingent orders by you or broker, or trading advisor, such as a “stop-loss” or “stop-limit” order, will not necessarily limit your losses to the intended amounts, since market conditions may make it impossible to execute such orders. Please conduct your own due diligence if Futures are an appropriate instrument for you.

Optimus Flow

1 Like

Although price shortly fell below support and buyers were able to take it back above that level, sellers we quick to come back into the market and keep price moving lower.

It’s now sitting at our second support area where buying and selling need to be monitored to get a clear outlook on where price may potentially go.

Let’s take a look at what was happening with sellers and buyers during the price movement back above support, then what ultimately led it to break below:

We see buyers experiencing lower highs while sellers were still attracted to the prices at the bottom of the range.

There is a substantial risk of loss in futures trading. Past performance is not indicative of future results. The figures here represent an opinion. The placement of contingent orders by you or broker, or trading advisor, such as a “stop-loss” or “stop-limit” order, will not necessarily limit your losses to the intended amounts, since market conditions may make it impossible to execute such orders. Please conduct your own due diligence if Futures are an appropriate instrument for you.

Charts Courtesy of Optimus Flow

1 Like

On the 15 minute chart of ES Mini’s, there is a potential future crossover of the Tenkan-sen and Kijun-sen POTENTIALLY indicating a short term up move. However, with the recent weakness and multiple tests of support levels, I’ll be closely watching follow through on any price movement.

I’ll also be on the lookout for sellers coming in at the lows when it continues to test support.

On the hourly chart, the potential upward move doesn’t appear as imminent as it does on the 15 min.

There is a substantial risk of loss in futures trading. Past performance is not indicative of future results. The figures here represent an opinion. The placement of contingent orders by you or broker, or trading advisor, such as a “stop-loss” or “stop-limit” order, will not necessarily limit your losses to the intended amounts, since market conditions may make it impossible to execute such orders. Please conduct your own due diligence if Futures are an appropriate instrument for you.

Charts Courtesy of Optimus Flow

1 Like

On our previous chart I noted a potential 15 min crossover of the Tenkan-sen and Kijun-sen to the upside.

This did develop and then price also went above the Senkou Span lines on the 15 min chart.

On the hourly chart the conversion line crossed over as well, however, price is hitting the Senkou Span line which potentially acts as resistance when price is below it.

Looking at the Market Delta, you can see the aggressive selling at the lows of the range then it failed to make lower lows. Sellers got squeezed and buyers came in pushing it up.

There is a substantial risk of loss in futures trading. Past performance is not indicative of future results. The figures here represent an opinion. The placement of contingent orders by you or broker, or trading advisor, such as a “stop-loss” or “stop-limit” order, will not necessarily limit your losses to the intended amounts, since market conditions may make it impossible to execute such orders. Please conduct your own due diligence if Futures are an appropriate instrument for you.

Charts Courtesy of Optimus Flow

ES Mini’s had a significant down move on the hourly charts, coming close to the longer term uptrend support area.

Watching the delta in this area may potentially expose what direction the market is favoring after the consolidation period.

On the 2,000 tick chart we can see more detail:

If sellers stay passive and weak at the top of the consolidation range buyers could potentially move the market up. However, we are seeing active selling at the lows. That’s where are focus should remain.

If sellers are selling the lows but there’s no follow through, there may potentially be a upside puke.

For the Ichimoku on the hourly candlestick charts:

With price trading near the cloud, it’s very possible we could continue to see a consolidation period play out until price hits the lower channel level around 3205.00 - 3210.00 depending on time.

Charts Courtesy of Optimus Flow

There is a substantial risk of loss in futures trading. Past performance is not indicative of future results. The figures here represent an opinion. The placement of contingent orders by you or broker, or trading advisor, such as a “stop-loss” or “stop-limit” order, will not necessarily limit your losses to the intended amounts, since market conditions may make it impossible to execute such orders. Please conduct your own due diligence if Futures are an appropriate instrument for you.

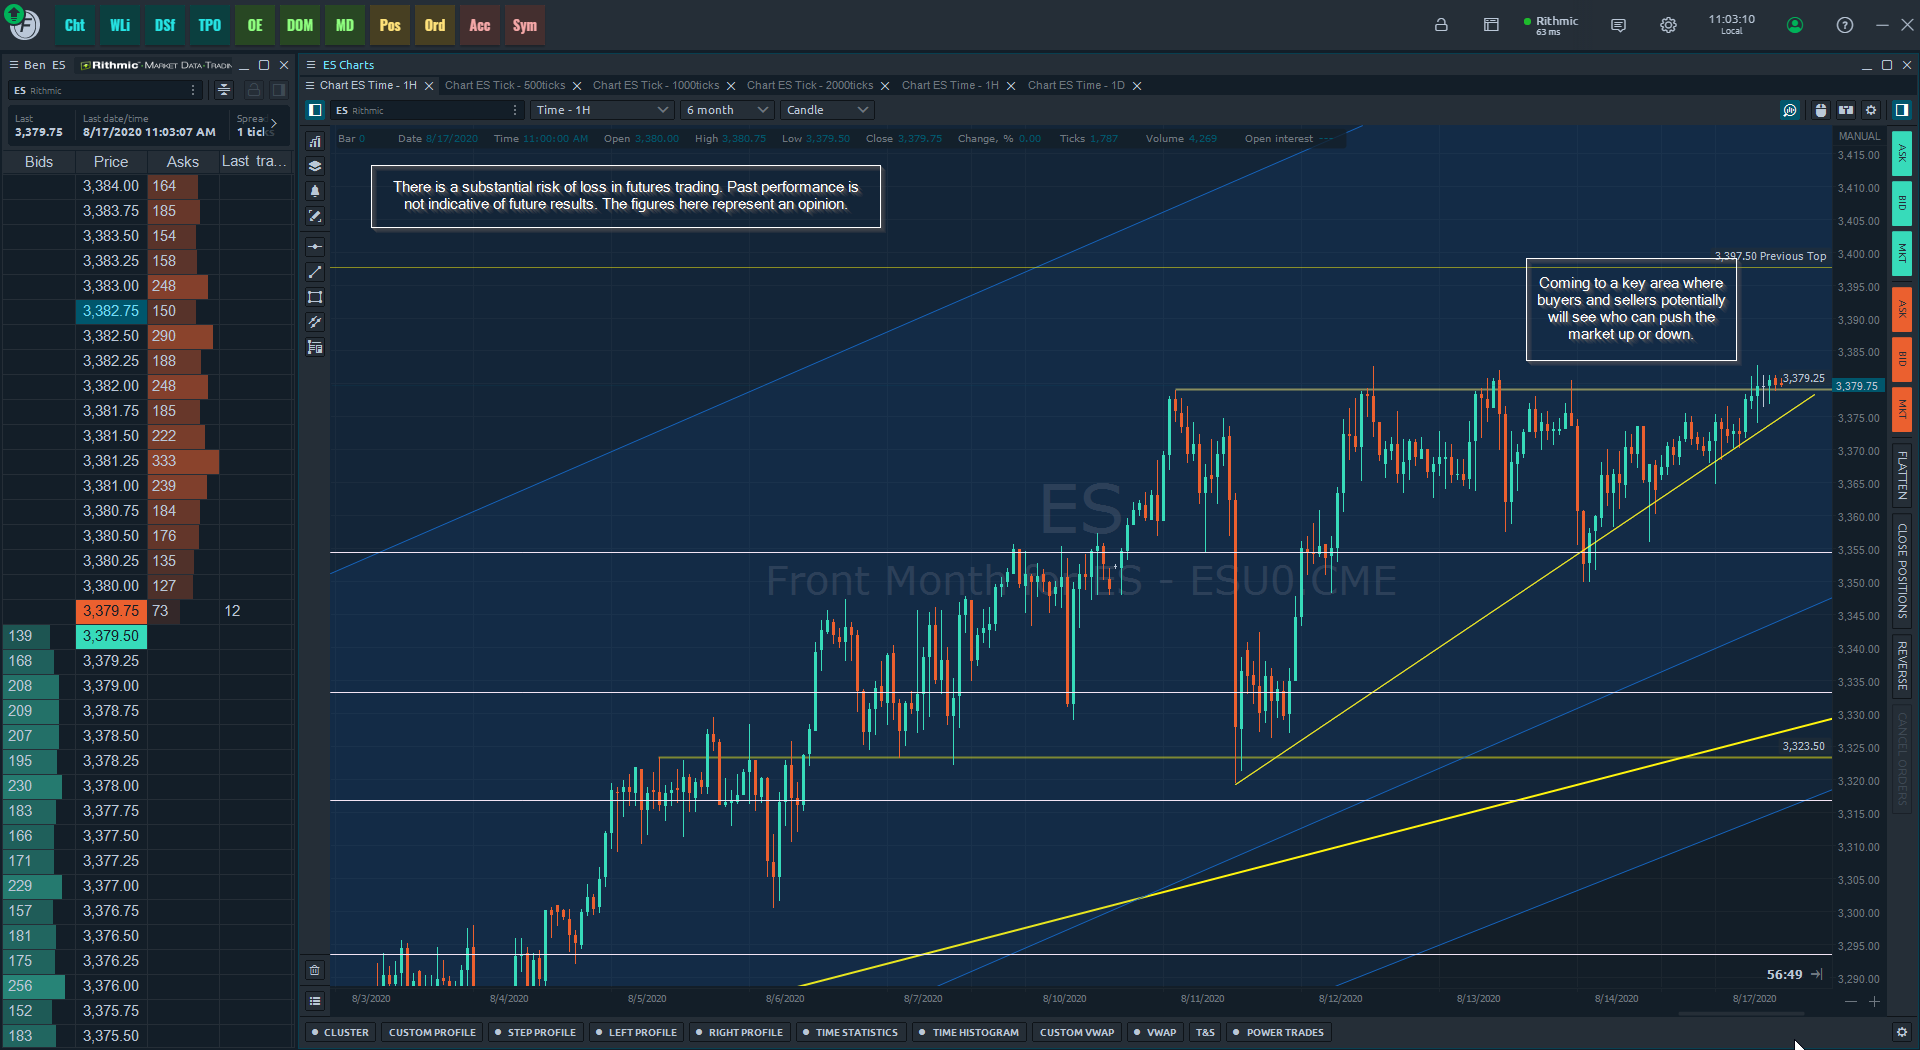
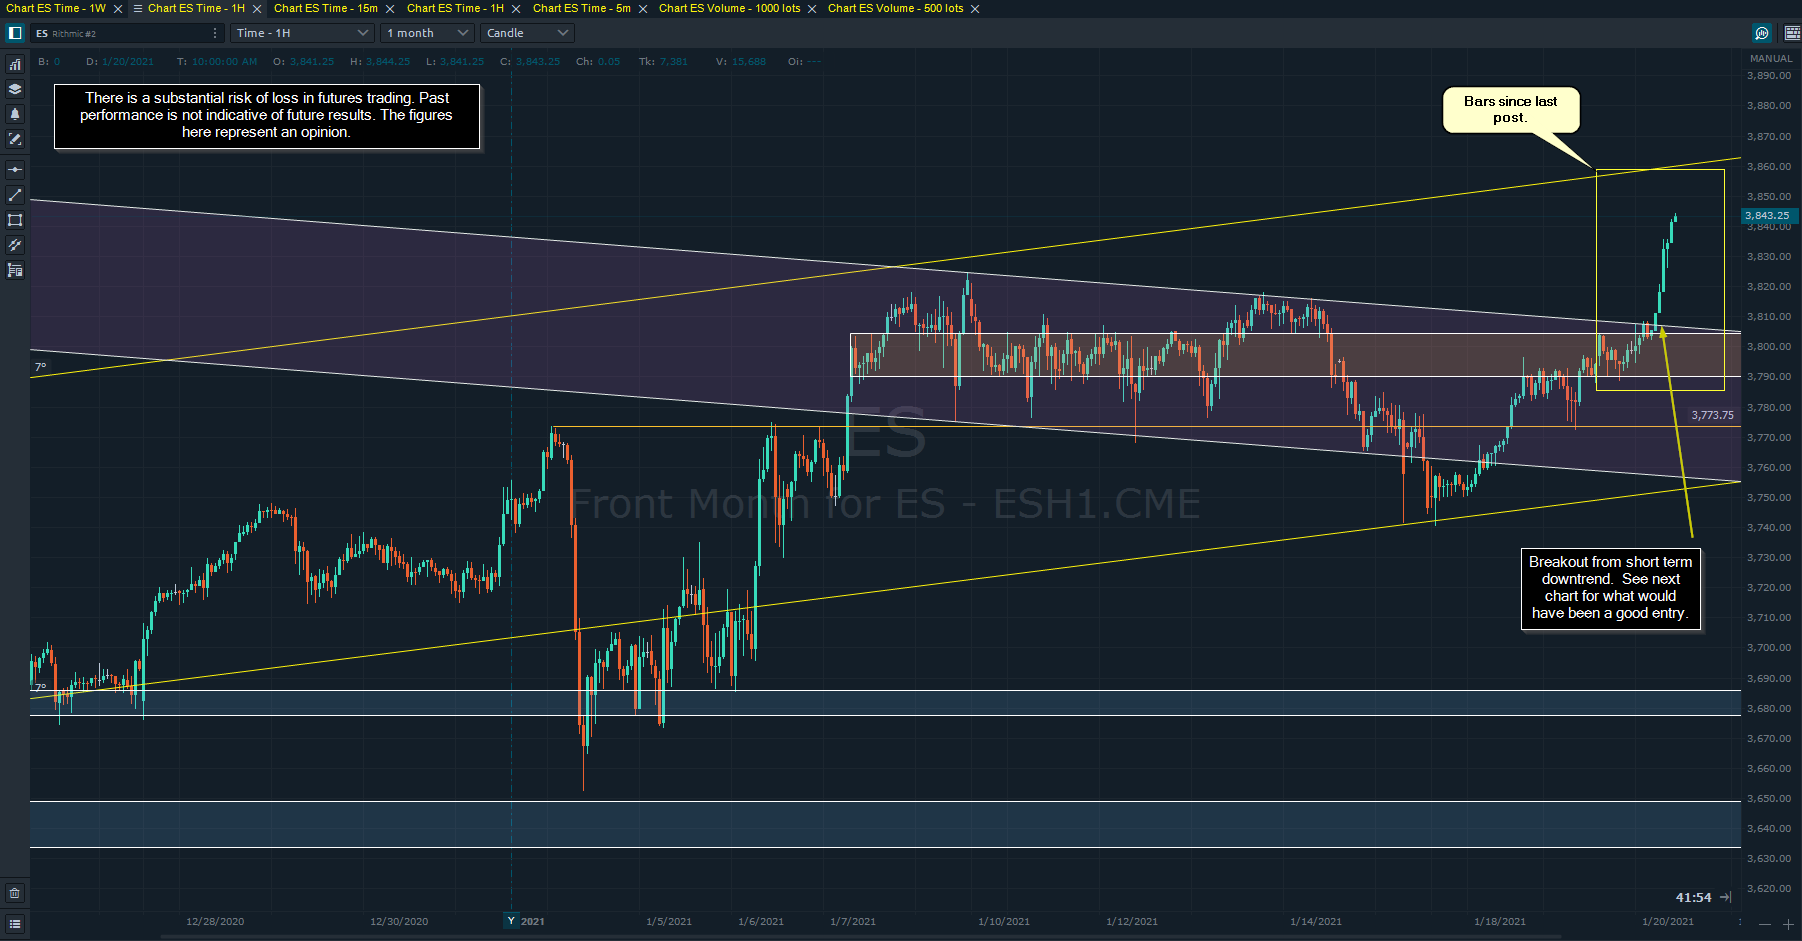
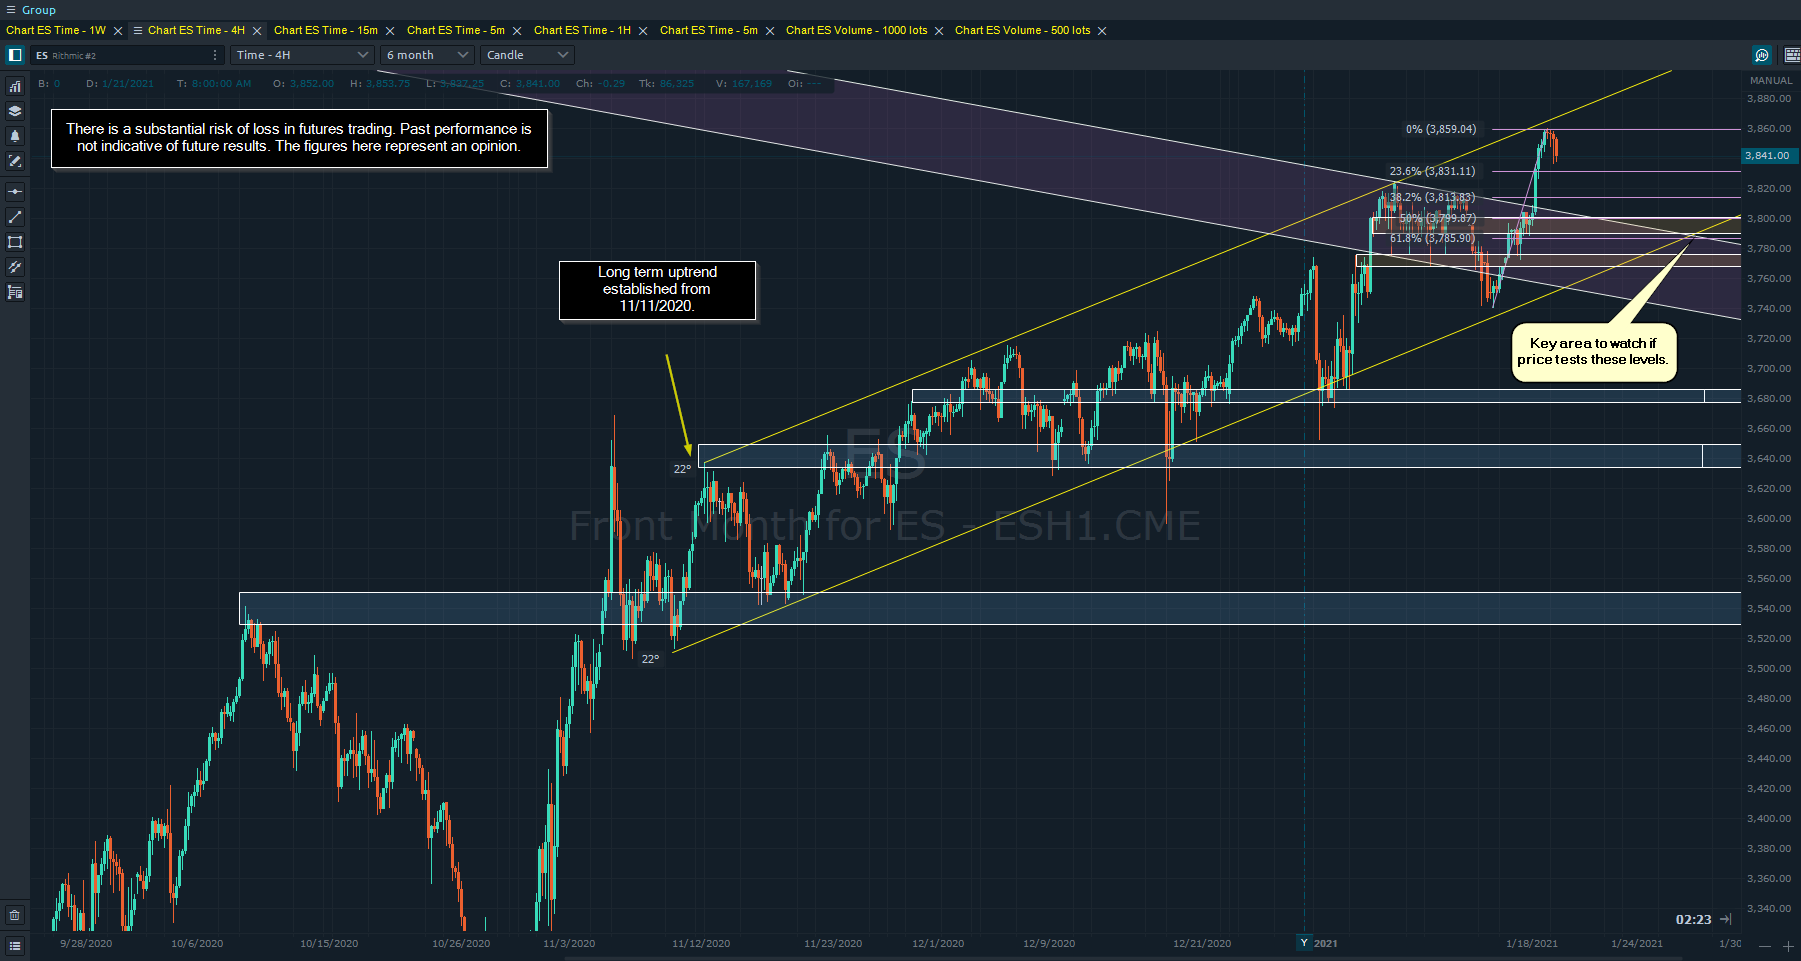
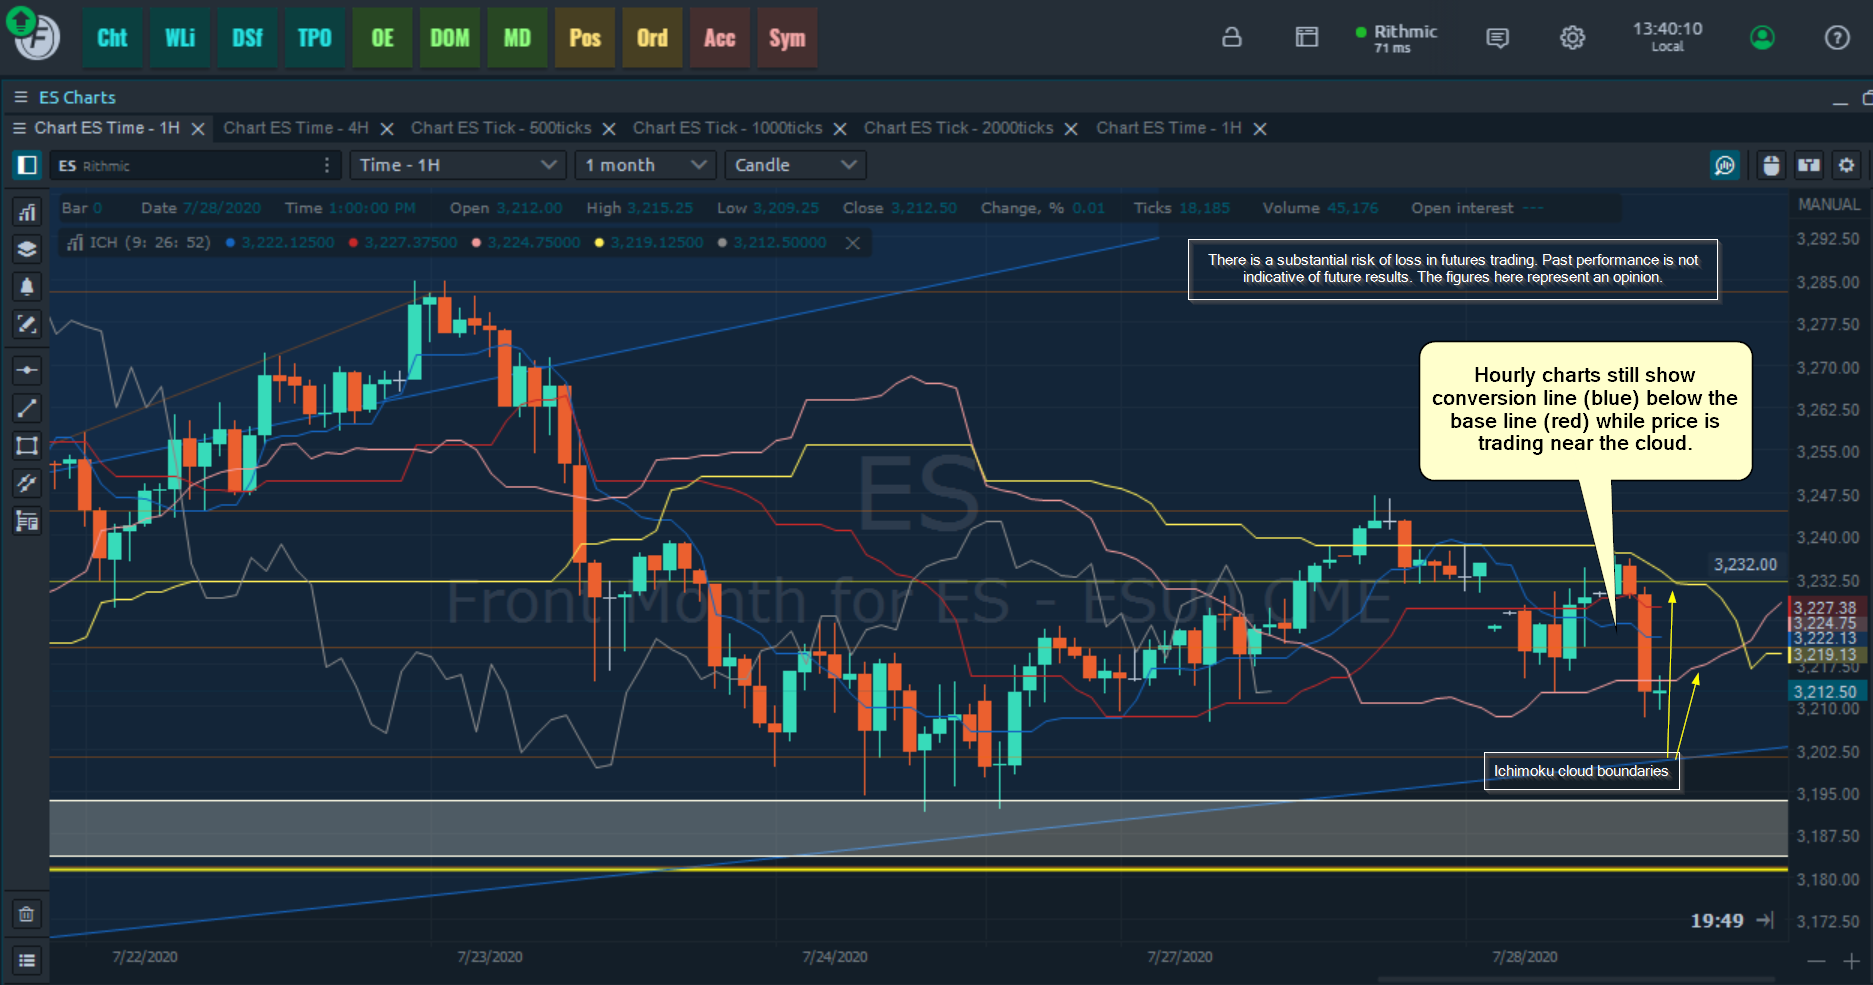
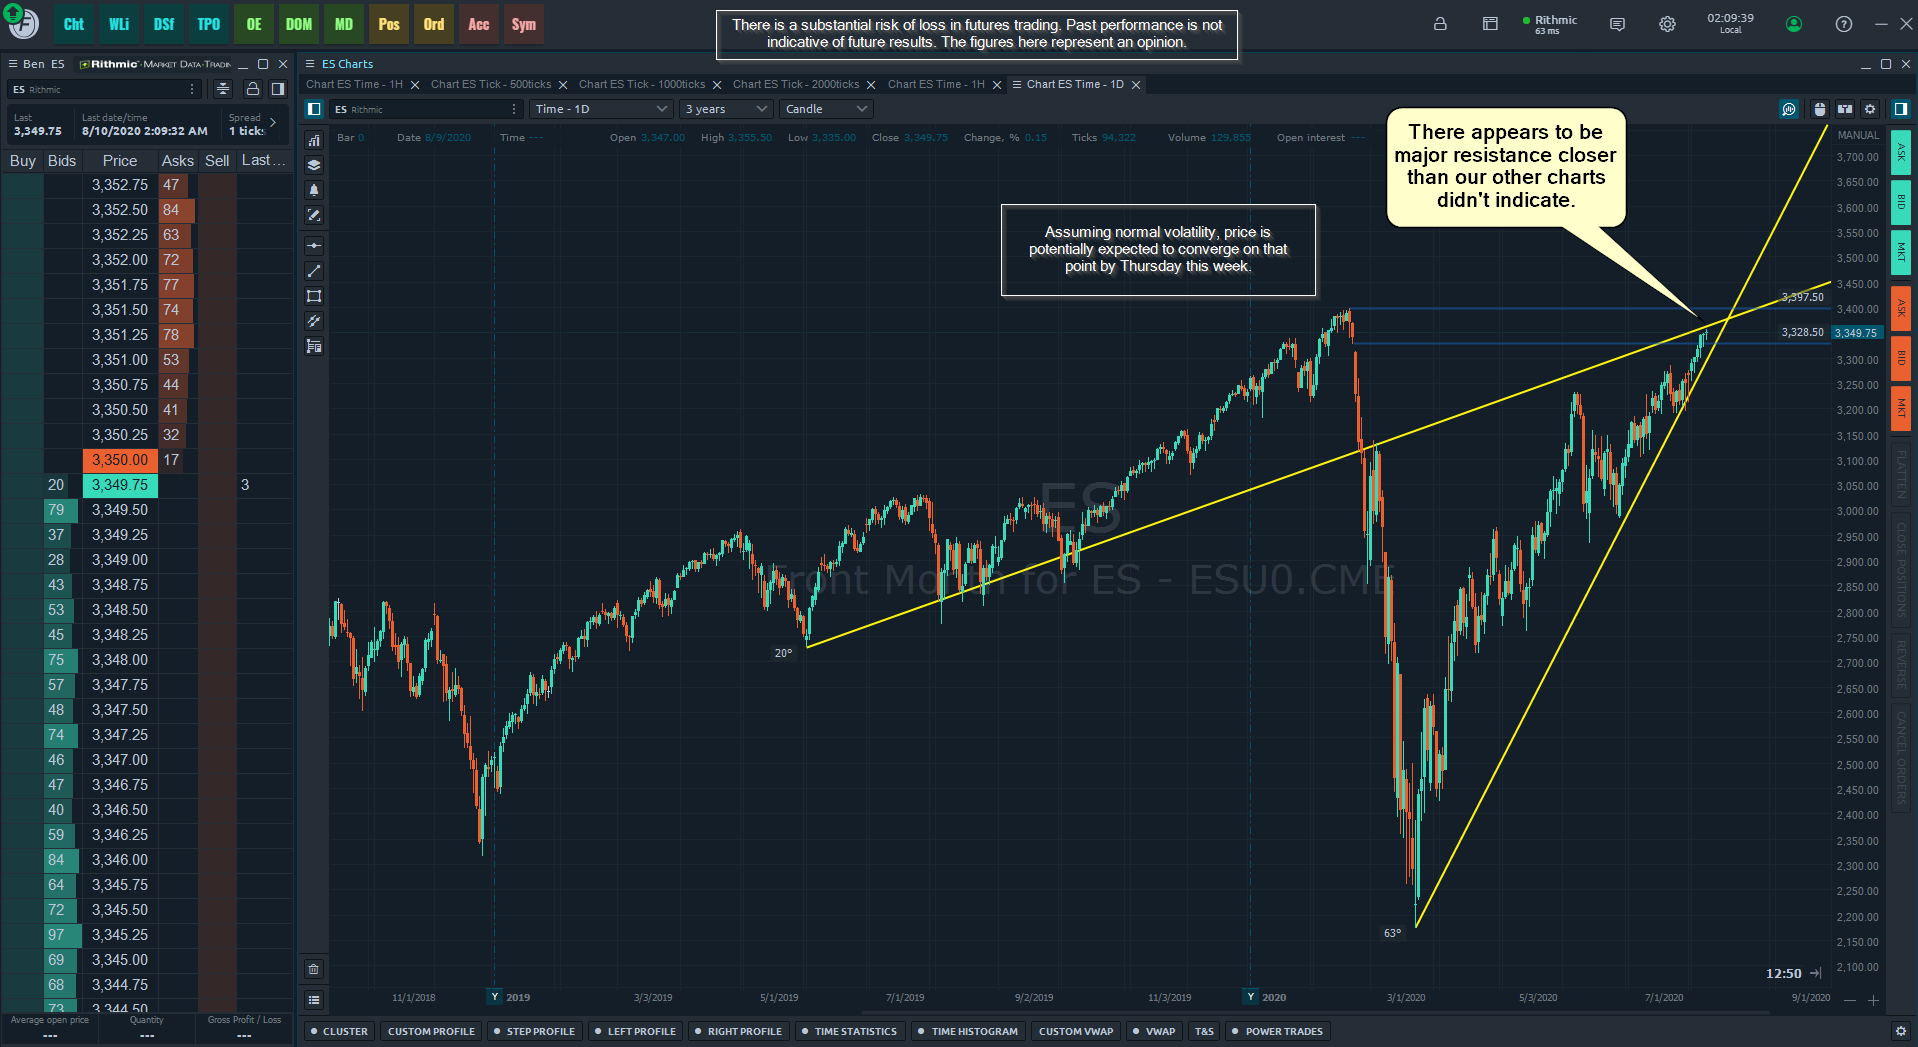
So what are the ES Minis going to do? It has surprised me a few times over the last week (not to mention Gold, which is suitable for another post), but overall it seems to be respecting already identified areas that may potentially indicate continued uptrend.

Here’s the first few observations of the moves:

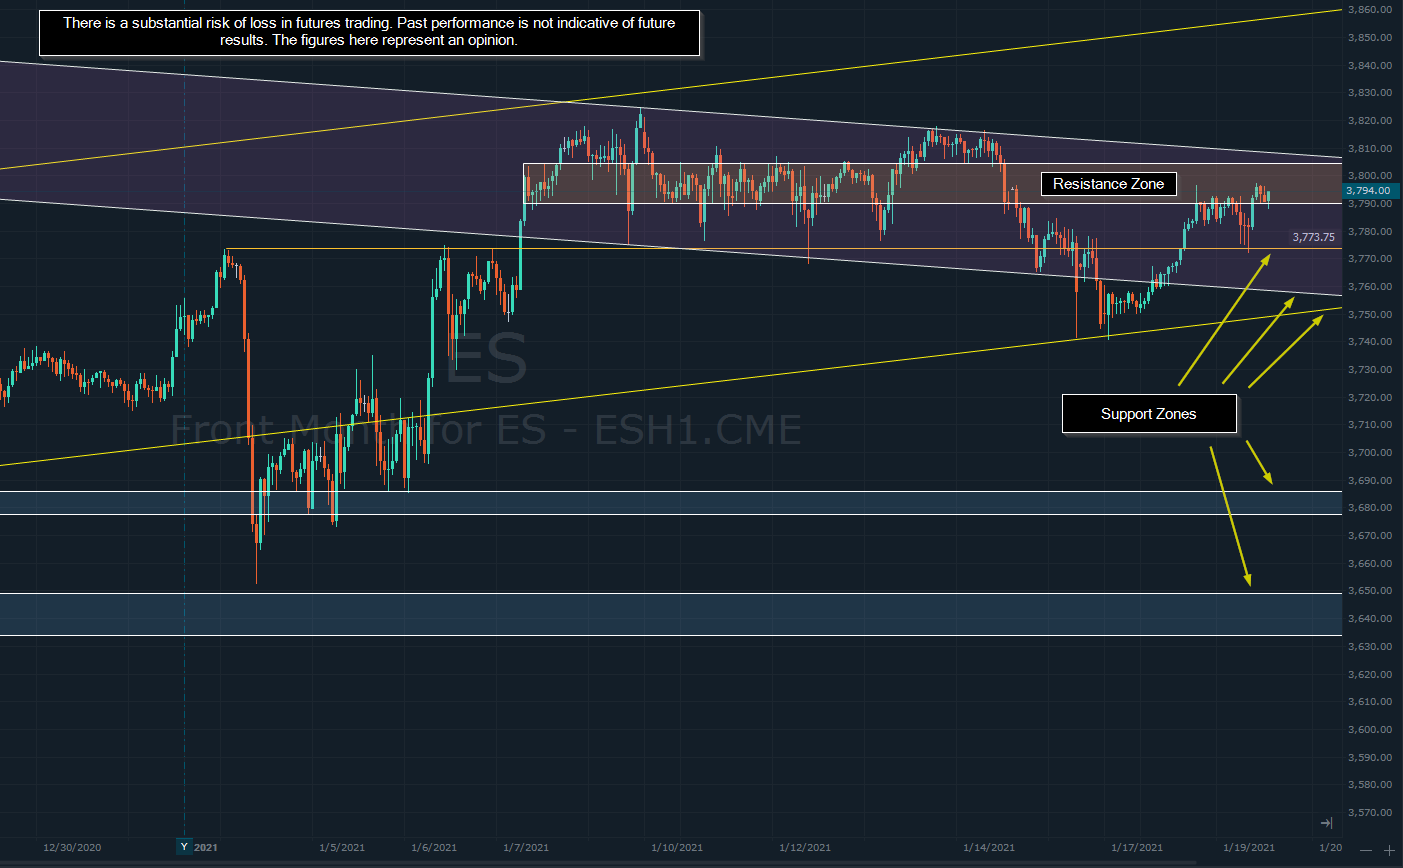
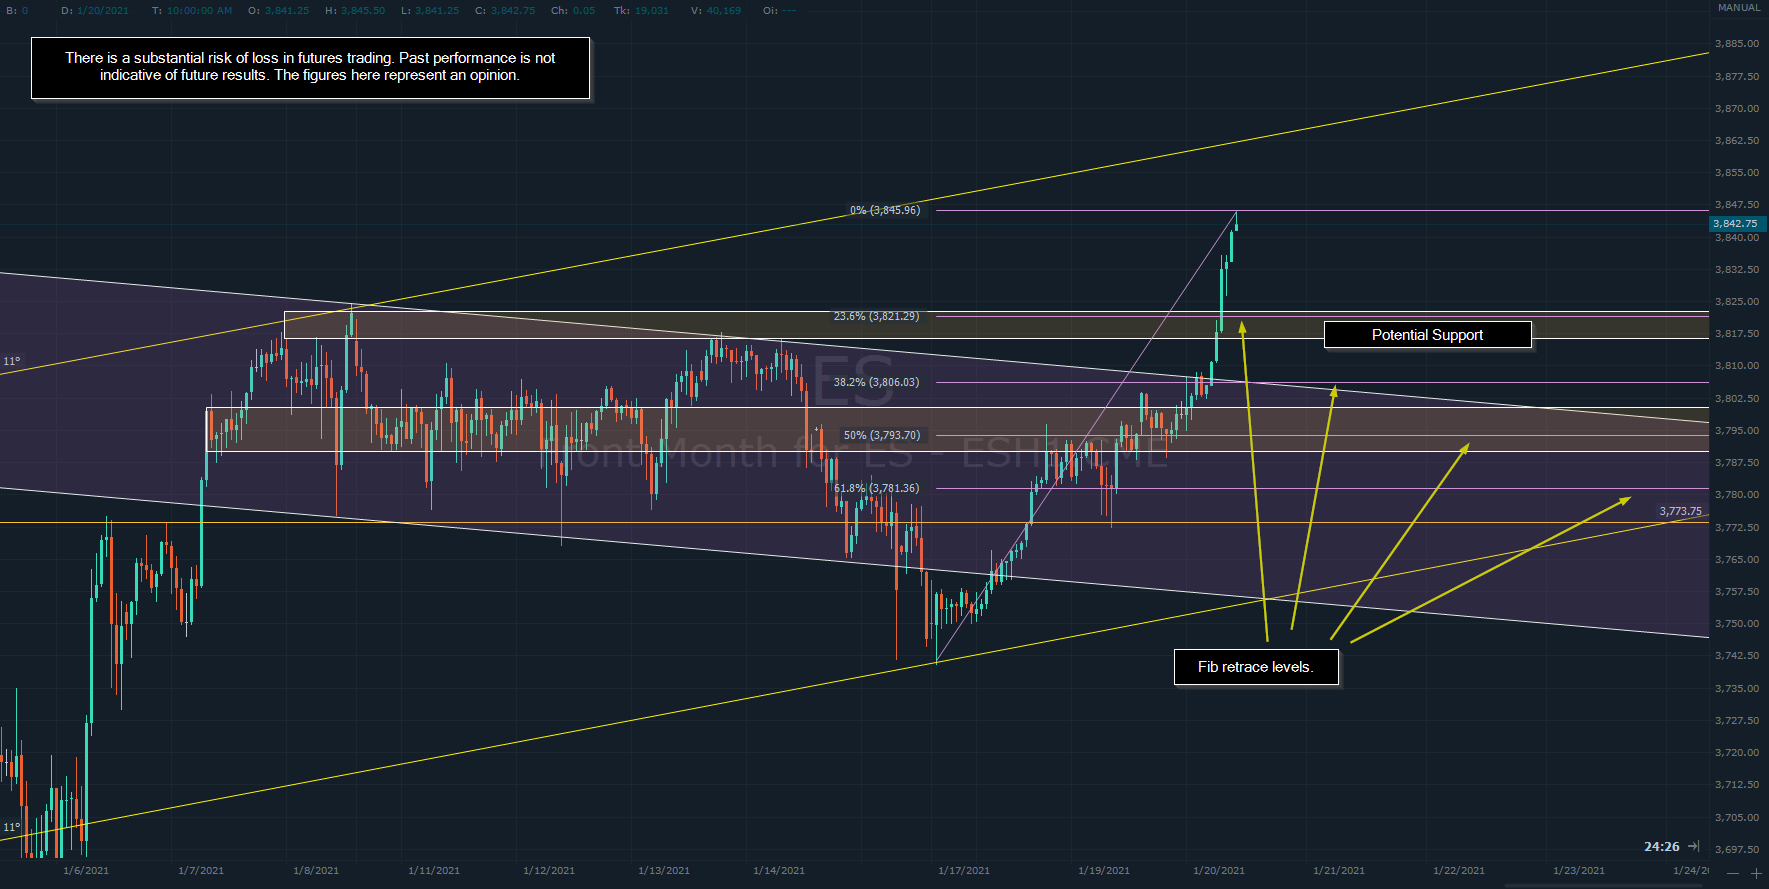
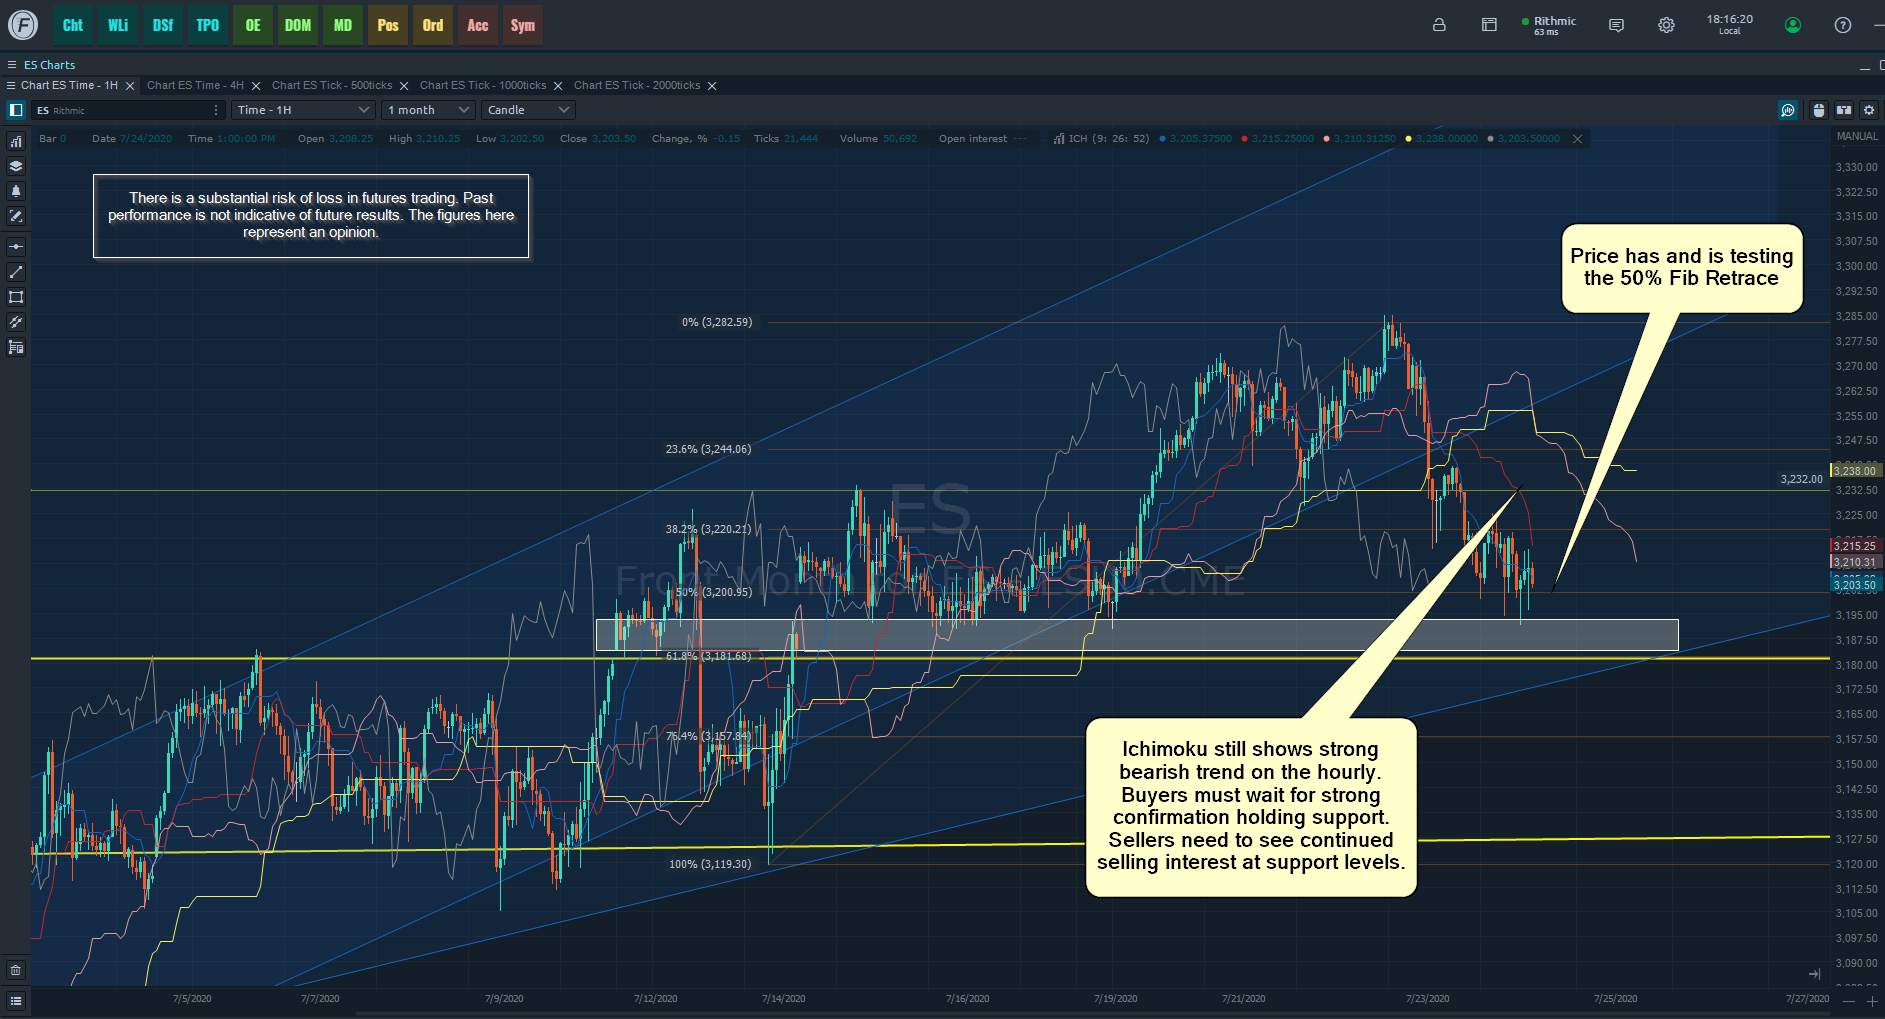
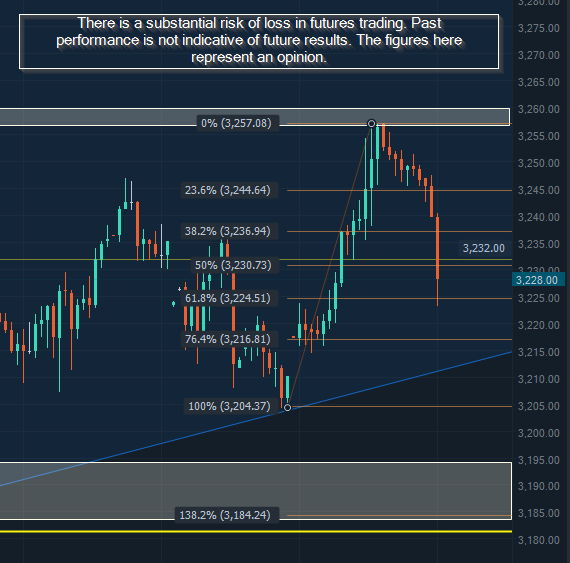
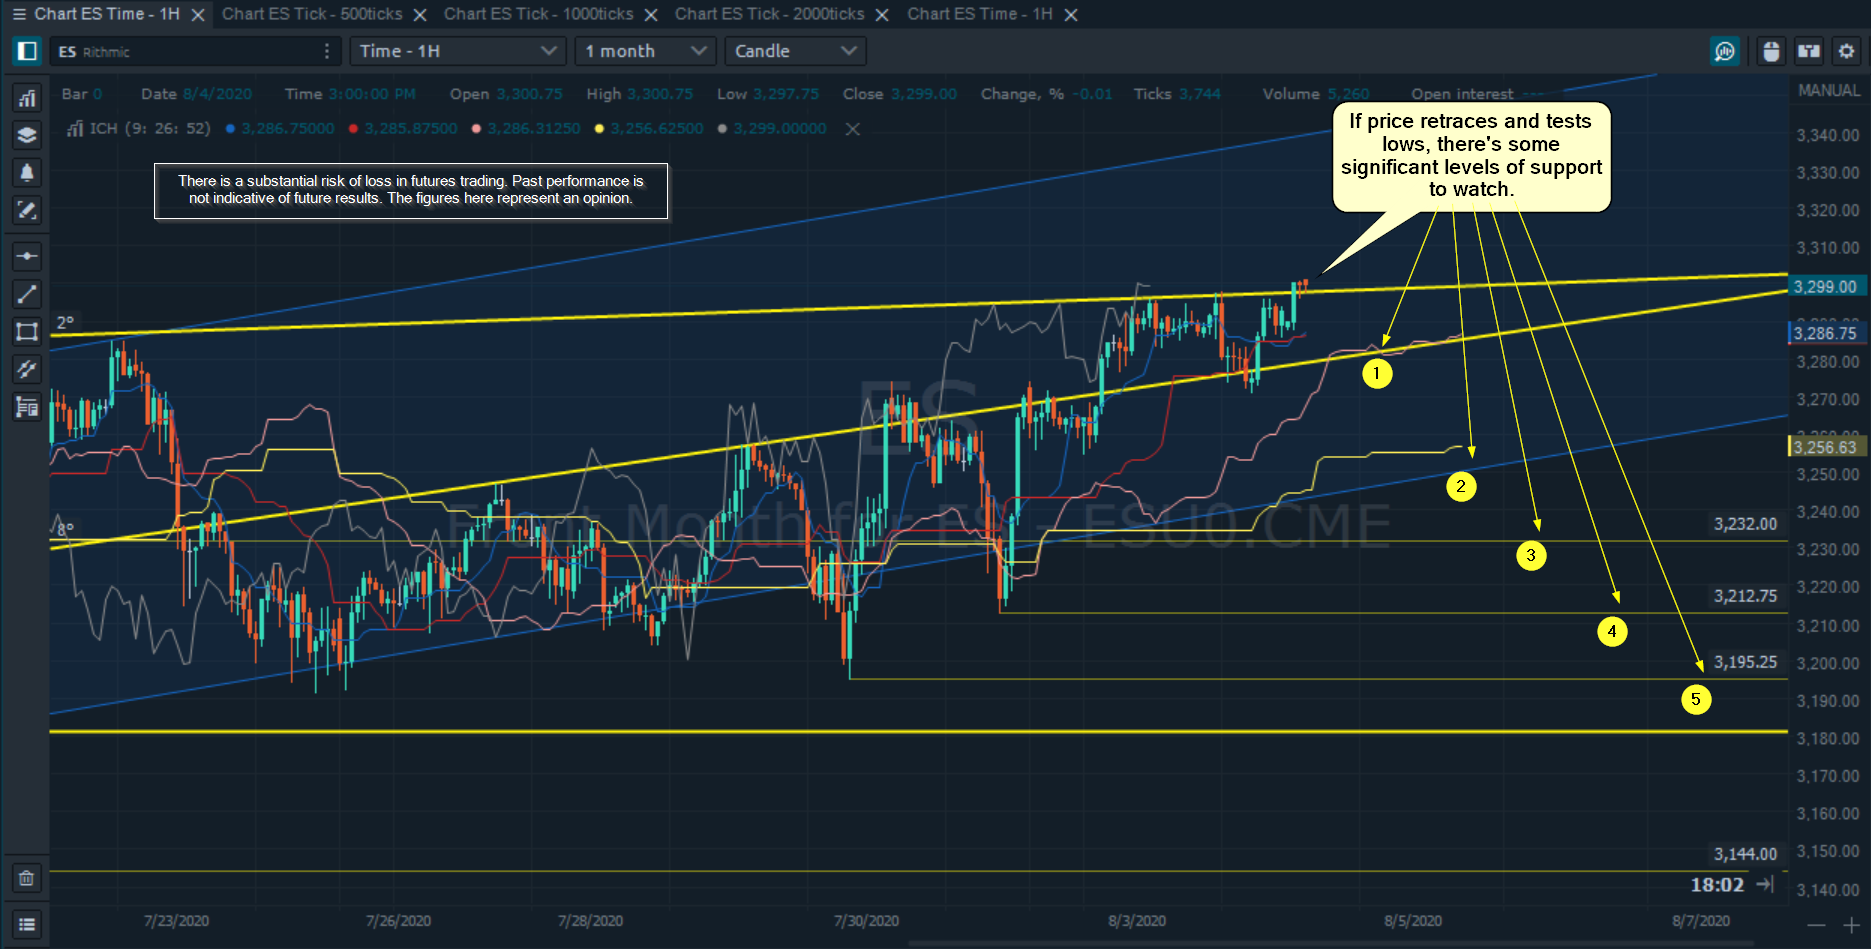
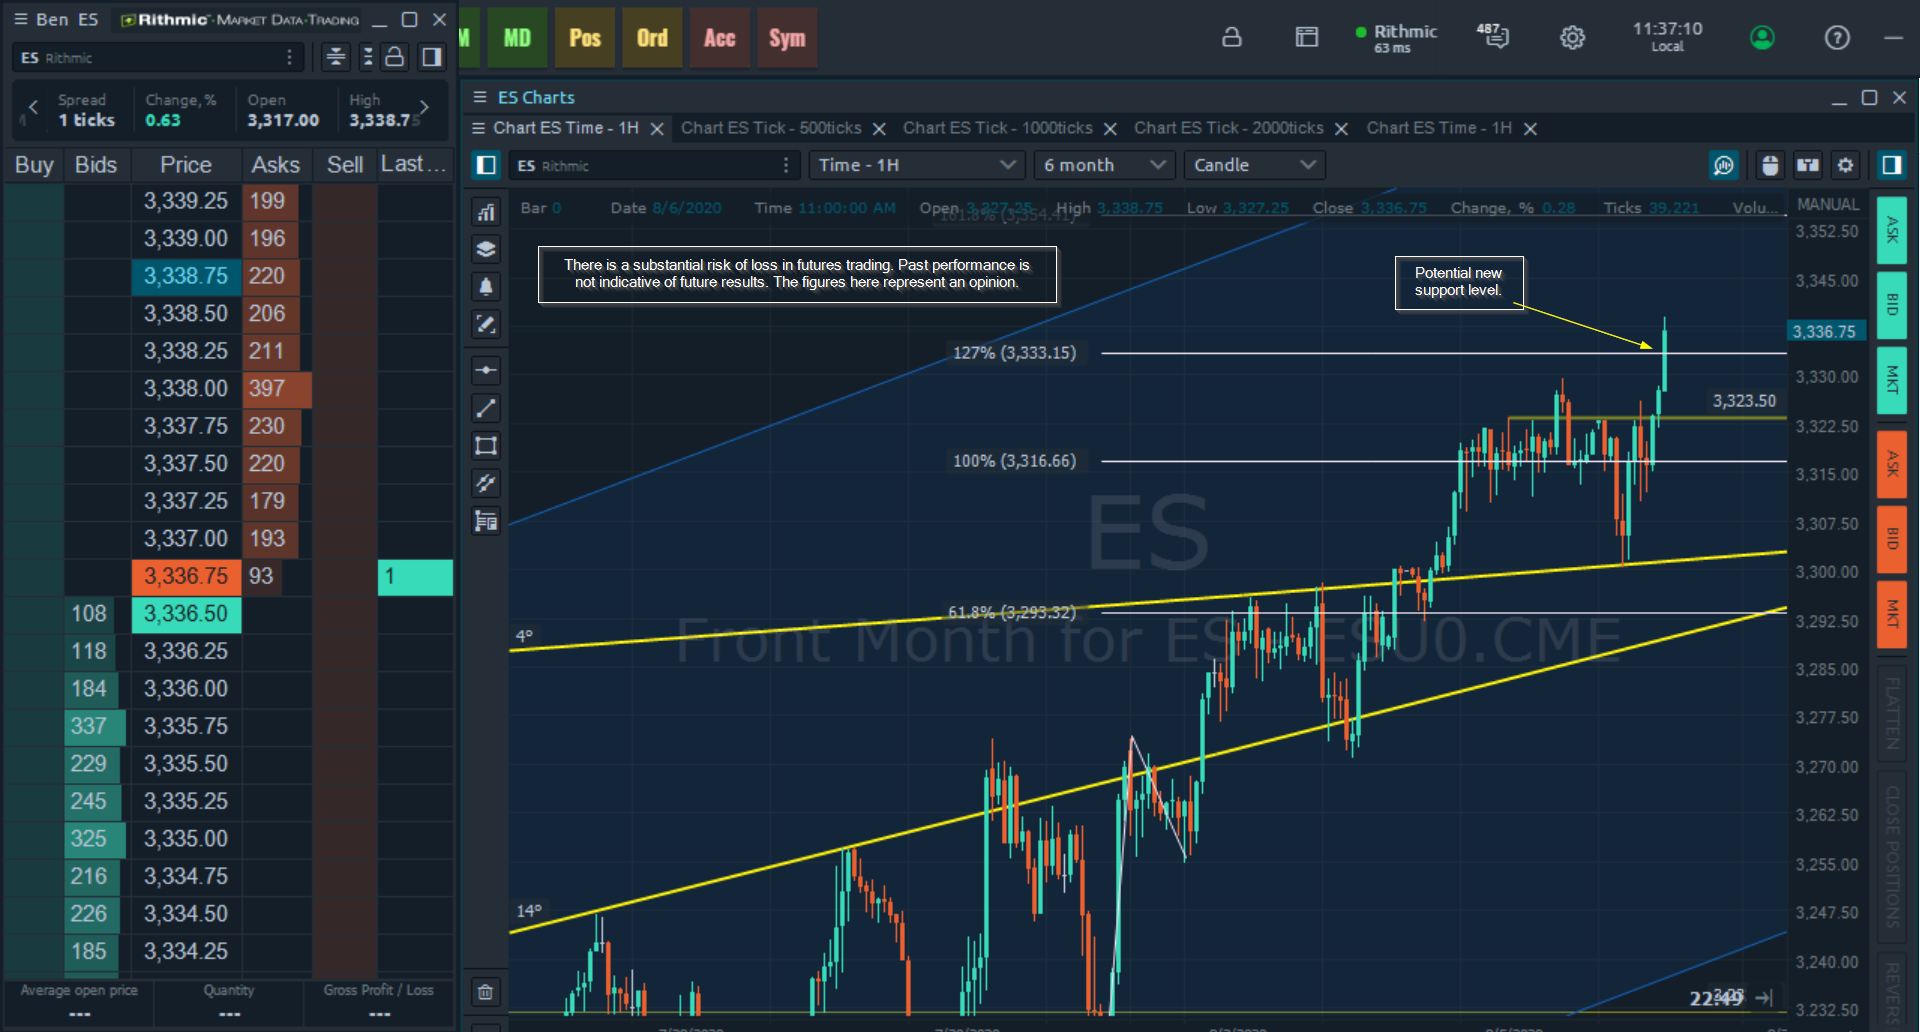
For the move starting at 3204.25 on the 28th to the high 3257.00 on the 29th, here are the Fib Retrace levels. It just wicked the 61.8% level.

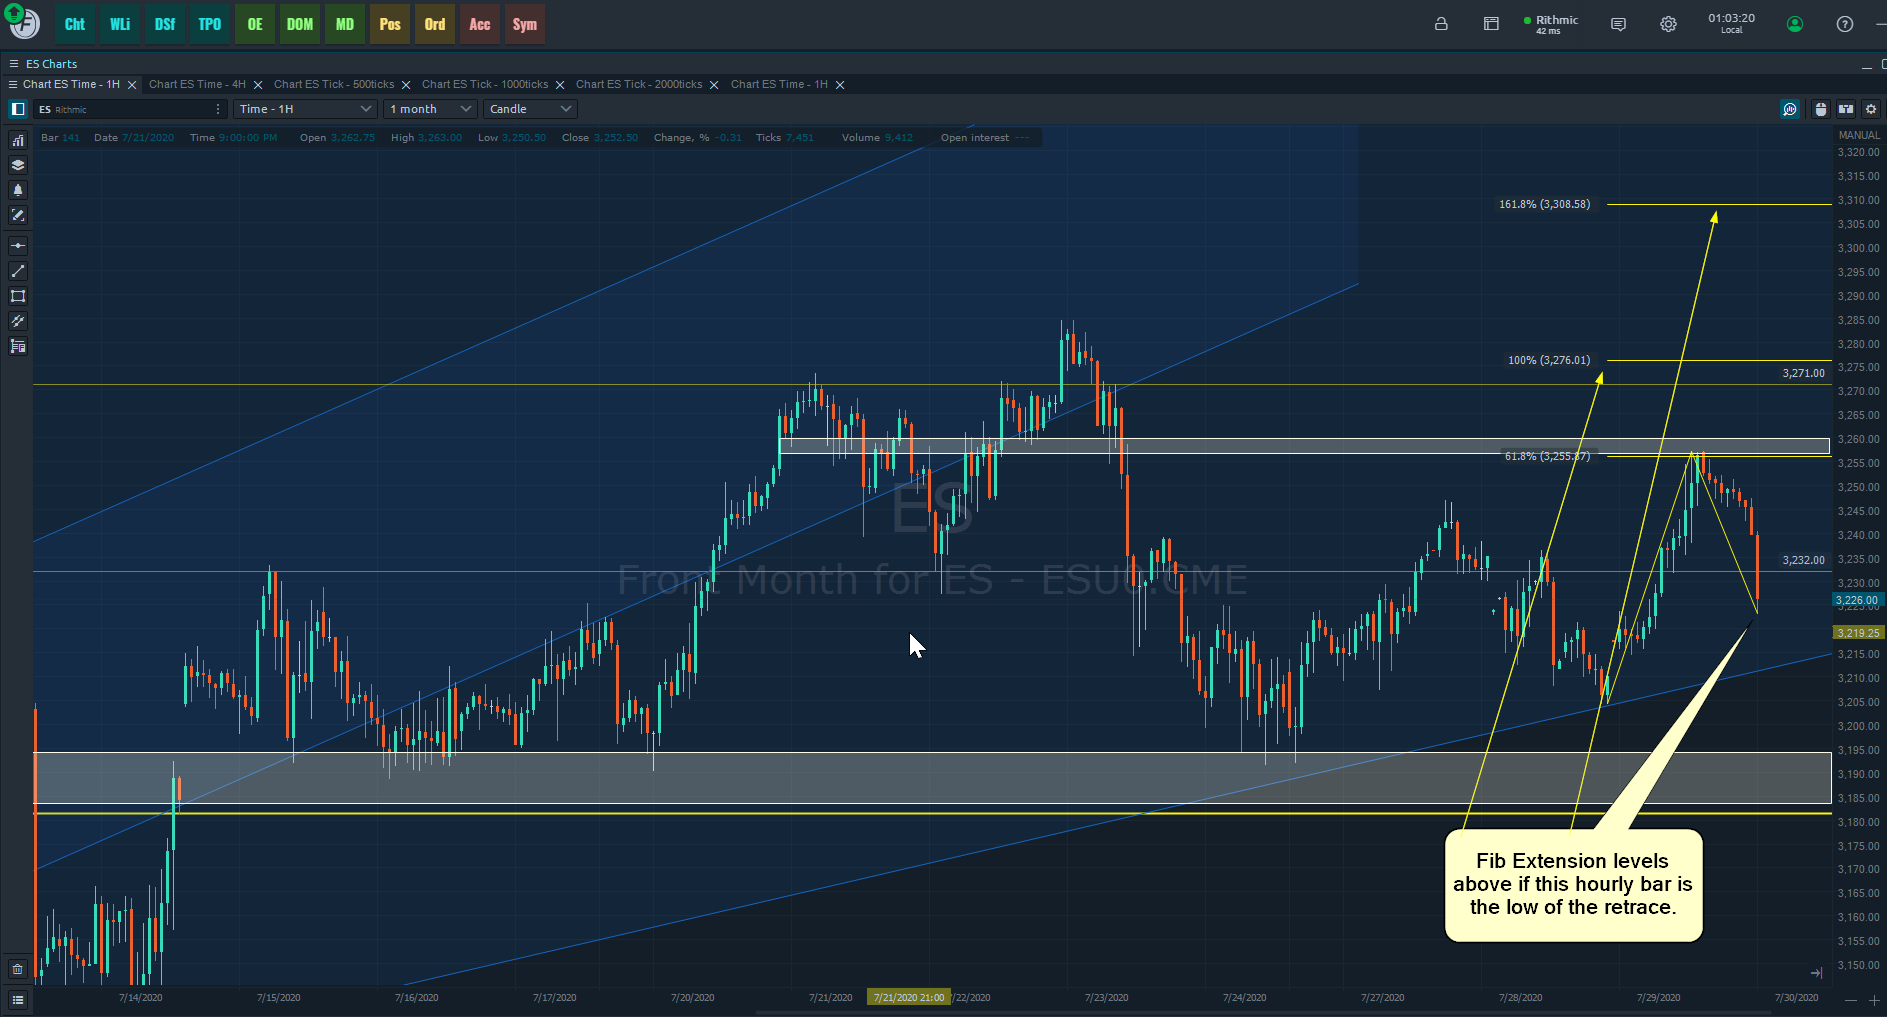
If this HAPPENS to be the low of the retrace, here’s the Fib Extension levels to look out for:

“Ok, I get it move on”. Yes you’re right, time for the delta analysis.

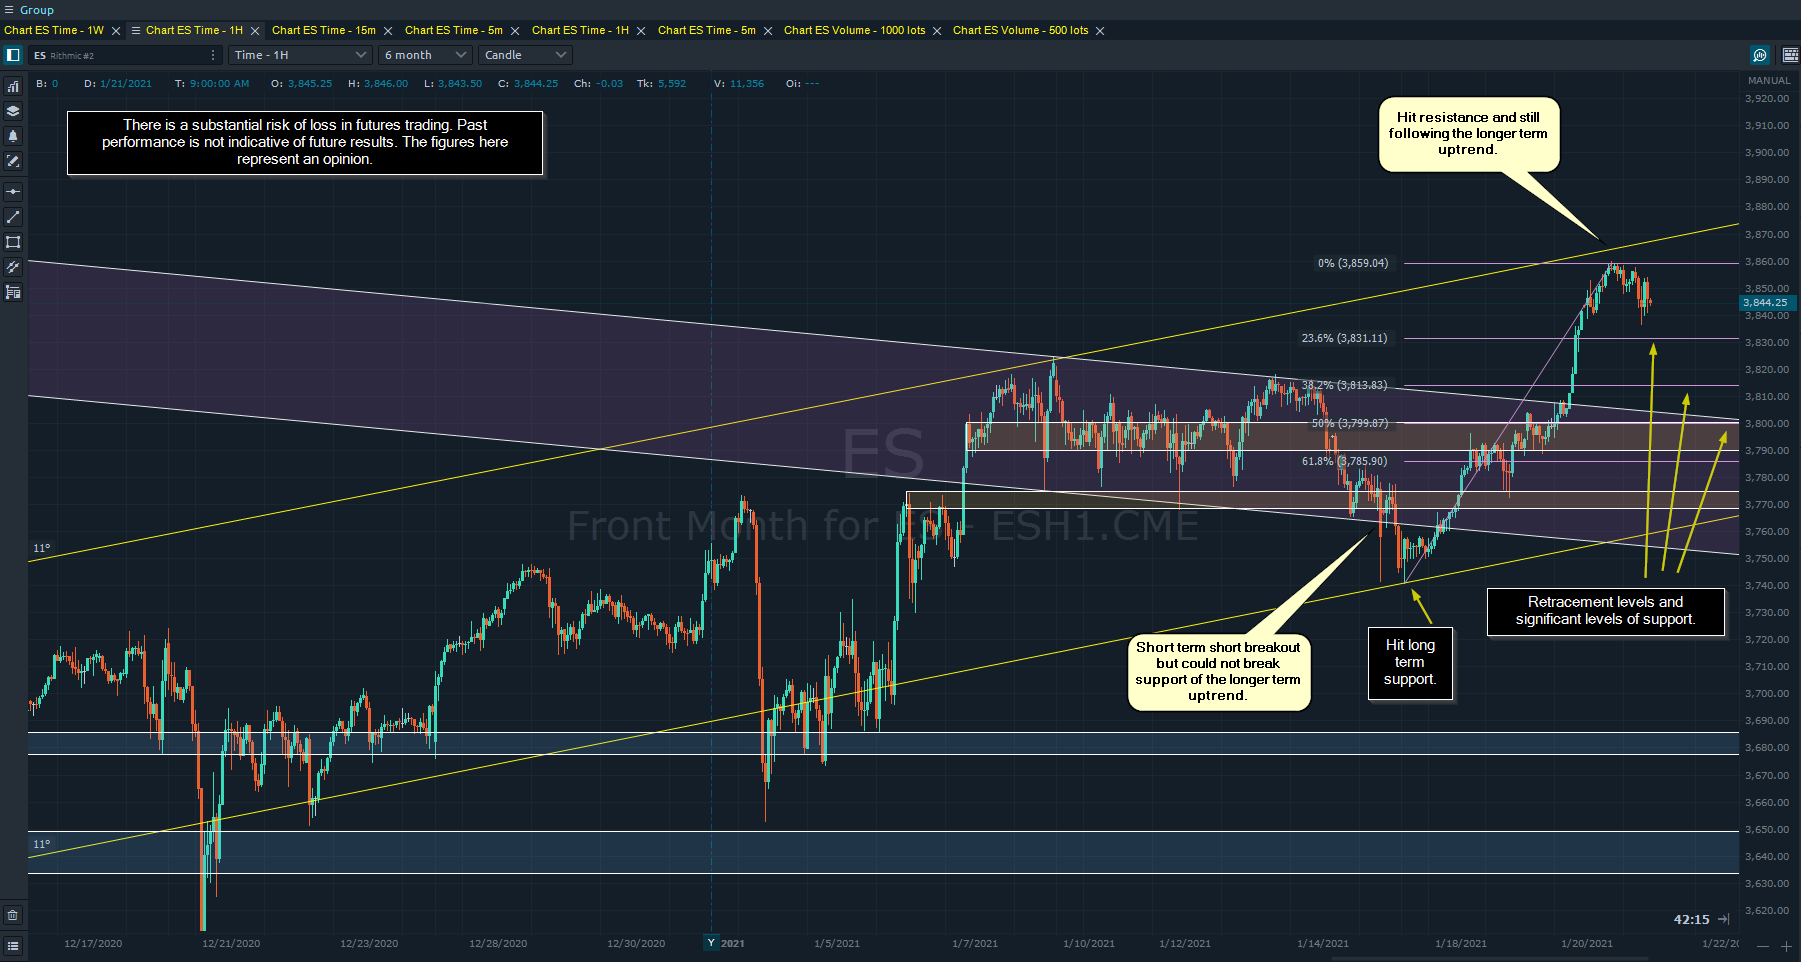
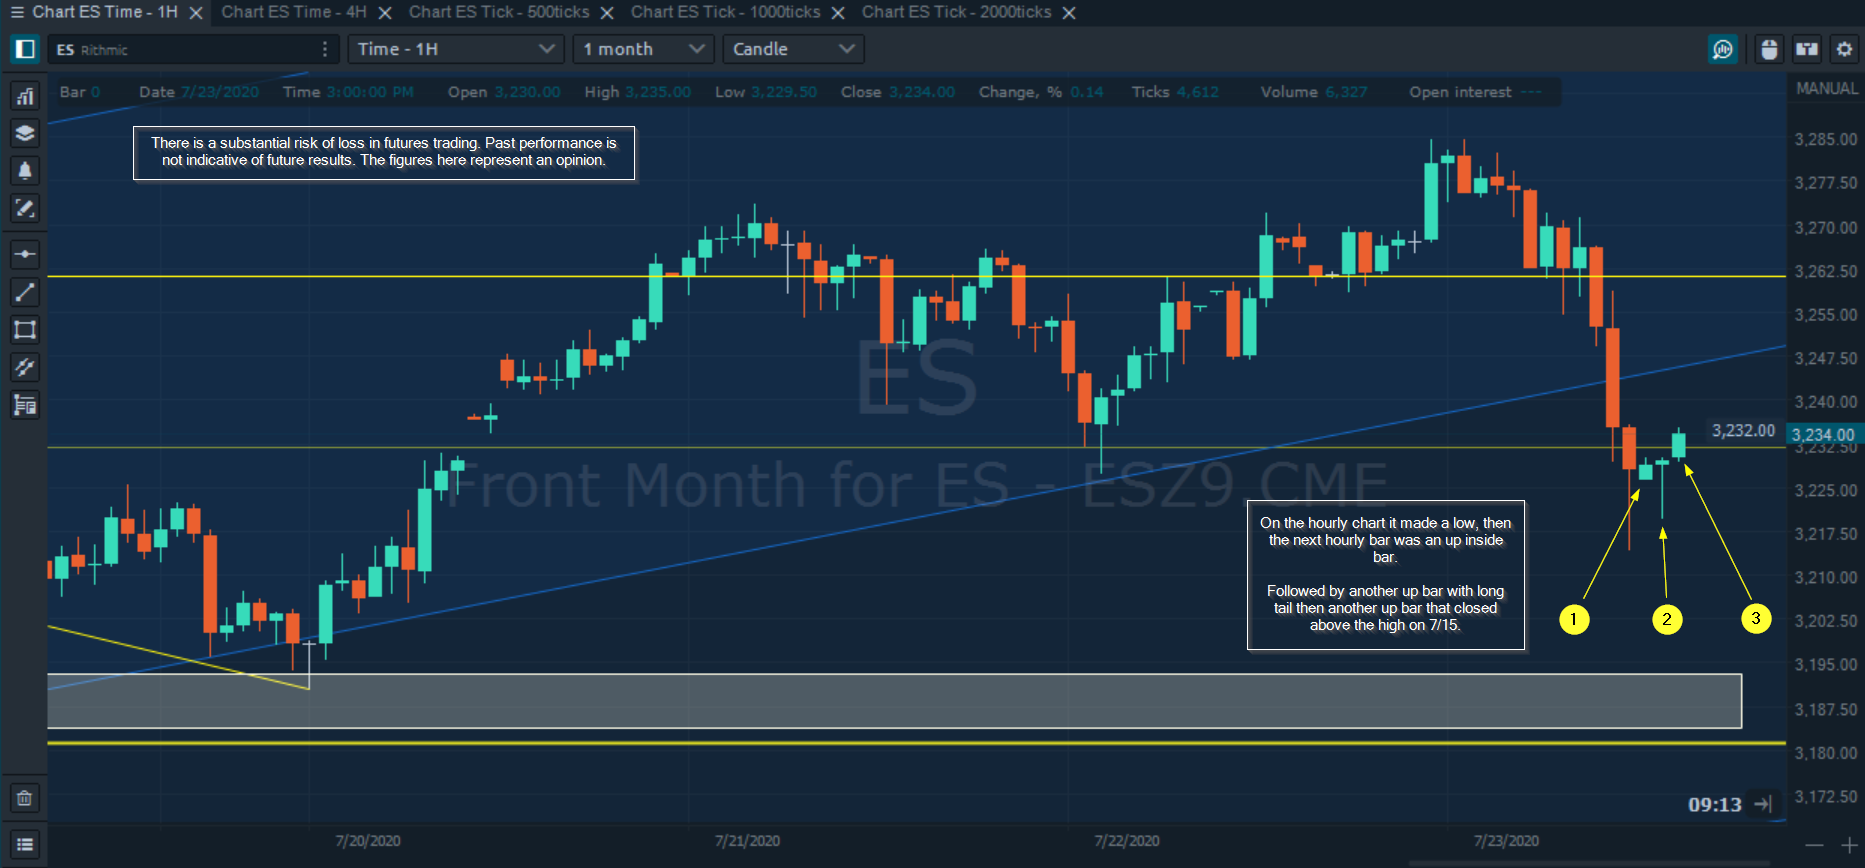
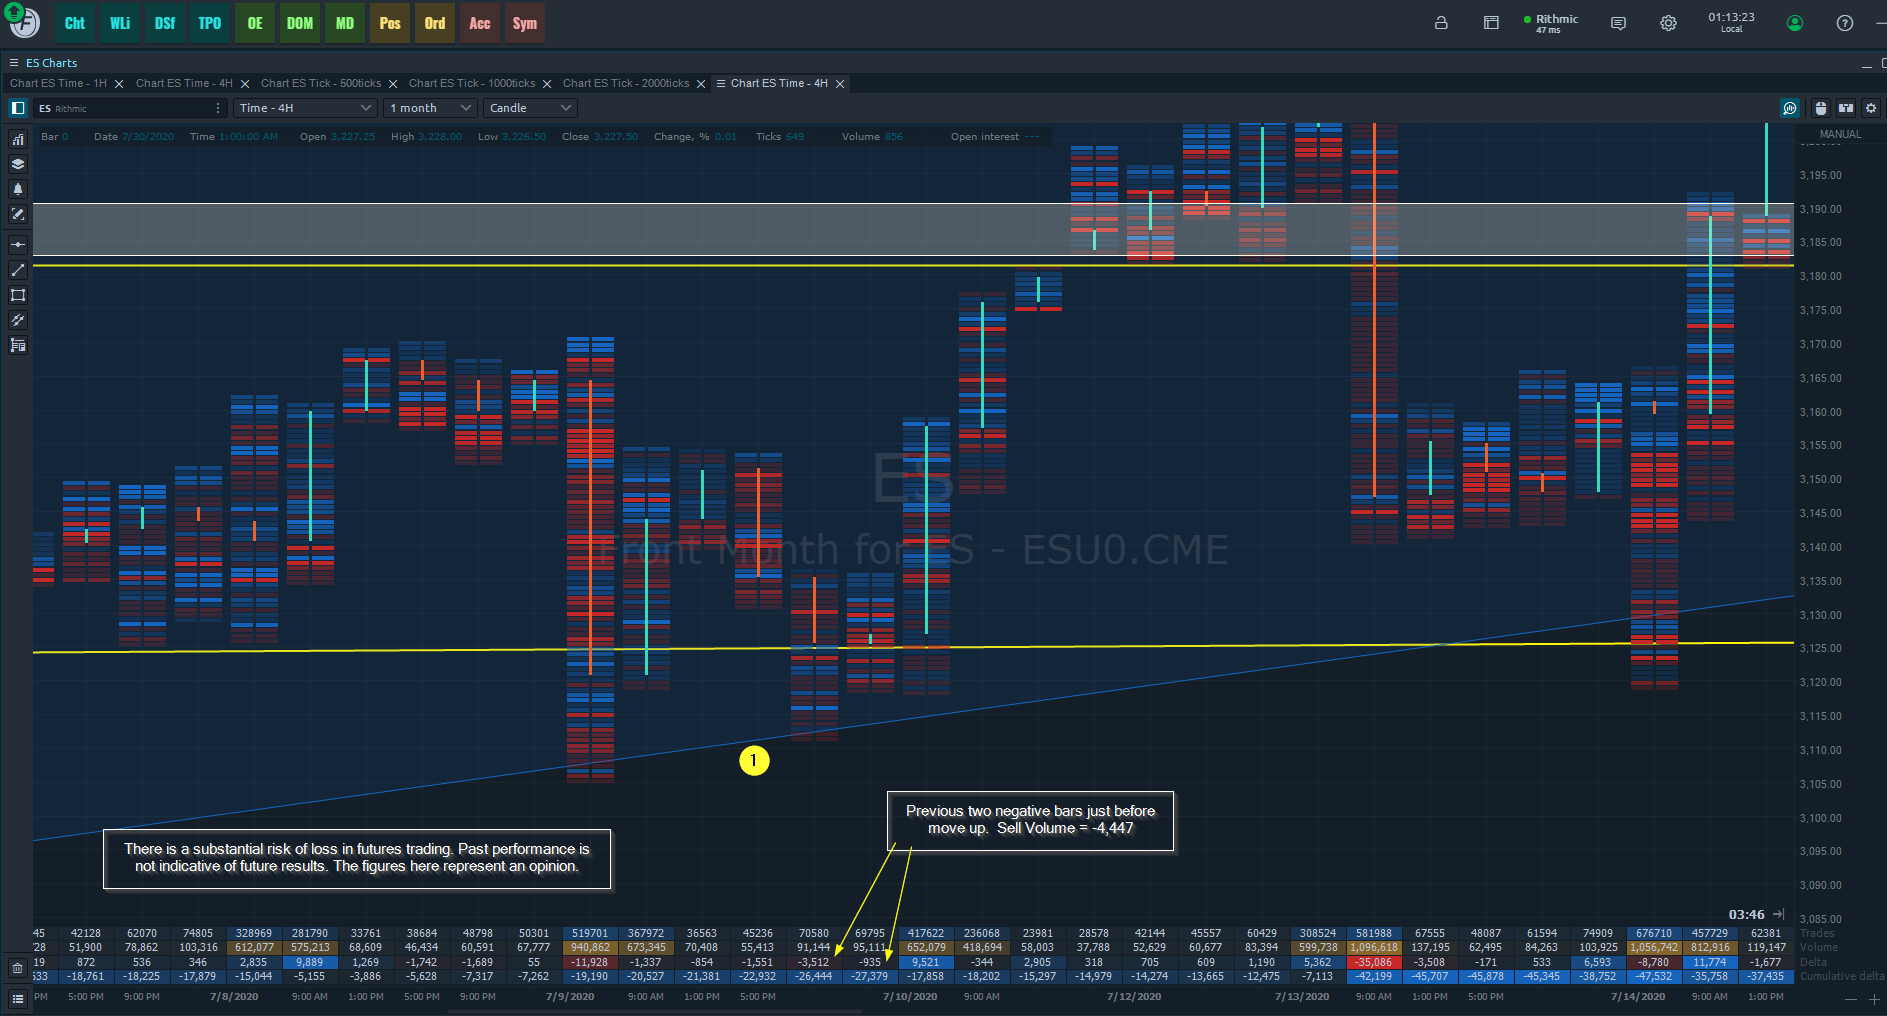
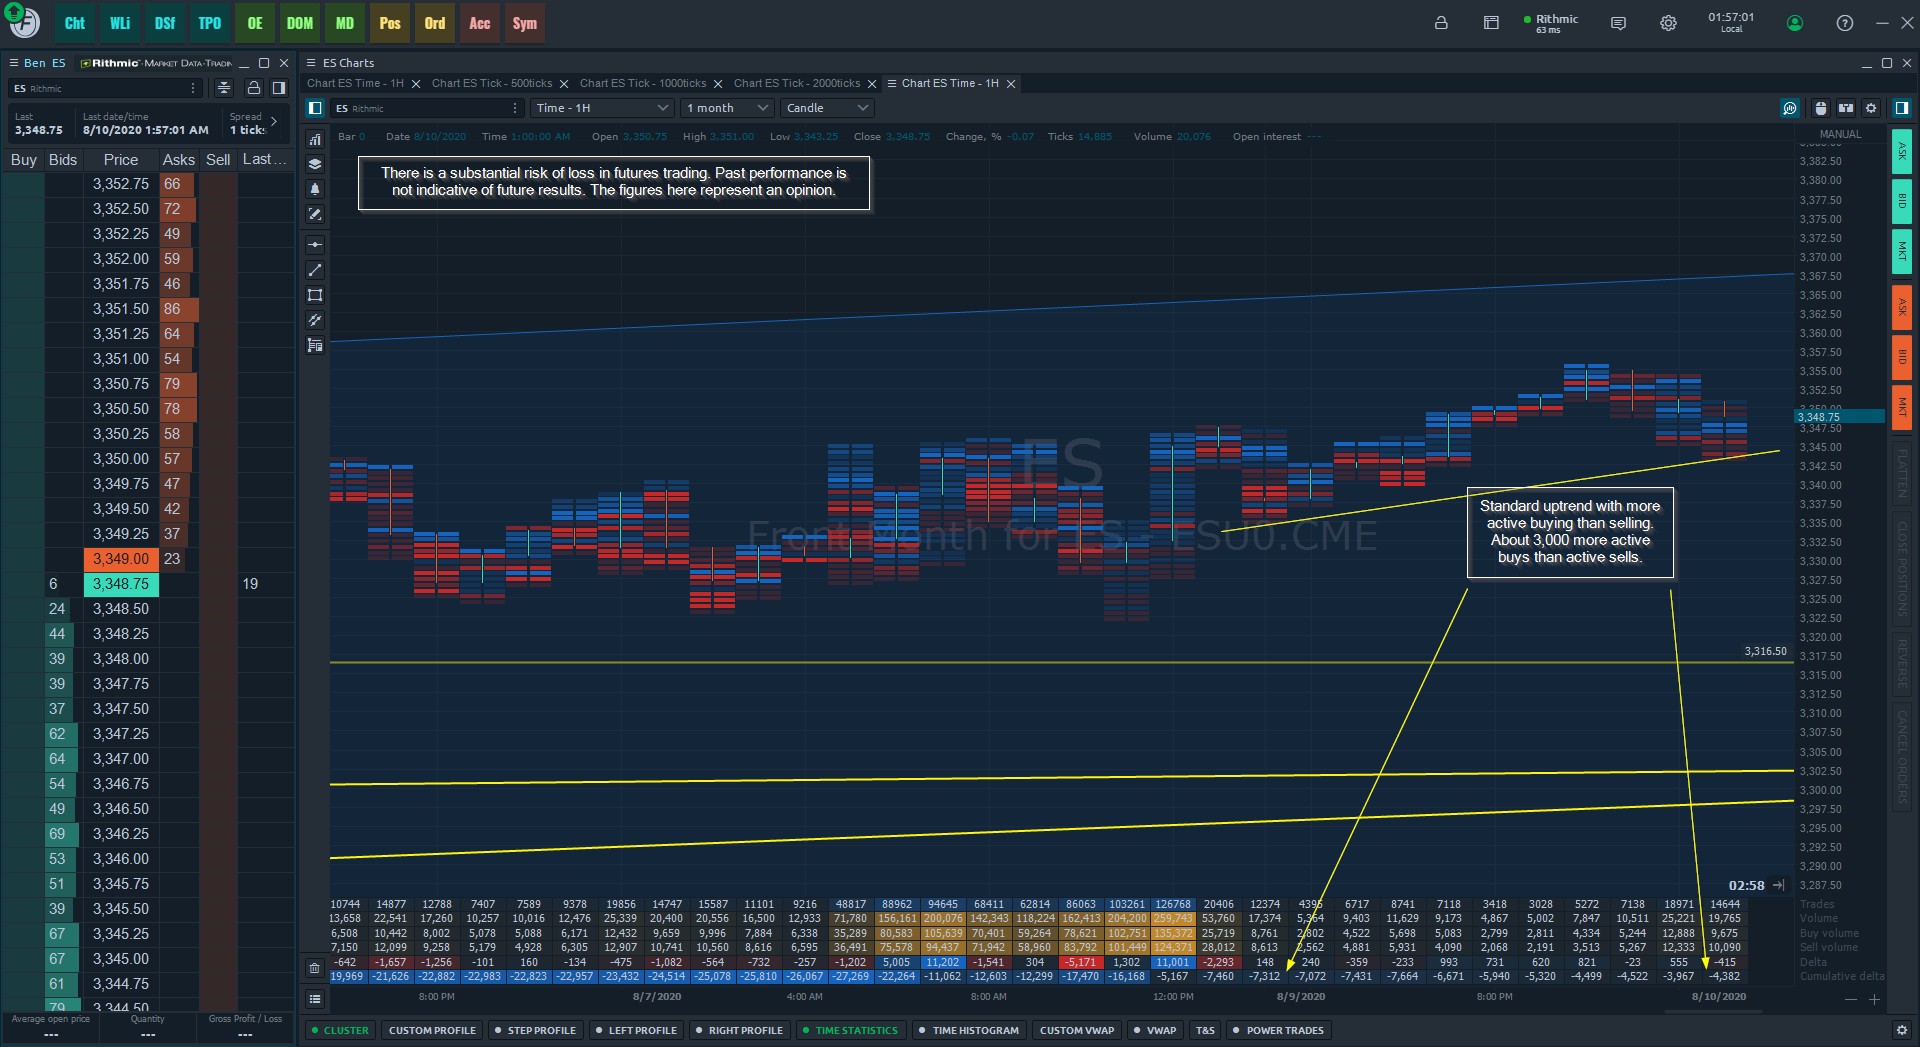
So, for the first significant test of support on the long term uptrend happened on 7/9:

I’m taking the two closest negative bars before the move up out of the range to calculate the amount of active selling contracts hit the bid.

Spot 1 = -4,447 Delta.

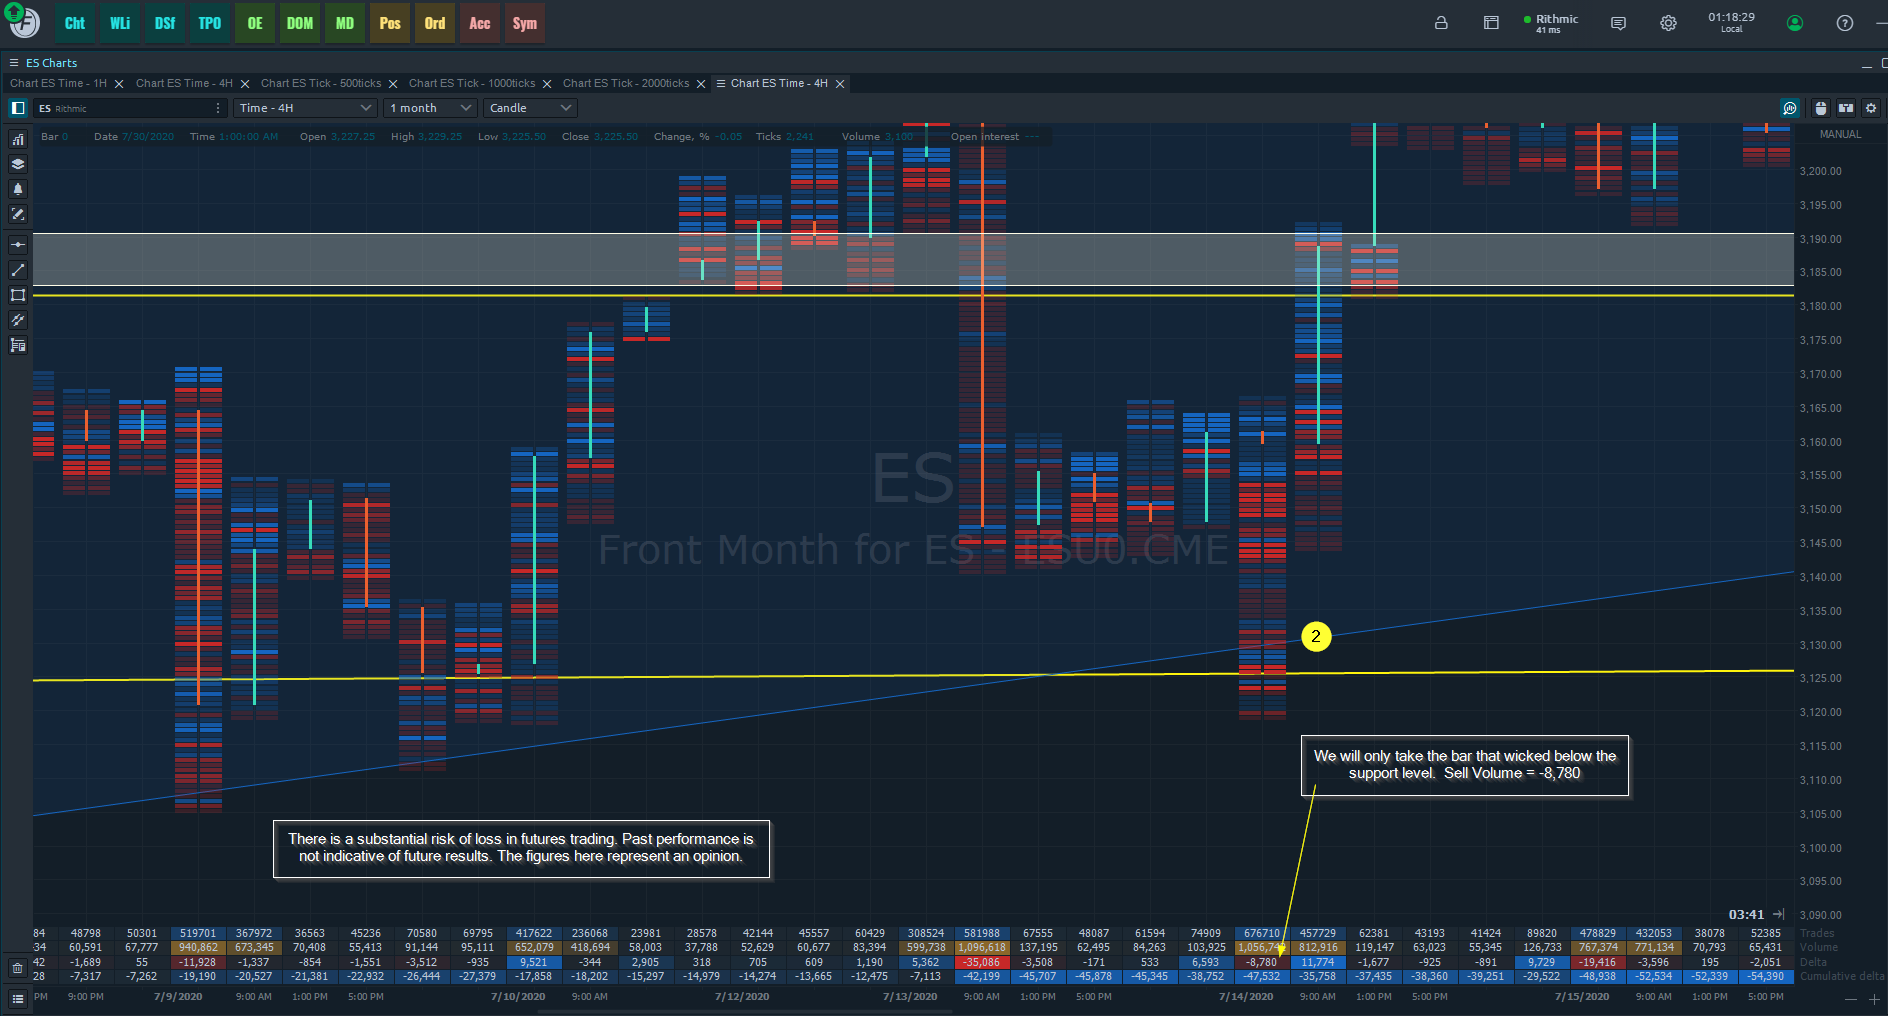
Second test was a few days later on 7/14:

Spot 2 = -8,780 Delta.

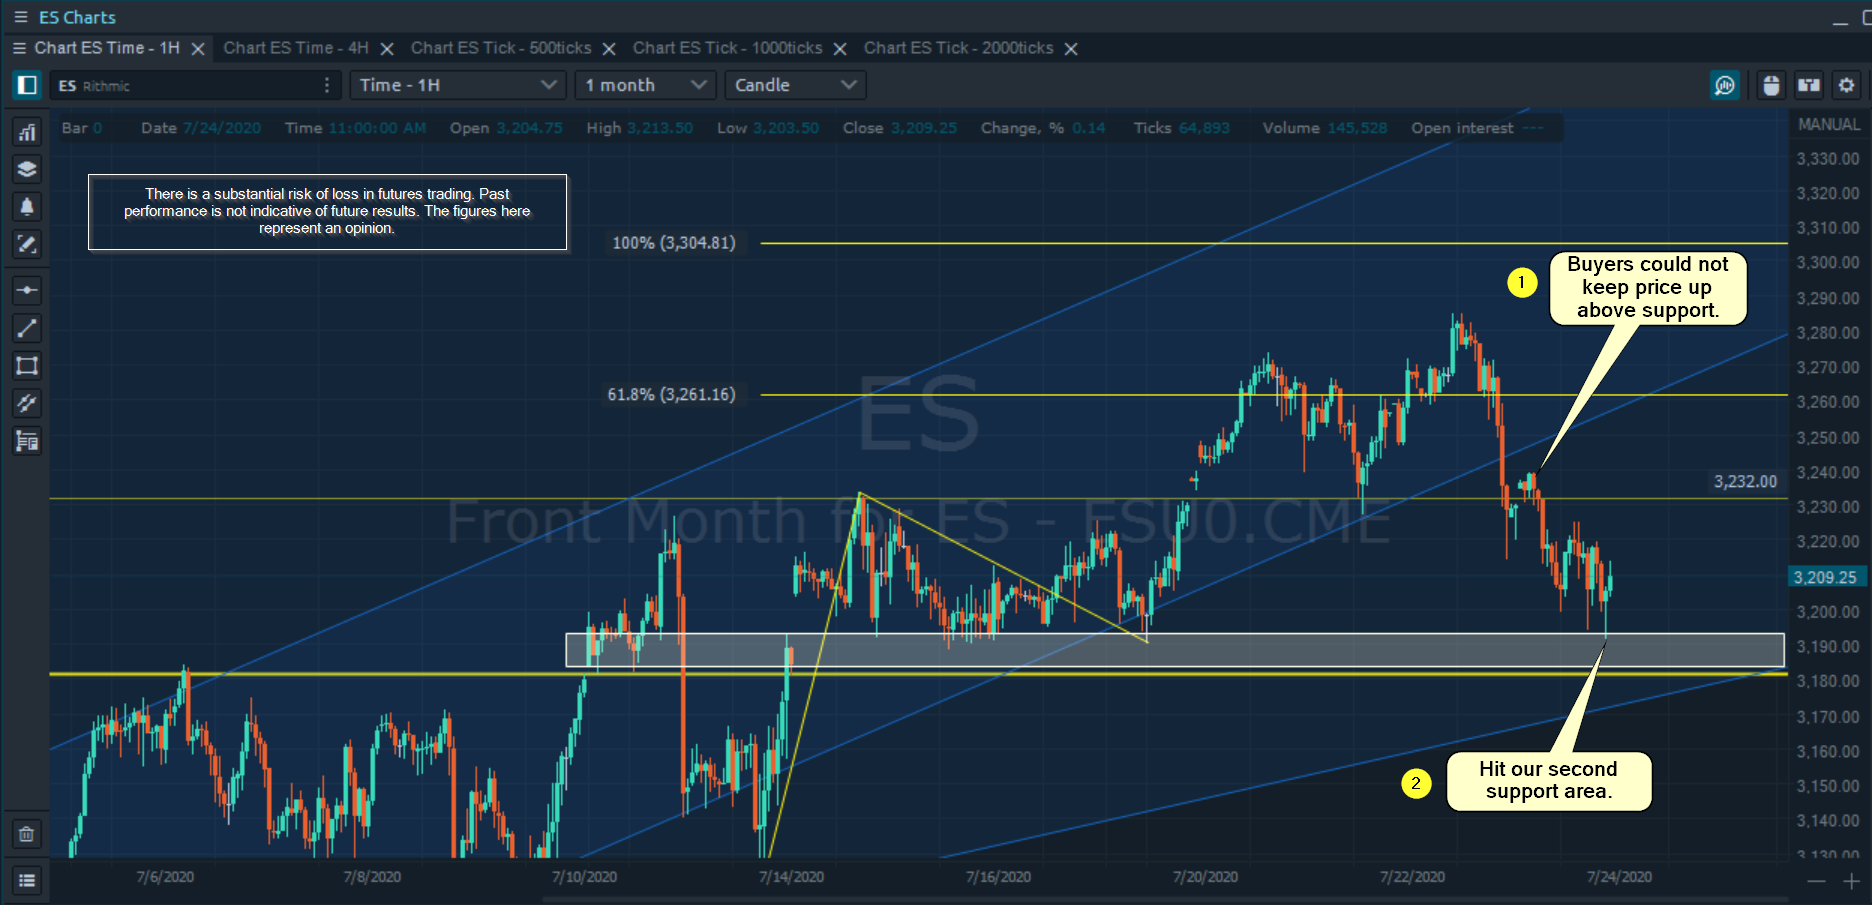
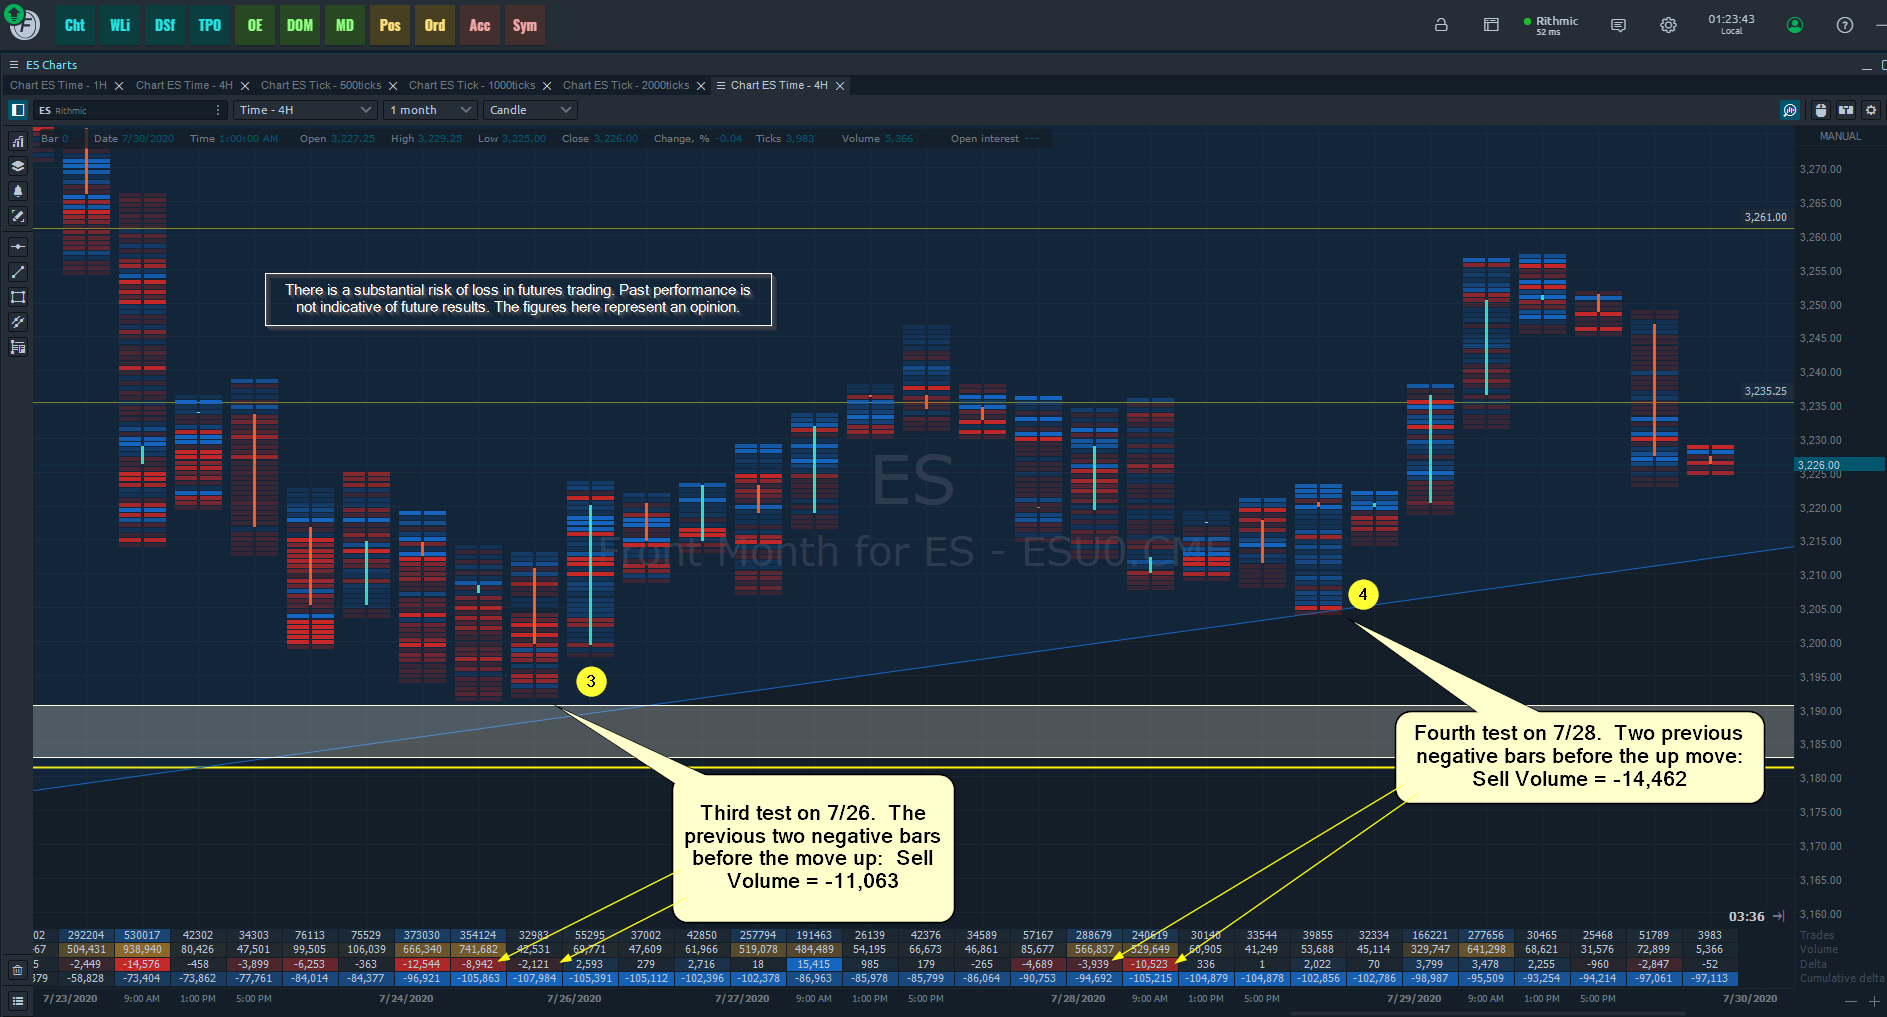
Third and fourth test:

Spot 3 = -11,063 Delta.
Spot 4 = -14,462 Delta.

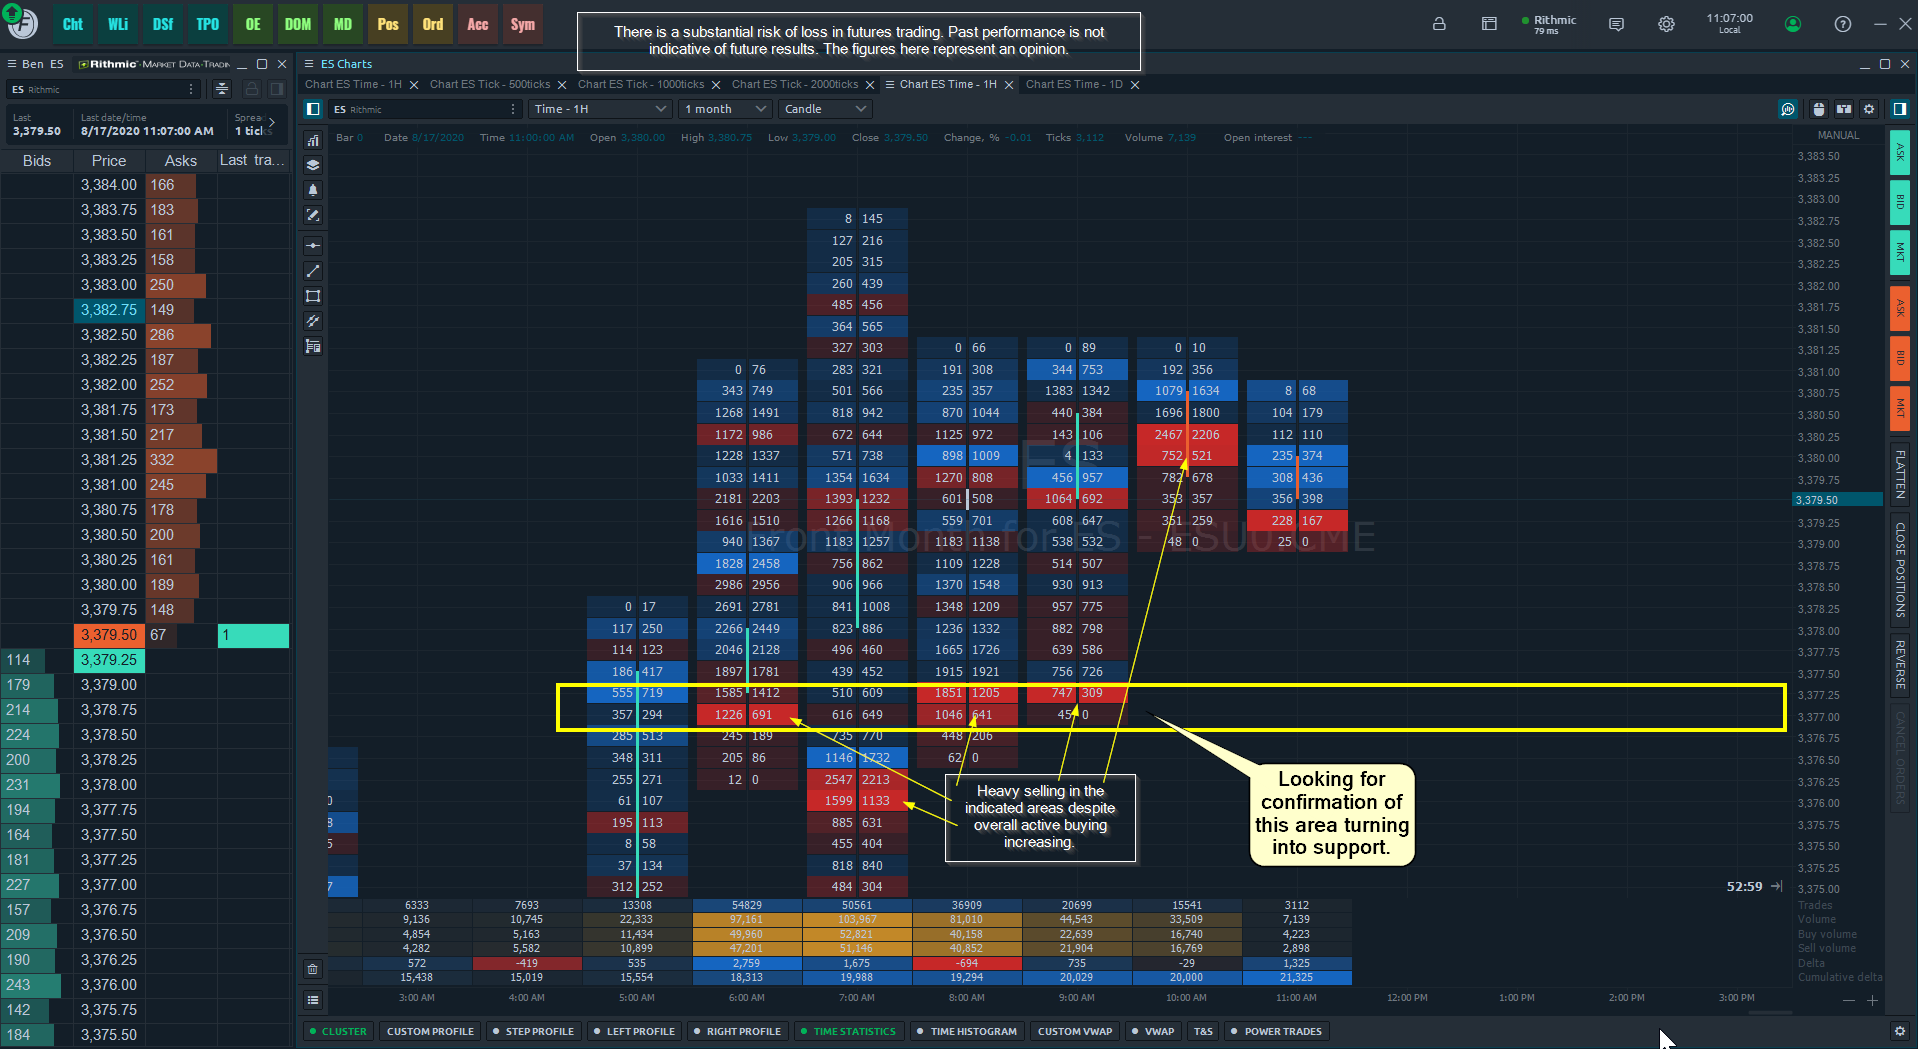
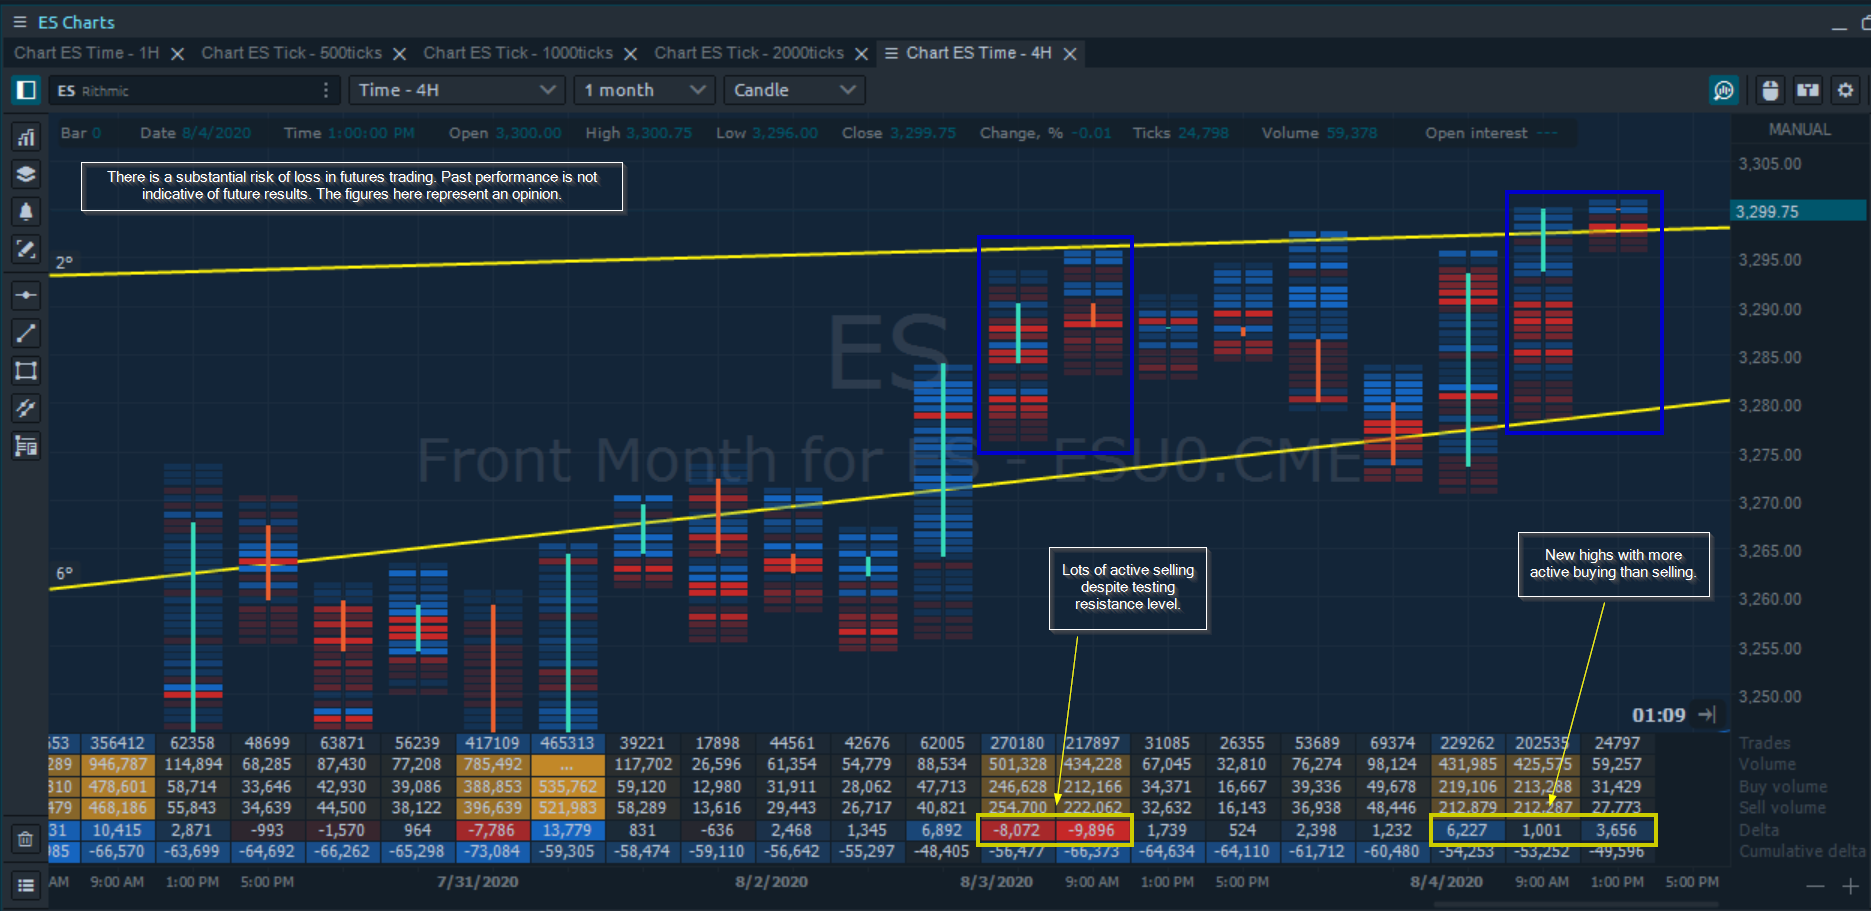
So we have price moving higher while the support tests are attracting more active sellers.

To recap:

Spot 1 = -4,447 Delta. Price = 3113.75
Spot 2 = -8,780 Delta. Price = 3129.75
Spot 3 = -11,063 Delta. Price 3188.00
Spot 4 = -14,462 Delta. Price = 3201.25

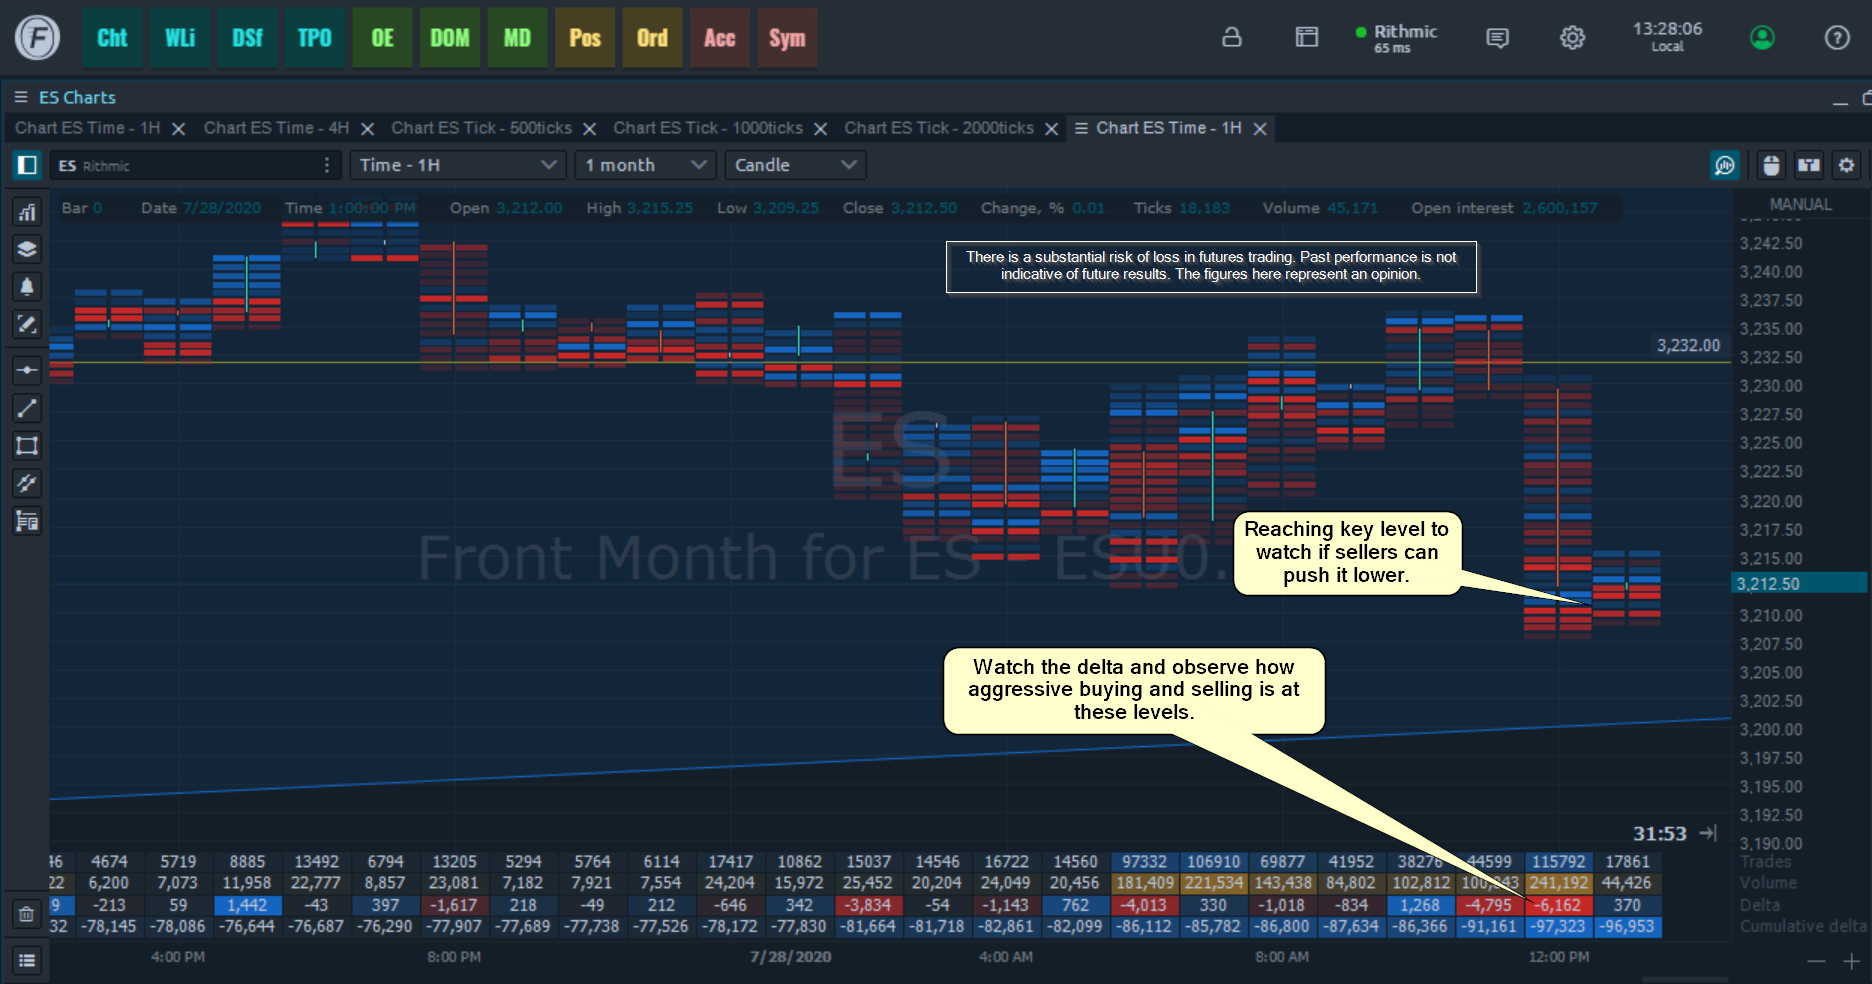
So we are seeing more selling at the support levels at HIGHER prices.

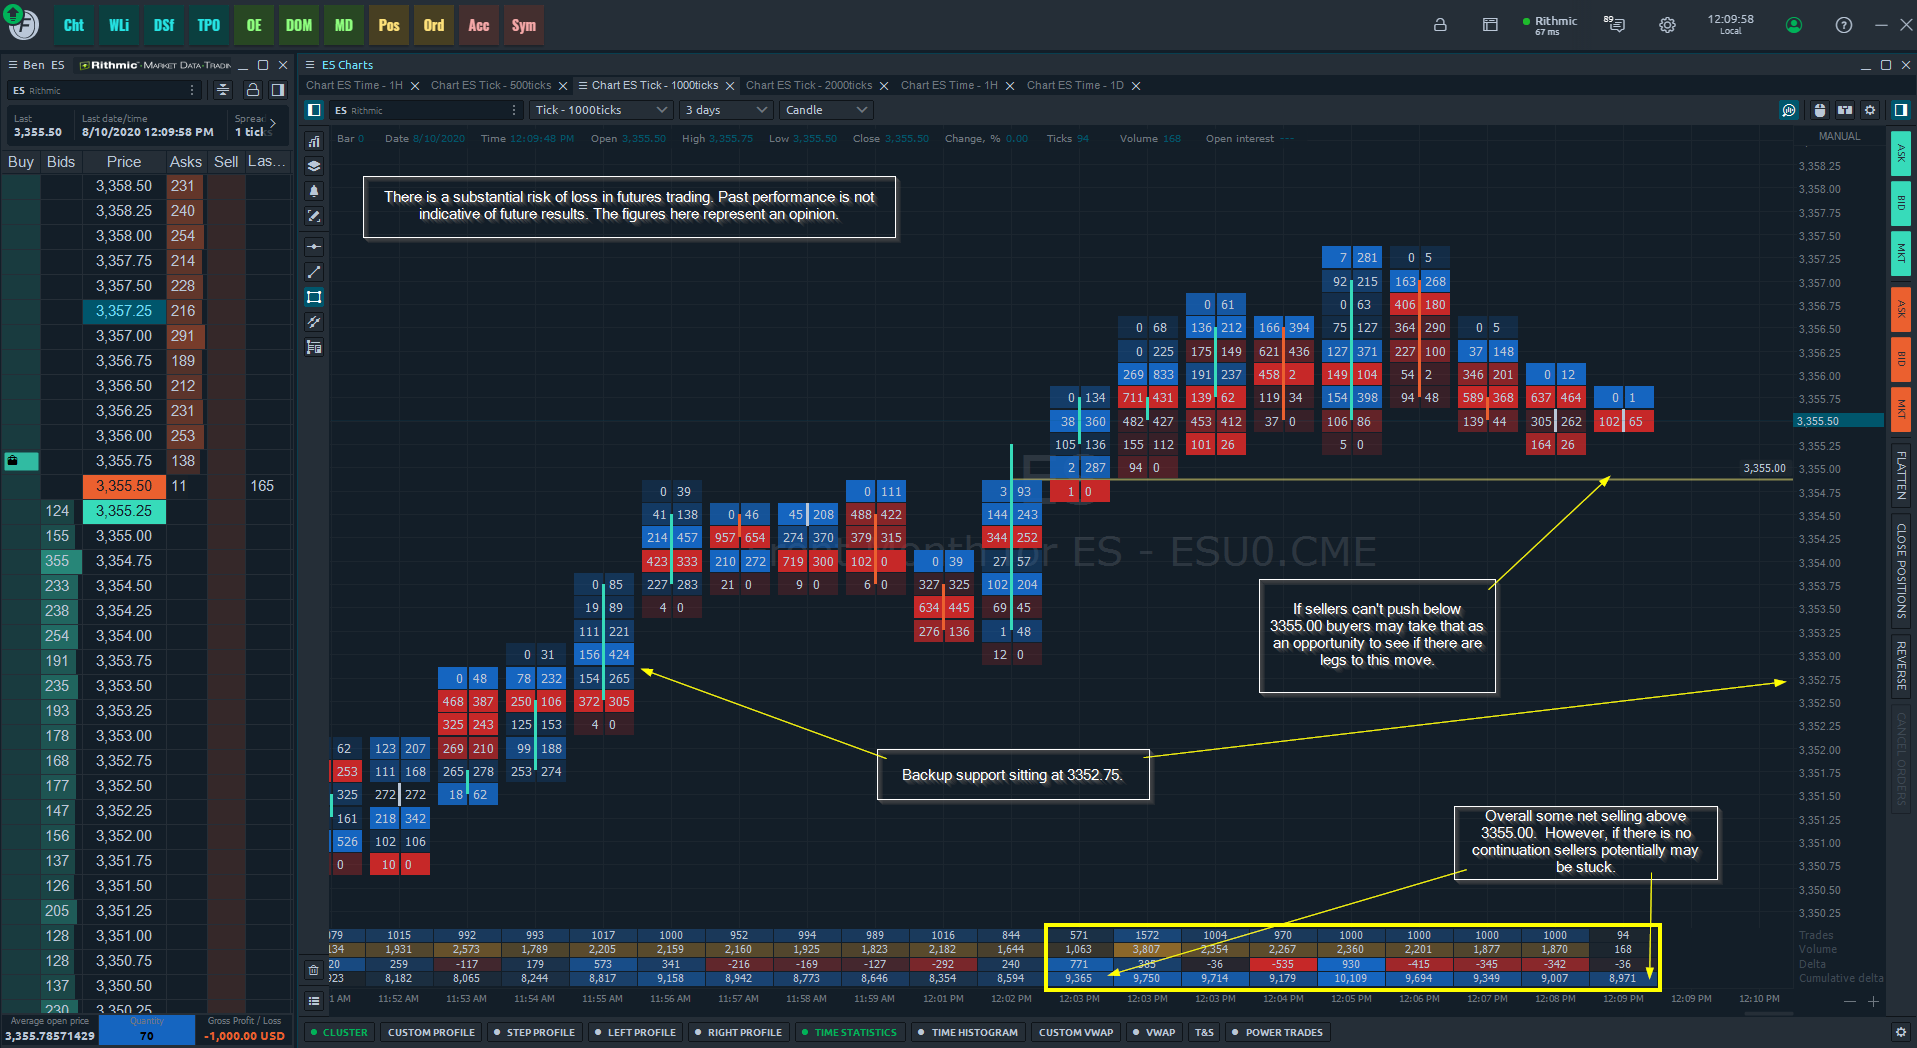
In fact, we saw a TON more active selling throughout the entire move from 3113.75 to 3201.25.

The Cumulative Deta started at -19,190 at Spot 1 and ended at Spot 4 at -102,856.

So a total of 83,666 ACTIVE sell contracts in a move up of 87.50 points.

With price moving up despite the massive amount of selling on Cumulative Delta, this means that on price moves up it didn’t require a lot of active buying because there weren’t as many sellers offering.

I have two questions here because I do think the market may potentially come to a pivotal point with a significant move ensuing:

  1. Are banks and big players selling the dips that are being absorbed by optimistic retail traders?

  2. Or are the banks and big players on the bid passively getting long, which would support why we are seeing aggressive selling into the lows and it fails to break below support?

What are your thoughts?

Charts Courtesy of Optimus Flow

There is a substantial risk of loss in futures trading. Past performance is not indicative of future results. The figures here represent an opinion. The placement of contingent orders by you or broker, or trading advisor, such as a “stop-loss” or “stop-limit” order, will not necessarily limit your losses to the intended amounts, since market conditions may make it impossible to execute such orders. Please conduct your own due diligence if Futures are an appropriate instrument for you.

1 Like

I got another great reminder today that updating your charts daily can help identify so many more opportunities.

Here is the hourly candle chart I always keep updated:

Notice how closely the market is trading near key levels.

It’s trading “as expected”. This can be a fun time to trade, when your expectations of what the market should do aligns with what it is actually doing.

Keep updating your charts and watch cluster charts near key levels! Have a good weekend.

There is a substantial risk of loss in futures trading. Past performance is not indicative of future results. The figures here represent an opinion. The placement of contingent orders by you or broker, or trading advisor, such as a “stop-loss” or “stop-limit” order, will not necessarily limit your losses to the intended amounts, since market conditions may make it impossible to execute such orders. Please conduct your own due diligence if Futures are an appropriate instrument for you.

1 Like

ES Mini’s continue to move up. I’ve updated some key levels and other trend lines I’m seeing to better identify key levels or areas.

Cluster Chart with market delta coming next.

There is a substantial risk of loss in futures trading. Past performance is not indicative of future results. The figures here represent an opinion. The placement of contingent orders by you or broker, or trading advisor, such as a “stop-loss” or “stop-limit” order, will not necessarily limit your losses to the intended amounts, since market conditions may make it impossible to execute such orders. Please conduct your own due diligence if Futures are an appropriate instrument for you.

1 Like

After Close Market Update

The hourly bars closed above a resistance level at the close of trading today which potentially indicates the strength of the market until prices continue to keep moving up.

As we have seen lately, the market continues to challenge levels of support so be aware of a potential retrace to key levels of support:

Although price is following the trends along with support and resistance levels, there’s a lot more happening beneath the surface:

Here’s our cluster chart with time statistics. As you can see, the first high actually had more active selling than buyers despite price moving up. On the second high, there was more active buying than selling.

This potentially could indicate a change in overall sentiment of the market as it appears that more buyers are interested in these higher prices than before.

I will be watching to see if they can keep prices high or what their risk tolerance is in the case of a retrace.

Charts Courtesy of Optimus Flow

There is a substantial risk of loss in futures trading. Past performance is not indicative of future results. The figures here represent an opinion. The placement of contingent orders by you or broker, or trading advisor, such as a “stop-loss” or “stop-limit” order, will not necessarily limit your losses to the intended amounts, since market conditions may make it impossible to execute such orders. Please conduct your own due diligence if Futures are an appropriate instrument for you.

1 Like

Price is continuing to respect key levels in this uptrend. Take a look at my last post, the key changes there were two things:

  1. The hourly bar closed three times above 3299.75, indicating some acceptance of the move up.
  2. On the market delta, I pointed out two spots that showed active selling on the first test of resistance, then on the second test we actually saw more active buying. This was a significant change in sentiment.

Here’s our charts about 6 hours before market open:

That change in sentiment moved the market up 20 points and is now sitting above support at the 100% fib extension level from the previous rally then retrace.

If you look at the market delta, you’ll notice that once price was established above the 100% fib extension support line, selling seemed to dry up near that level going into the night session:

If sellers fail again to push it lower it may potentially attract buyers to bring price up further.

Charts Courtesy of Optimus Flow

There is a substantial risk of loss in futures trading. Past performance is not indicative of future results. The figures here represent an opinion. The placement of contingent orders by you or broker, or trading advisor, such as a “stop-loss” or “stop-limit” order, will not necessarily limit your losses to the intended amounts, since market conditions may make it impossible to execute such orders. Please conduct your own due diligence if Futures are an appropriate instrument for you.

1 Like

Price moved below the new support but quickly retraced and is currently holding above it:

On market delta, it was evident buyers were quick to pick up the lower prices which pushed the market back up.

Charts Courtesy of Optimus Flow

There is a substantial risk of loss in futures trading. Past performance is not indicative of future results. The figures here represent an opinion. The placement of contingent orders by you or broker, or trading advisor, such as a “stop-loss” or “stop-limit” order, will not necessarily limit your losses to the intended amounts, since market conditions may make it impossible to execute such orders. Please conduct your own due diligence if Futures are an appropriate instrument for you.

1 Like

Price is moving up and here is the level for the 127% fib extension level.

Watching for a test of the 3333.00 level to see if that will be an accepted level by the market.

Charts Courtesy of Optimus Flow

There is a substantial risk of loss in futures trading. Past performance is not indicative of future results. The figures here represent an opinion. The placement of contingent orders by you or broker, or trading advisor, such as a “stop-loss” or “stop-limit” order, will not necessarily limit your losses to the intended amounts, since market conditions may make it impossible to execute such orders. Please conduct your own due diligence if Futures are an appropriate instrument for you.

1 Like

I love the weekly analysis before the open. You get to see the big picture and dial down on the key levels you’re interested in. What I haven’t done in a long time is exactly that, look at the big big picture. It’s easy to get caught up in the day to day.

So I’ll do this one a little different it will be a test or game to see if anything longer term is contradicting what my shorter term always updated charts are saying. So we will start with my first chart showing the bounce off the 161.8% Fib Extension:

If it remains a typical uptrend, the dips will hit support and sellers may show up at first, but potentially back off without any downside continuation.

Market Delta doesn’t show anything out of the ordinary. After hours small uptrend with positive delta. The only thing to note was around the 3325.00 level when sellers were testing those lows during the day, the following lows were accompanied by LESS active sellers.

We’ve seem to see this particular pattern in an uptrend. Price goes above support, sellers want to reject it so there’s heavy selling on the first test. Heavy selling on the second test but we calculate the delta and watch volume to realize there was actually less selling. On the third if it holds a potential buy opportunity.

Now let’s take a look at a longer term chart:

Turns out, I did miss some things by not keeping my longer term charts on point :grimacing:. That’s OK, it’s a new week and now more information than we had before.

It appears that price could potentially converge on a key intersection. I have to admit, although order flow is the key driver of price, I think the news will effect order flow significantly.

Stay up on news and numbers, watch order flow and cluster charts to see buying and selling.

As always, comment with any questions.

There is a substantial risk of loss in futures trading. Past performance is not indicative of future results. The figures here represent an opinion. The placement of contingent orders by you or broker, or trading advisor, such as a “stop-loss” or “stop-limit” order, will not necessarily limit your losses to the intended amounts, since market conditions may make it impossible to execute such orders. Please conduct your own due diligence if Futures are an appropriate instrument for you.

2 Likes

ES Mini’s are making new highs. The price of my resistance is sitting about 3362.00. We will see if buyers can keep putting pressure on that level or if they give up and let it go back down to the bottom of the channel.

Here’s the Market Delta chart:

Let’s see what sellers can do and have their turn, if they fail to bring prices lower they potentially could puke at new highs.

Charts Courtesy of Optimus Flow

There is a substantial risk of loss in futures trading. Past performance is not indicative of future results. The figures here represent an opinion. The placement of contingent orders by you or broker, or trading advisor, such as a “stop-loss” or “stop-limit” order, will not necessarily limit your losses to the intended amounts, since market conditions may make it impossible to execute such orders. Please conduct your own due diligence if Futures are an appropriate instrument for you.

2 Likes

Market continues to move up, however it’s looking like price is coming to a point where buyers and sellers are going to have to decide if they stick with their original outlook:

On Market Delta, there is heavy selling at the lower prices, but overall an increase in active buying which could potentially indicate a positive outlook on the market:

Charts Courtesy of Optimus Flow

There is a substantial risk of loss in futures trading. Past performance is not indicative of future results. The figures here represent an opinion. The placement of contingent orders by you or broker, or trading advisor, such as a “stop-loss” or “stop-limit” order, will not necessarily limit your losses to the intended amounts, since market conditions may make it impossible to execute such orders. Please conduct your own due diligence if Futures are an appropriate instrument for you.

1 Like

not sure if anyones mentioned it but thanks for sharing. learning lots from this.

3 Likes

Thank you Zorann!

Sorry I haven’t posted in such a long time, getting back into it.

I’m personally wondering how this market has continued to trend up. I like to remain objective, but at the same time I have trouble figuring out how it adds up.

Nonetheless, the market does what it does lol.

Here’s my initial trend lines and key zones I’m looking at:

If the market continues up it will have to break and maintain price above 3800 to 3810.

However, the price appears to be soft against the resistance zone of 3790 to 3805.

If price movement confirms the lack of buying past this point shorts could come in and test lower resistance levels.

If price moves up, I have the top channel resistance estimated around 3860 to 4000 based on time.

There is a substantial risk of loss in futures trading. Past performance is not indicative of future results. The figures here represent an opinion. The placement of contingent orders by you or broker, or trading advisor, such as a “stop-loss” or “stop-limit” order, will not necessarily limit your losses to the intended amounts, since market conditions may make it impossible to execute such orders. Please conduct your own due diligence if Futures are an appropriate instrument for you.

1 Like

Yesterday we looked at levels to watch in order to get an idea of where the market could go based on price action near those levels.

Overall the market is in an uptrend, so while a short was possible if price couldn’t continue upwards, new buyers came in above the 3808 level.

As you can see, I’ve marked the new bars since the last chart in the rectangle box. This is an hourly chart which can make it hard to see where the entry on a long position could have been. Let’s break it down a bit more:

On the 15 minute chart we can see that once it broke above AND ALSO closed above that trendline there was no looking back. You can also see this pattern on a 5 minute chart for potential entries.

For retracements and levels take a look at the hourly. This is drawn under current market conditions and does not factor in whether this move will stop here or continue up. It will need to be monitored to confirm the top of this move for a more accurate fib retracement model:

However, the longs are still moving the market and I will not be looking at short opportunities until the market proves it’s ready to turn.

When we were scalping the market it was easier to see when buyers or sellers have exhausted a move and you could fade the tops or bottoms for a few ticks. That type of trading is very short term and risky, therefore I’ve found it much easier to go with the market and not fight the existing momentum.

There is a substantial risk of loss in futures trading. Past performance is not indicative of future results. The figures here represent an opinion. The placement of contingent orders by you or broker, or trading advisor, such as a “stop-loss” or “stop-limit” order, will not necessarily limit your losses to the intended amounts, since market conditions may make it impossible to execute such orders. Please conduct your own due diligence if Futures are an appropriate instrument for you.

1 Like

I have adjusted the top of the Fibonacci Retracement below as the top of the move has been confirmed.

As price broke below the short down trend within the longer term uptrend, buyers supported price and it was unable to break the lower trendline. This caused the price to reverse and move towards the upper trendline and we are starting to see a mild pull back.

Fib levels and support areas will continue to be extremely important to identify entries on the long side.

There are many levels diverging together that may result in larger moves, especially if price does not continue to validate the uptrend.

I’ll be looking for long entries as price tests support levels but do not intend to catch anything on the downside since it is not with the overall trend.

At the same time, I have to wonder how many new buyers are coming in at the highs. Short trades are riskier in this climate but could provide quick wins as buyers cover at the highs.

There is a substantial risk of loss in futures trading. Past performance is not indicative of future results. The figures here represent an opinion. The placement of contingent orders by you or broker, or trading advisor, such as a “stop-loss” or “stop-limit” order, will not necessarily limit your losses to the intended amounts, since market conditions may make it impossible to execute such orders. Please conduct your own due diligence if Futures are an appropriate instrument for you.