Same Trading Volume, Different Trade Results - Why?

Hello Everyone :slight_smile:

When I was trading this Morning, I noticed there were two opportunities for a potential short. The market had climbed, and was starting to taper off and volume was decreasing steadily. However only one of two situations did we actually get a pretty good sell off, even though all the events leading up to it and during it seemed almost identical, we had a selling imbalances, bid side delta winning at the top of the candle sticks and a sizeable volume decrease.

Situation 1: Failure to sell off

Situation 2: Actual sell off

Everything seems so similar in both situations, from the volume, to the imbalances to the deltas. What do you all think? Did I miss something?

Thank-you!

I wrote a long response that explains the context of the first few hours of the session in detail including an annotated chart, but you may learn more by thinking through things more yourself than from reading my explanation. You asked some questions, probe into those more deeply and we can have a discussion about it if you want. We’ll use the Socratic method and the more effort and thought you put into it the more detail I’m willing to go into (this is how I’m going to do things from now on in general). There’s many things that you are not at the stage of being aware of yet, but I want you to start building on ideas that you already have. Use whatever resources you want to in order to think more deeply about what’s happening. Look at a normal chart too, there is a tremendous amount of valuable information if you train yourself to look for it. You have a tab for Market Profile already so you can use that to find some contextual clues too.

What assumptions are you making about volume?

Here are some other classic trading questions to get started:

  1. What is the market trying to do?
  2. How good of a job is it doing?
1 Like

Thank-you for the response! Yes, I am building upon my questions. I make sure after I ask them here, that i’m also doing my own research to hopefully arrive at an answer. The best answer I arrived at is, that at best you can only manage risk. I’ve been able to improve my risk to reward ratios so that even on the charts above, I can make a slight profit. I do however want to understand a few different things you mentioned; larger time frame players, and what is the market trying to do. Everyone always says, buy when the market is up, however I find it tough to find the direction of the market when we’re trading given different time frames can say different things. Lastly; the article response you mentioned, is it this ‘‘A useful exercise to improve price action analysis skills’’.? I will make sure to give it a read as well.

Thank-you!

1 Like

No, I wrote a response last night to your question in this thread talking about numerous contextual clues but didn’t wind up posting it because I want to try this instead.

Managing risk is important but there’s much more that can be done than just that.

Just to clarify, when I refer to various time frame participants I’m referring to the sorts of things that I was talking about in this post: How much should you change your trading strategy based on the Futures Pre-Market activity? - #3 by Trader
Not necessarily looking at higher time frame charts, there are signs of different participants being active even on a 5 minute chart once market logic is improved.

Start by asking yourself this: You said that you “noticed there were two opportunities for a potential short” and that “it seemed almost identical” but was that actually the case? Was the context the same in both scenarios? Were there factors that made the second scenario more reasonable for a short than the first? What assumptions are you making about volume?

2 Likes

Thanks for asking the trading questions and I appreciate that you are posting it. Continue to do so and start new threads if the topic is new.
I assure you that many new traders face the same conflicts, thoughts, and trade implementation.
But, not everyone has @Trader that takes his time to answer these questions with the practically it requires. So thank you for that as well.

Matt Z
Optimus Futures

2 Likes

Let me know if this is on the right path for addressing this.

Many times I find myself trading on a certain time frame, for instance scalping I’m looking for 4-8 tick moves.

However, if I enter on a longer time frame like a 5 minute chart then it moves against me, I tend to justify the trade and scale in, taking much more risk than I intended to.

That also throws my risk reward off drastically so when I take a loss it’s magnified.

It’s important to be aware of the larger time frame and trend, but that cannot change the implementation of the existing trade plan.

This week I’m only taking scalps and looking for quick moves in my direction. These trades need to be in line with the overall direction of the market. I want to trade with the direction on the 5 and 15 minute chart so trades move faster in my favor.

Right now the market has sold off and hasn’t broken the 38.2 resistance level. Therefore, I am looking for short trades until the market shows it is violating this structure.

What time frames do you trade and how long are you in a trade for typically?

There is a substantial risk of loss in futures trading. Past performance is not indicative of future results. The figures here represent an opinion. The placement of contingent orders by you or broker, or trading advisor, such as a “stop-loss” or “stop-limit” order, will not necessarily limit your losses to the intended amounts, since market conditions may make it impossible to execute such orders. Please conduct your own due diligence if Futures are an appropriate instrument for you.

1 Like

Thank-you Ben! Yes I saw on your videos you were utilizing the 15min charts. Ever since, I started trading with the trend ie imbalances and deltas i’m finding more success. I’m using now the 2000 tick chart for my entries, a 3000 tick chart for overall structure and 5min chart being used for relative volume and delta. I’ve had much more success lately as a result. I should look at adding in a 15min to see where the over all trend is headed.

One quick question, I notice on your youtube videos; you’re using a double footprint chart as opposed to an imbalance footprint chart; that shows you the same thing but also automatically highlights the imbalances. What made you decide against using the imbalance footprint chart? I’ve noticed a couple other professional traders aren’t using the imbalance charts either.

Ps those youtube videos have been really helpful!

Thanks Matt! Trust me I shall haha. The past month has been a huge step forward in-part thanks to these discussions.

Also yes we need to do a power clap for @Trader. Hugely helpful!

Thank-you
Bhupinder

2 Likes

Thanks @Trader!

One thing I’ve started to do is to ask myself when i’m taking a trade is to ask myself why I wouldn’t want to be in it. It’s proved to be helpful. Taking 30 seconds to evaluate has reduced losses.

I will take time to go through that discussion you highlighted! Thank-you for point it out, i’ll be sure to follow up regarding higher time-frame participants.

Bhupinder

Bhupinder

1 Like

When imbalances are highlighted, I feel more fomo. Monkey brain see red, enter short without thinking.

When I turn off the imbalance highlighting, I need to look at the actual numbers to work out what is going on, and that helps keep me sensible.

1 Like

Hey Ben, here’s my take (I know you’re an experienced trader but I’ll elaborate enough that newer traders can also follow the reasoning):

The trade-off when scaling into a position that’s moving against the original entry is potentially increasing probability of profit in exchange for greater risk. Since that’s the case, it’s important to trade small when scaling in. I also have a plan in my mind of how I’ll scale in before hand rather than trying to do things on the fly which can make things more manageable. There are different ways of scaling in like getting in at fixed intervals, adding on at other signals, and so on. Something that is a good rule of thumb is to not add on for less than a minimum scalp size so that even if the position is exited at the original entry price the scale in position would’ve made at least a minimum scalp. Minimum scalp for the ES is generally 4 ticks, but if the volatility picks up considerably then using 5-10% of the daily range as the target size is reasonable. It’s also good to have the scalp be approximately half the size of a normal bar. I’ve gotten a lot of ideas from Al Brooks, no affiliation with him, but I want to give credit where credit’s due.

Additionally, only scale in if the initial entry was actually a good entry. If it wasn’t, then the correct management decision is taking a quick loss rather than adding to a position that shouldn’t be added to. Also, I am continually monitoring the way in which the trade is unfolding so if I think it’s no longer a good idea to scale in I won’t. So scaling in can be something that is very useful but only when applied in the right context. For strictly scalping, going for 4-8 ticks, I try to be very selective about my entries so that I’m taking trades that either work or they don’t and I’m not trying to manage by scaling in/out. This has the added benefit of preventing carelessness in the original entry and then trying to dig myself out of a mediocre entry. When scalping for such small targets, I’m of the opinion that it’s generally better to just be all in/all out or all in/scale out rather than scaling in since the risk/reward scenario can become horrible very quickly, as you’ve also noticed. Don’t turn scalps into swings, it’s better to only scalp if the trade has a reasonably high probability of working from the get-go not as a result of management. Be patient about letting trades come to you and take the setups that jump out at you as being reasonable rather than getting in just because things are moving.

Here’s a screenshot of four 1 point scalps that were taken on a 2 minute chart earlier today. I wasn’t in front of the computer at the open so I missed that solid move up, but there were still a few good trades in the trading range that formed. The blue lines show the entries and the red lines are the exits, all trades were on the buy side only given the dominance of the bulls earlier in the session:


As you can see on here, I used limit order entries on the first and third trades, a stop order entry on the second, and bought the close of the last. So having multiple ways to enter the market can be useful when scalping. Holding times for all of these trades was less than a minute each. The only other thing on the chart is a 10 EMA. I draw and erase lines as I see necessary. I didn’t take everything that could’ve been taken, but took the trades that looked most reasonable to me based on the overall context. I stopped taking trades after these so that I could take a little time to write this response.

If you’re exclusively looking for 4-8 tick moves, then I’d recommend using something like a 2 or 3 minute, 2000 to 4000 tick, or 7500 to 10000 constant volume chart rather than a 5 or 15 minute chart. The 5 minute chart’s bars are generally too big to be scalping for such small targets unless money stops are used rather than technical stops, but I prefer the latter. The other way to scalp for 4-8 ticks is to get good at scaling in and being patient with letting the trades play out. I used to scalp more often for 1-2 points on the 5 minute chart or similar and scale in/out, but I prefer faster charts if I’m planning to only go for smaller targets. The chart that you wind up using will depend on your own preferences, how you like to manage trades, etc. The principles of reading and trading price action are the same regardless of what chart you use so pick something you like and know that the skills will be transferrable. I switch between charts every now and then just to break up the monotony, such as deciding to trade 4-8 tick scalps on the 2 minute chart today so that I could give some examples.

I personally don’t use Fibonacci retracements, but keep using it if you’re finding it to be helpful. I do use a price projection tool to look for potential measured move targets based on things like the height of a breakout, the height of a trading range, leg 1 = leg 2, etc. I pay a lot of attention to prior OHLC information, small trading ranges/pullbacks for potential magnets, prominent tails, etc. to help determine which direction I’d rather trade in, where and how I want to enter the market, whether there are signs that the market may be getting too long or too short, and so on.

Anyway, hope that helps, gonna get back to trading now!

2 Likes

Thanks for sharing your chart and trades! Looks like these were very nicely executed.

I completely agree with this. When you lay out your plan and follow it, knowing exactly what you are looking for and why, it really makes it easier to spot areas that are much higher probability.

You mentioned preventing carelessness and getting yourself into a bad situation by scaling. Again, couldn’t agree more. I’m looking for 4-8 tick moves with clear entry and exits.

I’ve been watching the overnight low and high more as well as the POC from the previous day.

There is a substantial risk of loss in futures trading. Past performance is not indicative of future results. The figures here represent an opinion. The placement of contingent orders by you or broker, or trading advisor, such as a “stop-loss” or “stop-limit” order, will not necessarily limit your losses to the intended amounts, since market conditions may make it impossible to execute such orders. Please conduct your own due diligence if Futures are an appropriate instrument for you.

1 Like

Thanks, haha yeah those worked out nicely

Yep, when doing this sort of thing I look to get in on limit orders when I’m betting on a breakout to fail and stop orders when I think it will succeed based on the overall context and that tends to be a reliable way to go about it. I generally prefer using a prior bar as a signal bar for entry rather than having my signal bar and entry bar be the same, except during very strong breakouts when the auctioning velocity is likely strong enough to lean on. For example, the first trade used that strong bull trend bar’s low and test of prior resistance to get in even though that was several bars prior to my entry.

By the way, I enjoyed watching the video that you and @autobahn recorded. It was a good conversation, I hope you guys post more of those. Although I don’t use Fibonacci retracements, I liked the idea of using a leg 1 = leg 2 MM and using a Fib level to project a potential area of where the sellers may come back in (at 1:03:26). I was impressed by the customization of autobahn’s chart book as well (custom tool bar, 50% retracements on the 30 sec. chart’s bars, showing the relative distribution of volume within a bar without needing to switch from a candlestick chart to a footprint, etc.). Also it’s interesting to hear how we ask ourselves the same sorts of questions, for instance: “if you were looking to get long, is this where you’d want to do it?” is something I frequently ask myself.

Just my take, but I think that 1000 lot on the bid (around 58:00) was more likely someone gaming the DOM than exiting a large short position. I don’t think someone who’s trading that large would be so price sensitive that he’d want to get out of all of it at a single level. If that were the case though, he’d probably use an algo to reload the bid rather than advertising that size. If I were trading that large I’d probably look to scale out in 25, 50, or 100 lot increments on the bid at various prices rather than trying to get out all at once. But hey, I don’t trade anywhere near that size so who am I to say how to go about it lol

2 Likes

Hi @Trader, I really like Al Brooks’ analysis and thought process. I have his consolidated book “Reading price charts bar by bar”. Do you have his other three books (Trading Ranges, Reversals, Trends) and would you say these are worth purchasing if I already have the consolidated one? In particular, I’m trying to establish if they are an easier read. His concepts are great, but I find his style of writing to be hard work.

@Bhupinderjhajj, I don’t remember this exact situation as it was some time ago now. But it seems there is a clear difference in your two screenshots - and that is the leg that is being traded.

The first situation appears to be the ‘A’ leg of a breakout. Many traders wait for a range to clearly break before getting in. So there will likely be traders on the sidelines waiting to get long and looking for the first opportunity to do so.

The second situation is different because now it is likely anybody that wanted to get long is already long, and in probability there will be more traders wanting to take profit than enter.

Regarding order flow, it is impossible to see from your static screenshot. But in real time, I would be watching this: At some point, price is going to stall and pull back a little. It is important to watch two things - the liquidity being absorbed on the rotation down (number of new buyers entering) vs the liquidity being absorbed on the next rotation up (longs wanting to exit, spooked by the last rotation down). This can give you a good indication of whether to exit, hold, add or fade.

What you’ve documented is the basis of Elliot Wave theory. A-B-C legs, with the C leg being the least risky for the reason I wrote above. Many traders only trade C legs, so in my experience they are not a good leg to fade.

Hey autobahn, here’s a picture of the 5 price action books that I have and recommend:

I came across Al Brooks quite early on and was at a point where I had no clue how to evaluate whether or not his ideas, or anyone else’s for that matter, were valid. How I went about learning was by getting his video course, I watched the first 55% of the price action fundamentals portion of the course, and then decided to start testing ideas in real time in a SIM account. He is quite repetitive and talked enough about how to trade using the ideas that I didn’t watch the how to trade portion of the course when I started experimenting. I didn’t feel like spending more time watching lectures at that point and figured that actively practicing would be more worthwhile (my view is that active learning and use of ideas in learning any skill is much, much better than passively reading or listening to lectures). Since I wasn’t sure whether it would work out or not, I also learned how to trade using order flow and, to a lesser extent, Market Profile in parallel so that I could decide through my own experiences which direction to put most of my attention. As I became more and more comfortable with seeing the ideas play out, being able to jump in on trades, I watched more of his lectures and spent more time on reading the three books.

The books are slow to get through and I agree that he’s not a particularly clear writer. For example, an Al Brooks phrase that pops into mind when talking about his writing style was something along the lines of “the failed failure failed.” That sounds like complete gibberish to someone who hasn’t spent a lot of time watching and trading the price action as it plays out throughout the day. These sorts of phrases are not too common in his writing though so it’s good for the most part. I completely get why people don’t like his books, they’re not that well-written and they take a long time to get through so it’s hard to make that sort of investment without knowing whether it’ll actually be worthwhile. The concepts are very useful though and it has made the market activity much more understandable and has been worth the effort for me. My perspective of the market has also been shaped by auction market theory and trading order flow and that helped clarify things as well. I can tell based on Brooks’ writing, lectures, interviews, and a few direct conversations that we have very similar personality types, innate characteristics, and ways of thinking so that may play into why the trading style has fit me well. I don’t know whether all other people will have the same experience with it if they put in the same amount of time, and based on the polarizing nature of his work that’s likely not the case, but it is worth spending the time evaluating whether reading charts bar by bar is something that appeals to you. For what it’s worth, based on some of the things that you’ve posted on this forum, particularly your post titled “How I test my futures trading strategies,” I think that it would suit you well because of the thoroughness with which you think through things.

If I recall correctly, Brooks mentioned that he wrote his first book in about a month so that could’ve certainly contributed to the lack of clarity. He starts the newer books by saying that he made a real effort to make them easier to read than that one and I haven’t had issues reading the new books. The three books have a lot of useful information in them but they can be very repetitive at times (As is abundantly clear to anyone who has read any of my posts, I’m a very wordy person too so I understand the struggle of whittling down thoughts lol). I wish he had written a single, clear consolidated book rather than splitting it up into 3 books just so that it would be quicker to get through multiple passes. I’ve been considering buying the first book too just to have a more abbreviated version of things.

The video course made it much easier to understand his writing, but you can probably gain enough familiarity with many of the concepts just by watching some of his free videos on YouTube. His old futures.io webinars on YouTube summarize many of his ideas as well. He has some free videos on his website as well. I’d recommend watching some of those and then revisiting his consolidated book to see if it is more readable after doing that.

One of the most significant benefits of working through his materials is that he teaches many ways of getting into the market and managing trades. This is something that I really appreciate about his work compared to some other well-known traders. For instance, there’s a Market Profile trader/educator who has said on numerous occasions that he gets angry if people ask him about entries and exits and that MP is a tool for understanding auctioning activity. I am the first person to agree that understanding market context is vital, but so is understanding how to actually take and manage trades. I like the fact that Brooks doesn’t shy away from talking about a ton of ways to take and manage trades based on the context and how he adjusts to trade different phases of the market cycle (breakouts, tight channels, broad channels, trading ranges). Plus with experience there are setups seen on pretty much every bar so then it’s more of a matter of evaluating the relative quality of the current opportunity and deciding whether to take it or not rather than feeling as though there aren’t many trades that can be taken. Even relatively quiet periods can provide scalping opportunities such as the ones on the chart that I posted before.

The other two price action books that I recommend are by Bob Volman. I’m surprised that these books aren’t well-known because they’re very good. His writing is much clearer than Brooks. The price action principles that he emphasizes have helped a lot too. For example, having a firm grasp on the relative quality of potential breakouts can give a much clearer idea of whether to trade in the direction of the breakout or fade it. That combined with ideas like “always in” from Al Brooks can be very helpful for having a framework to deciding whether or not to take a trade and how to go about it.

So all in all, I recommend Brooks’ stuff and it is a valid way of conceptualizing market activity, but it is slow going and a ton of time directly applying the ideas in real time is needed. That is the case with any style of trading though. Despite the apparent complexity, the ideas are actually quite straightforward and with practice become simpler to use. There are still portions of the books and course that I haven’t seen that I’m gradually working through, but at this point I understand the concepts well enough to have a solid framework to evaluate the market throughout the day and take reasonable trades. I’m still always looking to deepen and expand my skill set, I don’t anticipate that ever ceasing to be the case, and Brooks’ ideas have played a vital role in my development as a trader so far.

(Apologies for the length of the response, stream of consciousness writing becomes very unwieldy. Brevity is a skill that I would benefit from honing.)

2 Likes

I meant to post this response that I wrote at the time to @Bhupinderjhajj’s original question earlier but forgot about it:

Many contextual factors came into play. Understanding how traders take trades in trading ranges, breakouts (and the varying quality of BO opportunities), and channels was important. Measured move targets were very important. Seeing trapped traders was also very important. As was understanding how markets tend to respond to climaxes and the magnetic effect that the start of a climax can have. Knowledge of how traders use market, limit, and stop entries to get into the market is vital. Other details include gaps and micro gaps, pullback entries, and buying versus selling pressure. Clearly this is a large list, but these are a number of contextual factors that are important and aspiring traders have to learn to recognize these concepts and others playing out.

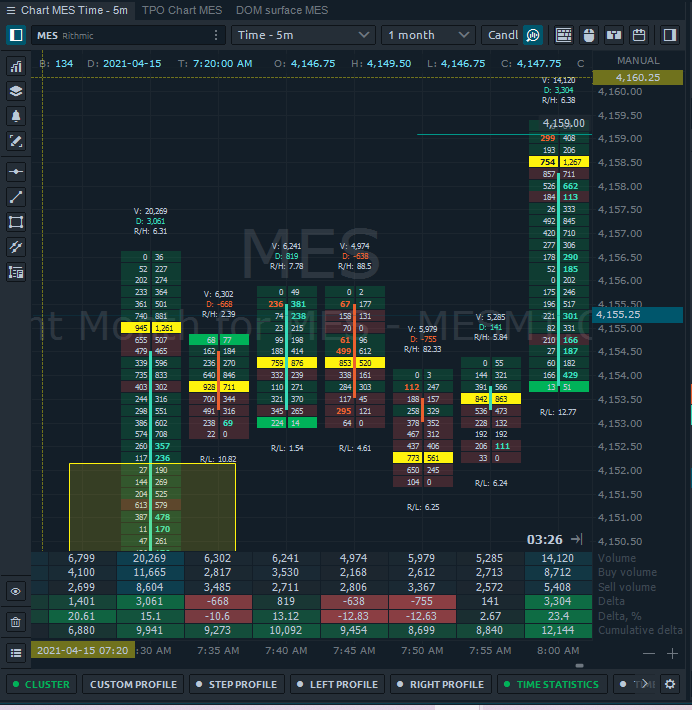
Let’s start with the first area where you saw an opportunity for a short. It was not an opportunity for a short (definitely not for an independent trader, maybe well-capitalized firms saw a reasonable short since they could scale in higher but probably not many of them given the relatively low volume). Markets can rise or fall on increasing or decreasing volume. You’re perceiving the lower volume in that area as a reduction in buying interest, but it was much more likely that strong bears were pulling their orders reducing the liquidity at those levels rather than buyers losing interest. Why am I quite confident about this? Because of what came before the market got to this point.

Now comes the very interesting stuff: Bears could have sold the high of the bear bar right before bar 3 on a limit order. If they then scaled in at the high of bar 3, they could have just barely gotten out with a 1 point scalp on their second entry and breakeven on the first since the market fell 5 ticks from the high of bar 3 on bar 4 and below the prior bear bar’s high. Based on the tails on top of bar 4 and 5, it is likely that bulls were scalping out and bears were entering on limit orders at and above the bar 1 high. The issue for the bears though was that the market was starting to successfully break out instead of being drawn back into the range. This means that the limit order short scalps that were working earlier in the session were no longer working. As a result, there were trapped bears. Notice also that the bar 5 low had a micro gap above the bar 3 high and didn’t have a lower tail, indicating that buyers were willing to buy near the highs of the range enthusiastically and bears were looking to cover their shorts potentially sooner than they would have wanted. Bears were no longer aggressively shorting the highs of the range (if they were, supply would have overwhelmed demand and prices would have fallen back into the range). Another tell-tale sign of trouble for the bears was the fact that the bar 6 open was a tick above the bar 5 close (another micro gap), indicating that bulls were willing to aggressively lift the offer. Likewise, bears who were disappointed by seeing a 3 bar bull micro channel were feeling the pain of their short positions and likely were also willing to aggressively cover their positions.

We’re not looking at the Market Profile here, it’s not necessary to do so, but if we were this open was an “open drive” at the upper edge of the prior session’s highs, which is potentially strong context for the bulls. Also consider the fact that bears couldn’t use bar 2 as a reversal on the open to drive the market back into the prior session’s value area or create a weaker open type. Many times what didn’t happen that reasonably could have is as important to understand as what did. Other time frame buyers were likely present from the open of the day and it is better to align with them.

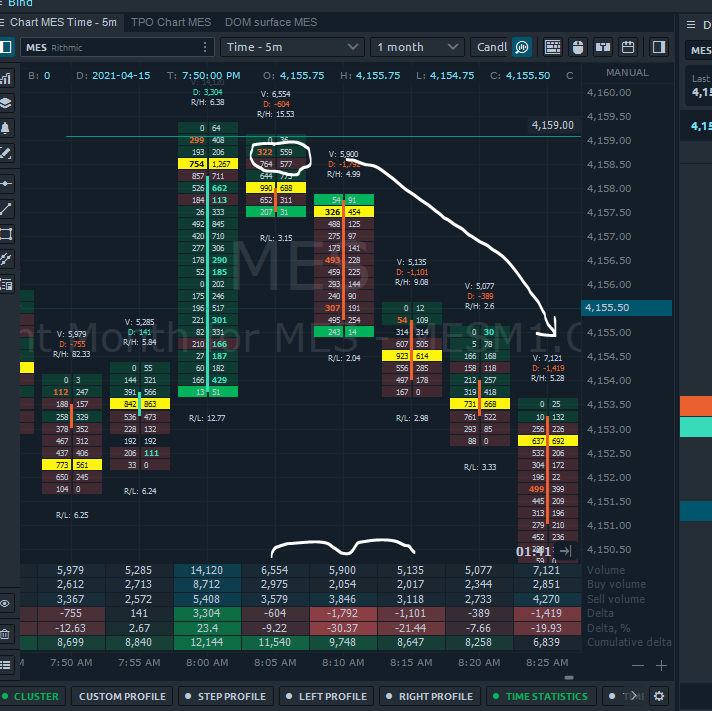
The nail in the coffin for the remaining trapped bears was seeing bar 6 close on its high (of course not all traders are trading off price action, but the market is the market, experienced traders - even if that’s programmed computers - get what’s likely going on regardless of the lens through which they’re viewing it). Bulls would already want to be buying that close, above that bar, below that bar, at the market, and now remaining trapped bears would also have to buy to cover which increases the buying pressure significantly. Remember how I said that the volume was potentially lower (I’d have to look at more of the footprint chart to see if it was actually lower or not, the volume on that bar in general was quite a bit higher than bars before it but the volumes in the yellow box do look relatively low)? Well, as I mentioned before, experienced bears would recognize the fact that the market was successfully breaking out to the upside, that bulls and bears would be buying and so there was very little reason to take a limit order short above bar 6 as bar 7 was forming. Where would they potentially look to get in instead? Potentially at a measured move up based on the height of the trading range, which contributes to the market reaching that point since bulls will keep buying and many bears will be waiting until the market gets to that point. Notice the tail on top of bar 7, this indicates possible profit taking and shorts being entered.

Between bars 7 and 9 the market mainly just paused, going sideways in a trading range (pullbacks are small trading ranges) rather than having any appreciable sell off. The market often does form a trading range for at least a few bars at measured move targets so this was unsurprising. Bar 8 formed a strong bear bar, but given the strength of the breakout that came before it and the ledge (3 bars with equal lows), it was a low probability short. The market would likely have another push up since the market cycle is breakout —> pullback —> channel —> trading range. It was higher probability to buy below that bear bar betting on a reversal to fail to get very far rather than shorting below it. After such a strong bull leg up, the best the bears would be likely to get is a bear leg in a trading range, so even if bulls did buy up there and the market went down, they could use a wide stop, trade small, and scale in lower thinking that the market would be likely to retest the highs of the trading range. Scaling in increases risk and shouldn’t be used by novices (practice extensively in SIM first!), but it can be a good management technique if applied correctly.

In this case, the second entry sell setup below bar 8 did trigger but it was a 5 tick trap. A bear that entered on a stop order below bar 8’s low of 4153.00 at 4152.75 looking for a 1 point scalp may not have been filled since the market only went down to 4151.75. Without actually dropping to 4151.50, this means that bulls were buying on limit orders at the same price where bears would be looking to get out of their 1 point scalp and not everyone would be filled there. The close of that entry bar was very weak, closing above the midpoint. Since it was still a bear bar some bears may have kept their stop above bar 8, hoping that the next bar would go down and fill their 1 point profit taking limit order. Seeing the next bar close with a bull body (bar 9, second entry buy setup) though was enough for buyers and sellers to buy. Trapped bears were squeezed out and sideline bulls had a good opportunity to jump in. In this case, the market had another buy vacuum test and climax to a measured move target based on the open to close of bar 7 (that would have been a reasonable stop area for bears who shorted the bar 7 close looking for a move to below the open of the bar which contributed to it being a potential target).

A large part of what drove the market up in that leg too was trapped sellers and bulls both buying. The break above the bar 7 high was a poor way to break out. Consecutive buy climaxes so far away from the average price also made it a relatively poor location to initiate a long position. These were also new all time highs which also made it riskier to buy there. The fact that the market was using trapped bears to push the market higher also calls into question how far the market can continue to go - who is left to buy? Aggressive bears could sell the bar 10 close and target the bar 10 open. More conservative bears would’ve been happy to see the small bear inside bar at 11. In this case, the bulls who entered high were the ones who were trapped too long and bar 12 was a give up bar as bulls sold out and bears piled on to that. Any bulls who were long from lower down would’ve also wanted to get out below bar 11 since the bar 10 low was a magnet which increased the selling pressure. The market wound up testing down to the start of the bar 10 buy climax as well as the bar 7 buy climax. Since retests of the start of a climax is a common behavior, it is unlikely that bulls would be particularly willing to buy on limit orders until that test occurred so the relative lack of buy side liquidity would contribute to the progression of the move down. Aggressive bulls may have bought below the bar 10 low using a wide stop and scaling in lower, but given the fact that the market continued down further to the bar 7 low and below the 20 EMA, most bulls were waiting for even lower prices and some stabilization of activity in order to resume buying. Once those tests did occur the market formed a small micro double bottom before forming another bull leg up, pushing all the way to a new high that was 2x the height of the trading range that formed during the open (it went 1 tick above that MM target).

So there you have it, the market pushed to numerous all time highs very likely using trapped bears as the fuel to get there.

1 Like

Thanks for the detailed post. I’m not familiar with Bob Volman, heading over to Amazon now to check it out.

@Trader Thank you for your lengthy posts. I actually appreciate that you explain your view in such detail, so don’t try to change when you have such strengths.

I also bought Al Brook’s book, and after a while, I just dropped it. I felt there was an attempt to explain every single price action move by the market. I thought this book would take a trader away from developing s simple method. Instead, it would try and fill a beginner’s head with the notion that there is always an explanation for every move (noise in the marketplace).

I purchased it out of curiosity because so many people spoke about it. I got a little FOMO about a new outlook on the markets and their structure.

It is hard to tell whether an author/educator trades in real life or not. There are so many intelligent people in the markets; whether they could take their knowledge to the market and make it in trading is a totally new level of challenge.

I have recently purchased the Book Unknown Market Wizards by Jack D. Schwager.
Incredible book! It has a specific interview format with successful independent individual traders, at the end of every chapter, a summary of how they trade and how they treat risk. Highly recommend.
I think that beginner traders would find it interesting that some traders do not fall into a stereotype of a trader. It is ok because a trader may find a style he may adopt and feel comfortable with. The key is always to find a method that suits your personality.

I recommend the last two books from Farnman Street, The Great Mental Models Part 1 and 2.
These are not trading books; rather, decision-making models that may add a new dimension to how you view the markets. They have a blog that has many o the articles in the book https://fs.blog/.

Our time is our most precious commodity. We can’t always use everything we read, analyze, and are exposed to. But, I always suggest to every trader to be very specific about what they are getting exposed to whether they should invest time learning it. It must match your level of competence, understanding, and comfort. Sadly, in the past, I have invested my time in things I have no strength in, and so I got “smarter” but could not use that knowledge." Now I investigate the information I am about to read, whether I can truly comprehend it, and then use it. If it is not, I move on.

Thank you for everyone’s effort to help one another!

Matt Zimberg
Optimus Futures

1 Like

Thanks @Mod-MattZ, and I appreciate the book recommendations. I just got Schwager’s book on Kindle. I’ve skimmed some of his earlier books and liked them, didn’t know he wrote this one. A couple things right off the bat: 1. John Netto was in the film Life On the Line which was a documentary on sports betting. It’s on Amazon Prime and you’d probably like it since there is overlap between traders, sports bettors, poker players, etc. 2. I just started reading the first interview with Peter Brandt and it’s interesting to note that he tried numerous strategies before finding something that worked for him. My experience was certainly similar in that regard and I believe that’ll be the case for anyone who seriously gets into trading - seems to be a common theme amongst traders who are interviewed. Something else worth noting is that ideas from Edwards and Magee’s was what turned things around for him.

Al Brooks actually cites their book in his trilogy and says that he uses the same ideas but places more emphasis on individual bars. My experience has been that looking at individual bars in relation to one another is very useful since it gives a much better sense of things like momentum, ease of movement, buying vs. selling pressure, gauging potential trade location, and so on. There is definitely a learning curve with the material, but even Brooks has said that he doesn’t do anything particularly unique. Based on my own experiences and studying lots of other traders, I agree that he’s not doing anything that unique, which makes sense since the nature of the market transcends any individual. Volman’s ideas overlap with Brooks’ as do those of other price action traders like Mack from price action trading system, Joe Ross, and Lance Beggs to name a few. I’ve listened to order flow traders who have said and done very similar things despite looking at the market through a different lens. The ideas that I read in the CBOT Market Profile manual overlap with the ways in which Brooks describes the dynamics of a trading range and other ideas as well. The point that I’m making is that even though people may use different words to describe things and different tools to look at the market, they’re all basically doing the same sorts of things. There’ll be individual variances in how traders choose to manage their trades, what sorts of trades they prefer to take, and so on but from an analytical standpoint there tends to be many commonalities. I don’t care much about the source of an idea, I care about whether it has validity in a real market environment. Sound principles stand the test of time and I can tell that we’re both pragmatic in our approach to the market by staying focused on doing what works for each of us.

I totally agree with your view on the value of time. It’s unfortunate that trading isn’t like going to med school or law school or something along those lines where the path is very well established and the training path is exact. That does cause the learning curve for trading to be steep, arduous, and far less straightforward, but in some ways that contributes to the depth of understanding that can be cultivated over time. So the time spent is not necessarily time wasted.

Part of how I approach spending time on various resources comes down to assigning relative levels of importance to them. For example, I recently borrowed a book from the library called Flash Crash by Liam Vaughan which was centered around the 2010 flash crash and Navinder Sarao. I went into that book knowing that my main purpose in reading it was to gain a bit of insight into Sarao’s way of thinking about markets, attitudes towards loss and risk, etc. since he was a incredibly large ES trader. Of course, I wouldn’t want to emulate everything that he did, but it was worth getting a peak into his mind. That was a book that I wound up reading through in a few hours since I was only looking for specific sorts of insights. On the other hand, I’ve taken much more time reading through some other texts from Brooks, Volman, Dalton, etc. and revisiting them relatively often since those ideas play a larger role in my day to day thinking. I try to approach those sorts of resources from more of a syntopical reading standpoint (Mortimer Adler’s book goes into different levels of reading for understanding and practical use - you may have read the summary of his book on Farnam Street already but if not it’s a good read and much faster than reading Adler’s original work). So I’m all for time efficiency, but sometimes it is worth taking a deep dive into some denser texts as well if it’s something that a person feels is relevant to his needs.

I think a key reason that I’ve found Brooks’ ideas to be valuable was because I saw many things in my own experimentation before I learned about them from his, and other traders’, work. If I had gone through his course and/or books from start to finish before trying things on my own I don’t think I would’ve benefitted as much. I believe that to be the case since I was having my direct observations being explained from a more experienced trader rather than learning a bunch of things and accumulating a lot of second-hand knowledge. Before I ever started trading I read a book called The Book of Not Knowing by Peter Ralston which emphasized the importance of direct experience. I’m of the view that Brooks is right in saying that “there is no noise” because I’ve seen over and over again how small details can provide important clues.

Anyway, I’m going to be away for awhile but I’ll be back when I can. Thanks for sharing your perspectives! I’ll check out the Farnam Street books as well. The last book I skimmed on mental models was Poor Charlie’s Almanack a couple years ago and these sound interesting.

1 Like