Originally published at: https://optimusfutures.com/tradeblog/archives/6-chart-patterns-every-trader-know/%20
This article on futures trading chart patterns is the opinion of Optimus Futures.
If you want to succeed as a day trader or swing trader, you must know your chart patterns inside out. Since not all chart patterns have the same success rate, it helps to know the most common chart patterns and how to trade around it –meaning, knowing how to manage a trade or take alternative entries (long or short) if a pattern fails. We can help you with the first part.
Here are ten futures trading chart patterns which can help you understand the balance between buyers and sellers in the market. Let’s go over each pattern and explore what it might reveal about the overall market sentiment.
Charts courtesy of Optimus Flow
Double Tops and Fake Breakouts
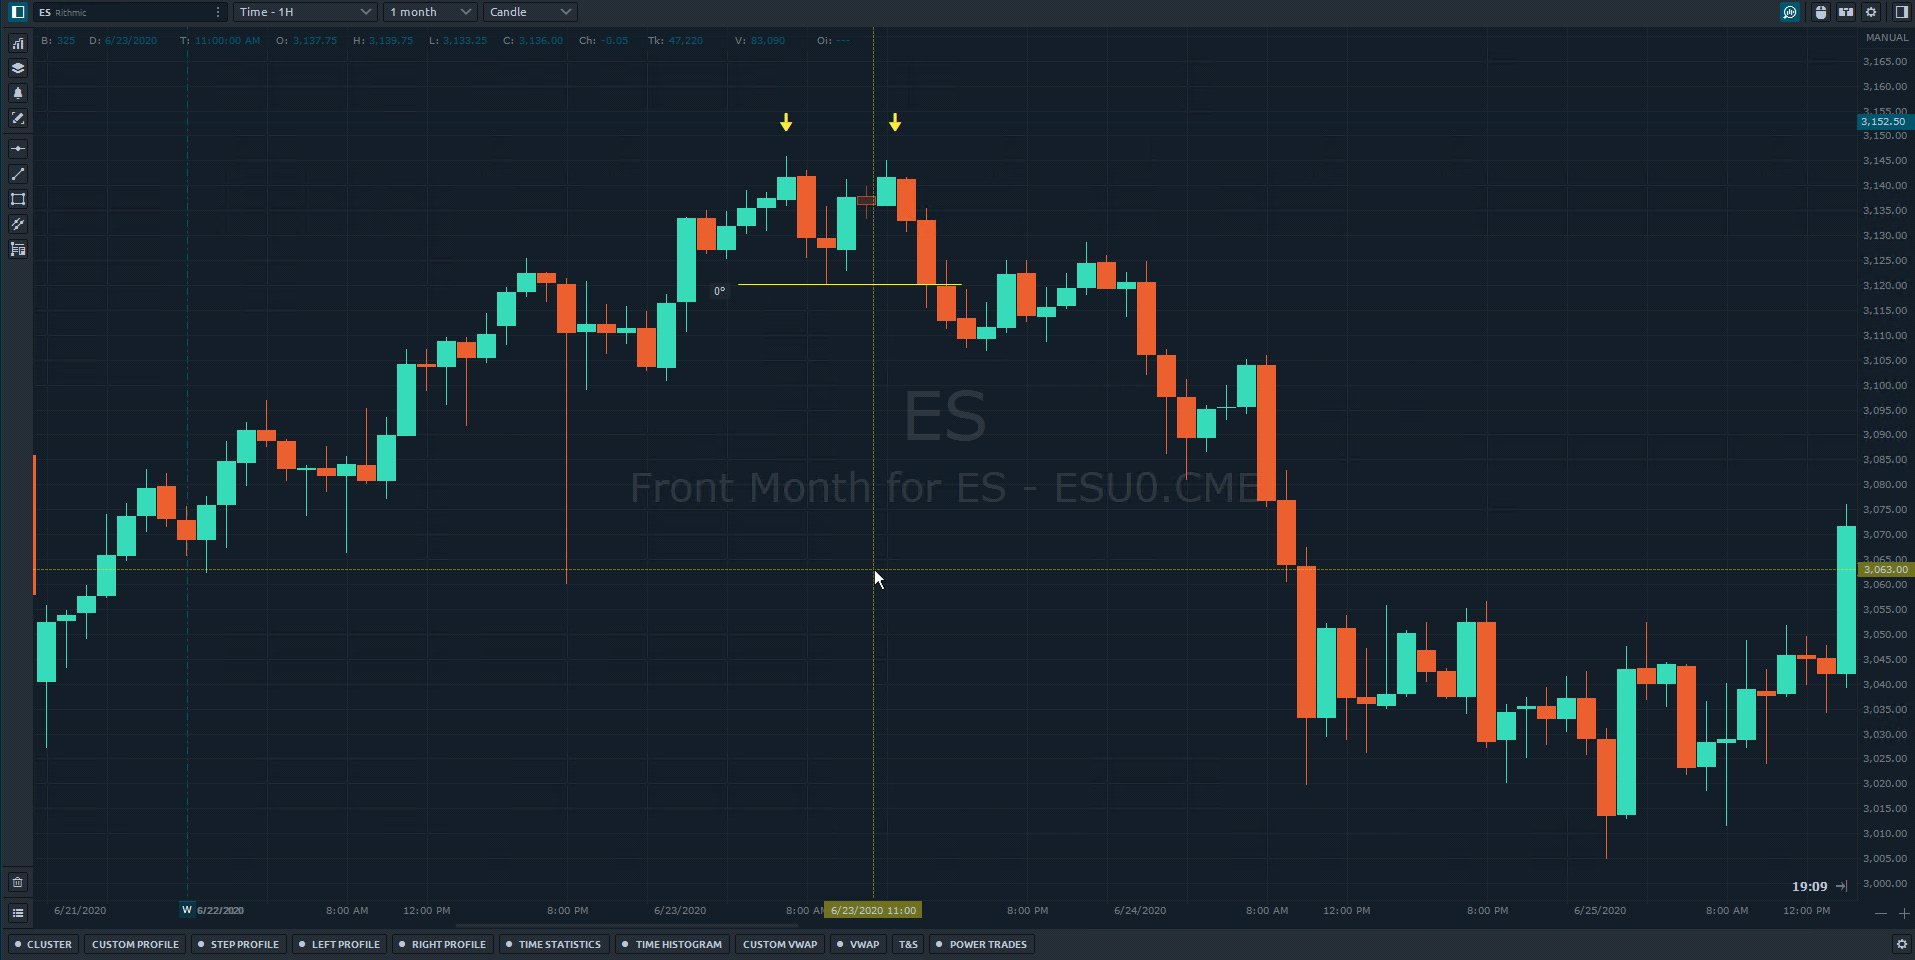
A double top is a bearish pattern that can occur frequently in the markets across different timeframes. The big question with a double top is how deep a market can fall upon failing to break out of the peak.
To potentially increase your chances of success trading this pattern, you might want to wait for confirmation either way. You can always jump on a double top–anticipating its traditional bearish outcome or betting on a breakout toward the upside, but if you do, be sure to place a stop above resistance (if bearish) or support (if hold a contrarian bullish bias).
In the example below, a double top on the hourly chart might have resulted in a nice short-term downtrend. Waiting for price to break the support line and placing a stop above the highest peak could have resulted in a strong trade on the short side.
Disclaimer: The placement of contingent orders by you or broker, or trading advisor, such as a “stop-loss” or “stop-limit” order, will not necessarily limit your losses to the intended amounts, since market conditions may make it impossible to execute such order
V Tops and V Bottoms
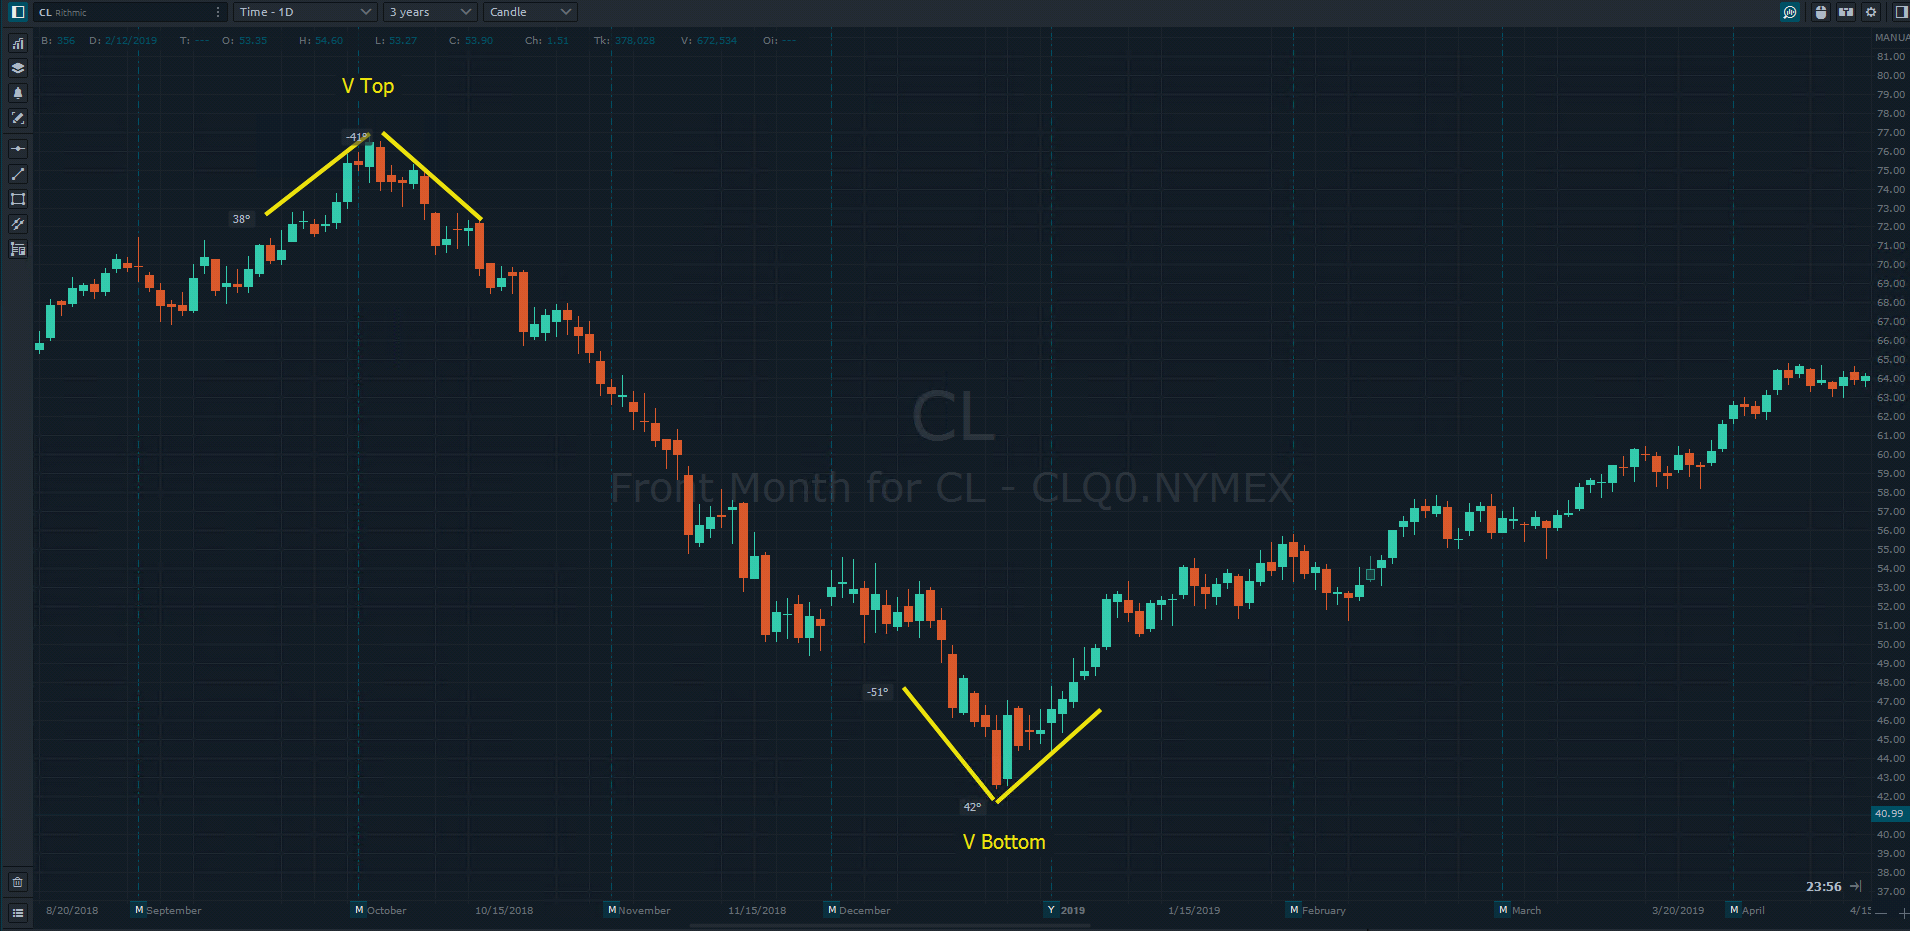
V tops and bottoms are quite straightforward but they’re also very easy to miss. If you are looking to trade the top or bottom of a market, double tops or bottoms are typically easier as they provide more info (failure to make a new high or low) and two chances for entry.
Not so much with V tops and bottoms. In a case like this, it helps to understand the fundamentals behind a market to better assess whether a market is going to break down or recover.
Head and Shoulders
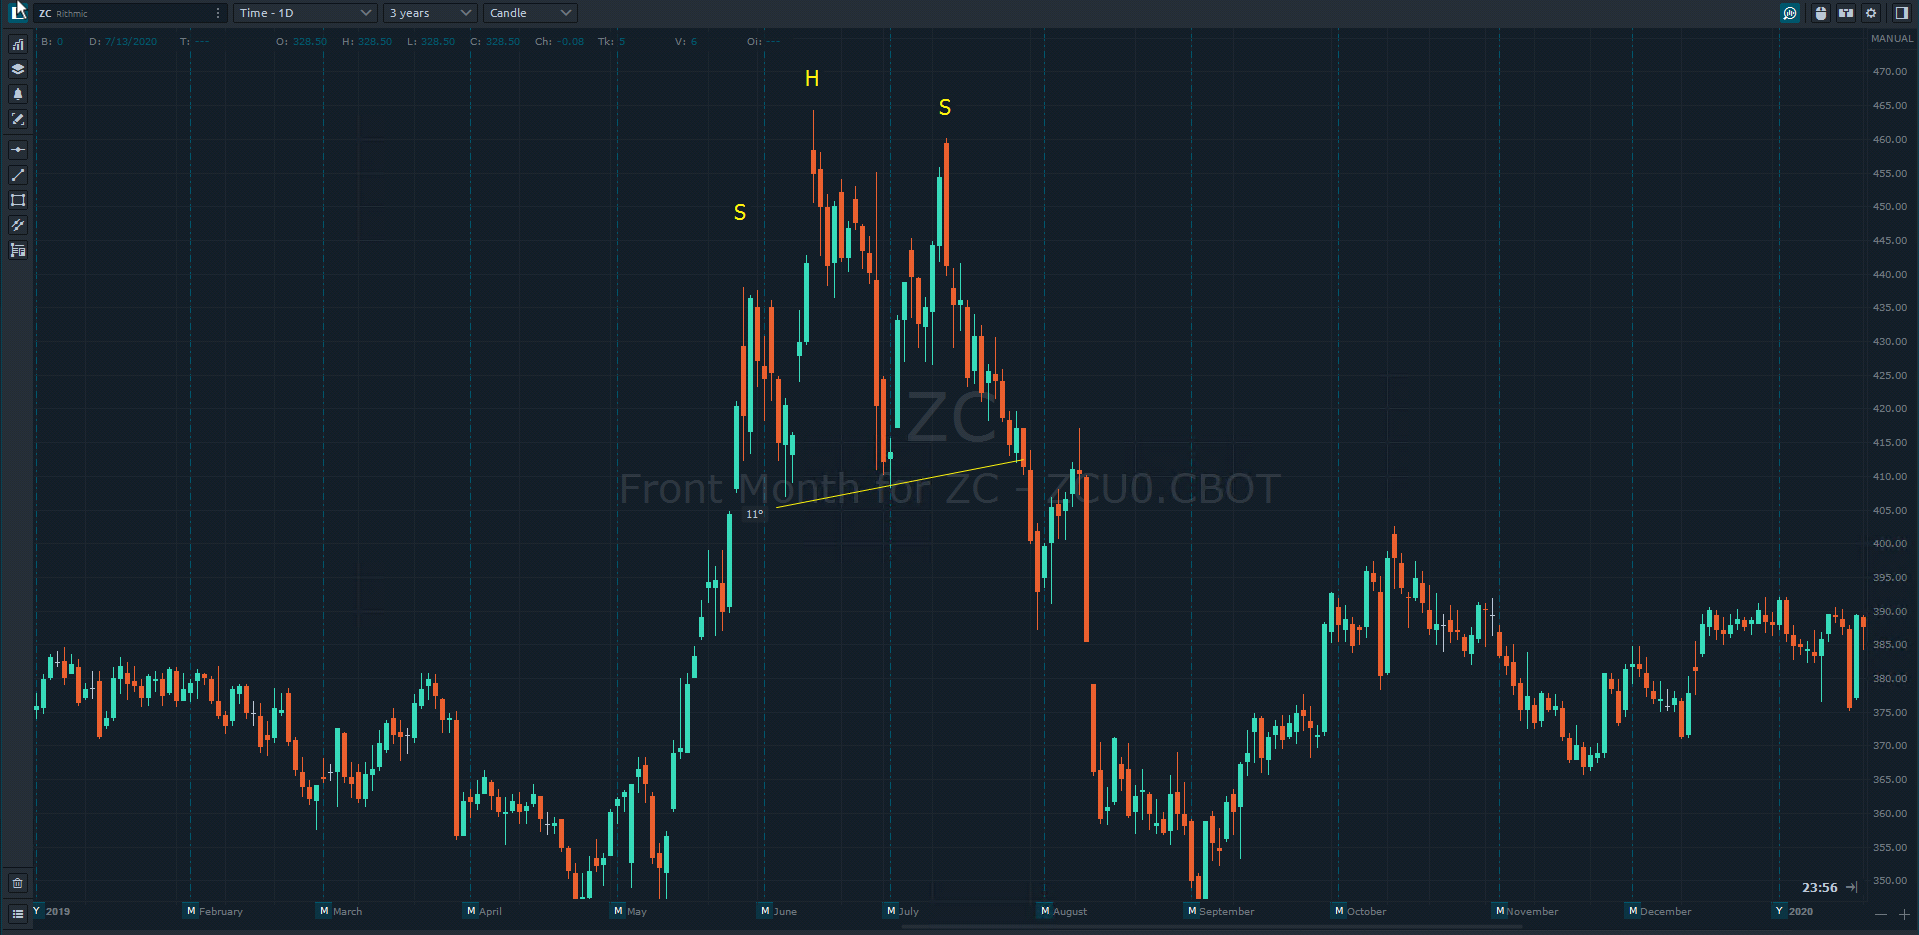
Similar to the double top, the head and shoulders pattern is another popular pattern that traditionally signals a bearish reversal. The pattern tells that three attempts to break toward the upside have failed, the middle attempt (the Head) having the strongest momentum.
The trick in trading this pattern is to wait until the ‘neckline’ has been violated. Often, price will rise to meet the neckline one last time before declining. Below is a very ‘ugly’ head and shoulders pattern in the Corn Futures (ZC) market (from May 22 to July 28, 2019). We included it to show you that patterns are not often ‘clean’ and can often have irregular shapes.
Nevertheless, once price broke below the neckline of the last Shoulder, the pattern performed as traditionally expected.
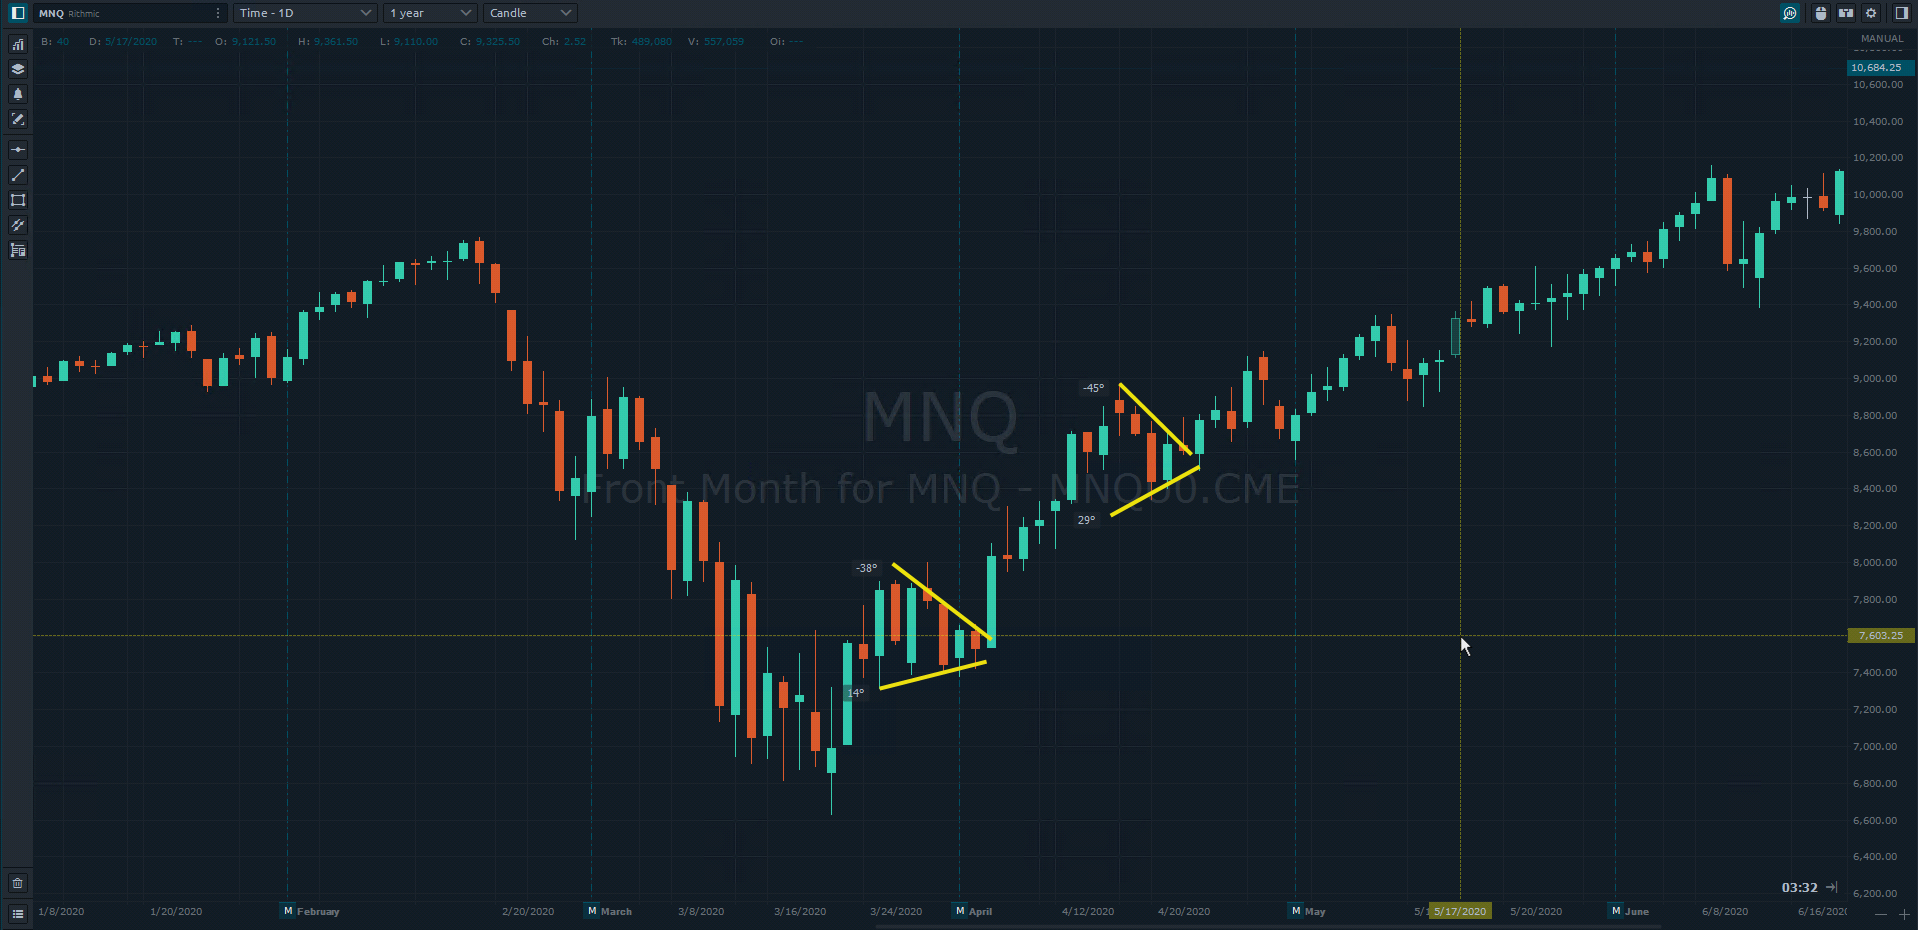
Pennants
Pennants are essentially small symmetrical triangles. They can approach the trend from almost any direction and often occur after long trending periods when price pauses and traders reposition themselves. Most traders make the common mistake of jumping on premature signals. This is called FOMO which we have covered previously.
Instead, wait for the actual confirmation that price is breaking out of such a pattern. Usually, the breakout signal happens with a violent and strong candle indicating that the trend is ready to resume.
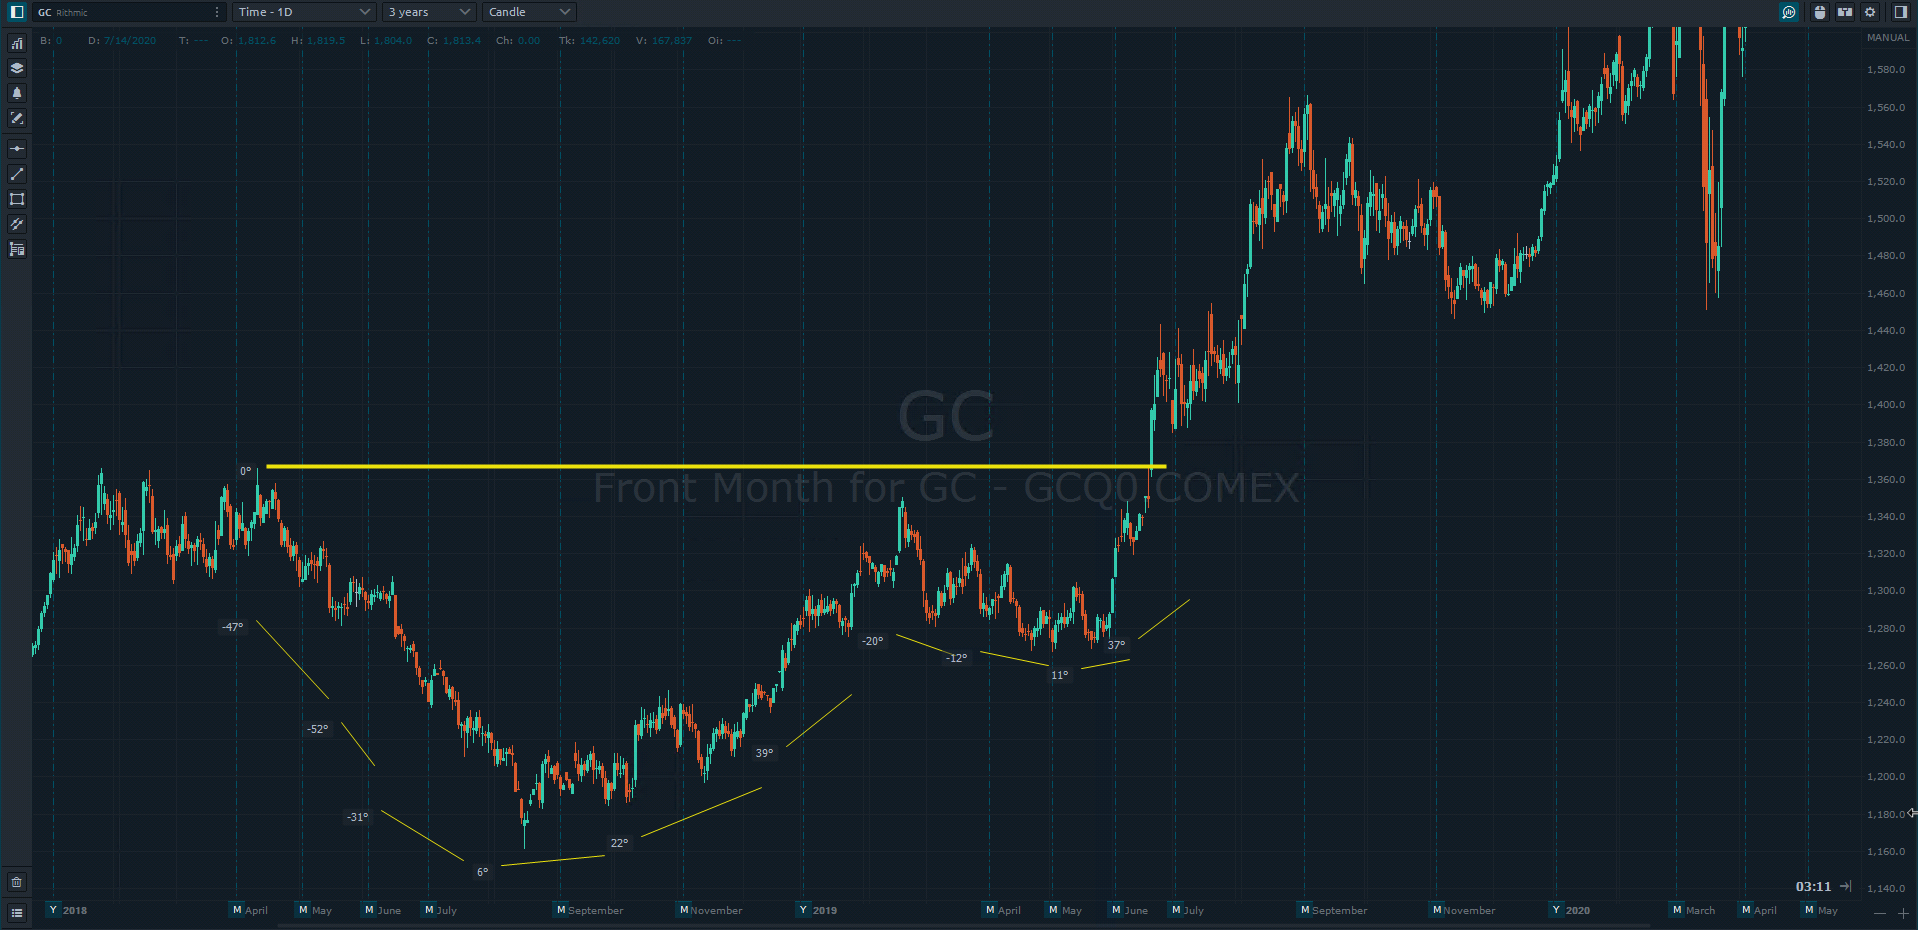
Saucers – Cup and Handle
Saucers or cup and handle patterns are longer-term reversal patterns where a gradual shift in the trend direction is happening. Usually, you can also find a head and shoulders at the bottom/top of such a saucer pattern, but in contrast to the head and shoulders, the transition happens much slower.
The transition from lower lows and lower highs to higher highs and higher lows is obvious in such a pattern and the saucer pattern can often foreshadow a longer lasting trend reversal.
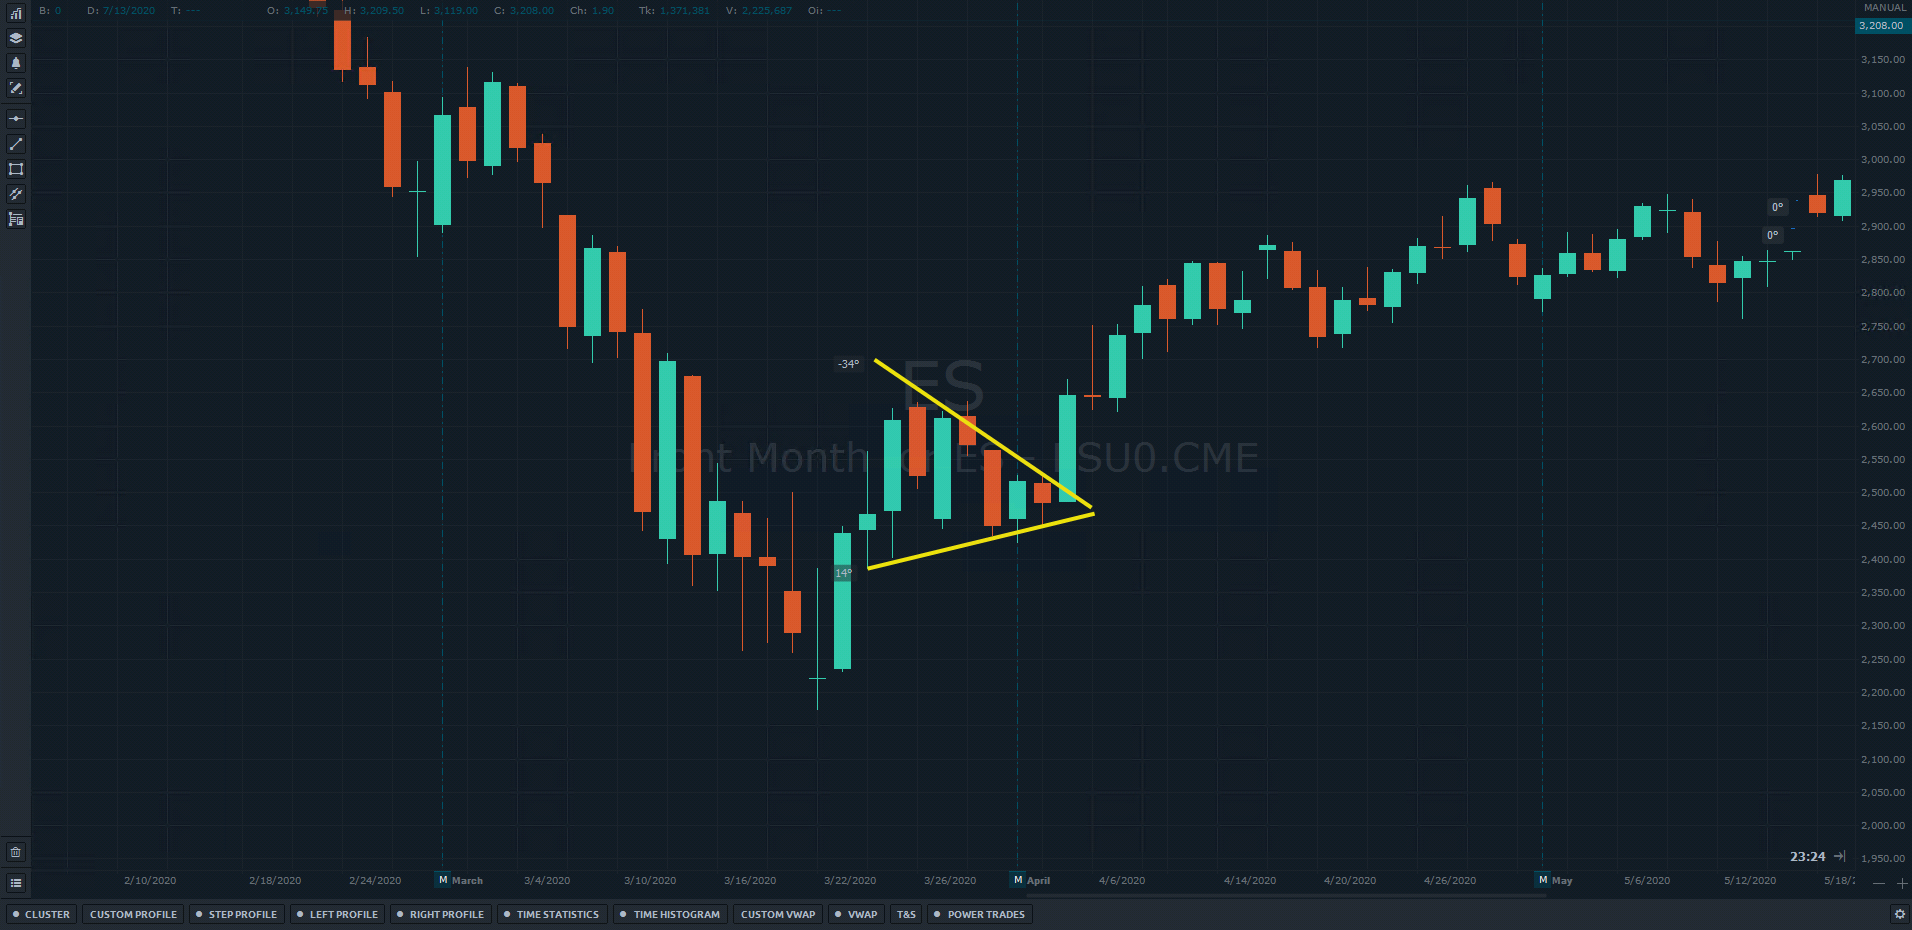
Triangles
Triangles are a form of consolidation or range pattern where markets just drift sideways for an extended period of time. Triangles can come in many different forms and shapes. In contrast to the other patterns, triangles–especially symmetrical ones–are neutral, and they are neither trend continuation nor reversal patterns.
They simply show that the market is in a contracting stage without conviction and directional impulses. The signal on triangles occur once price leaves the pattern. Often, those breakout points come with high momentum candles and moves. The tighter and longer a consolidation in a triangle lasts, the stronger the breakout and the following trends.
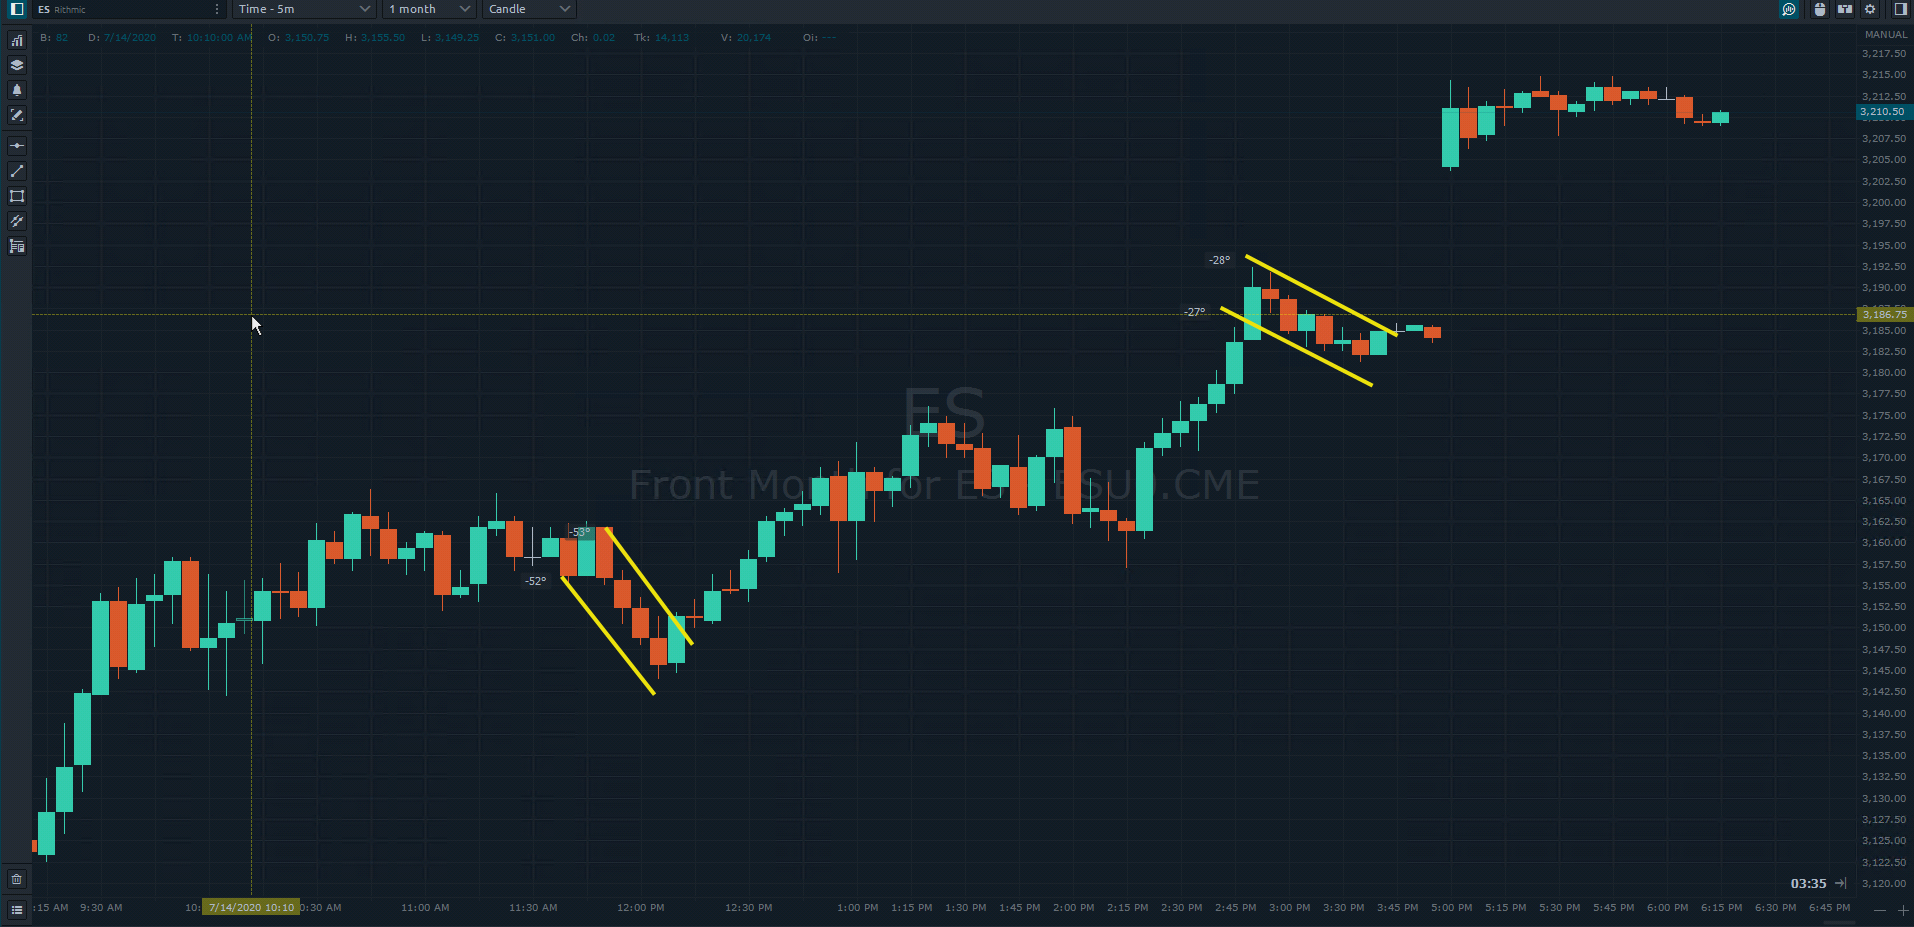
Flags
Flags are a classic trend continuation pattern and they can often be found on the intra-day timeframes. Day traders often rely on flags as tradable events.
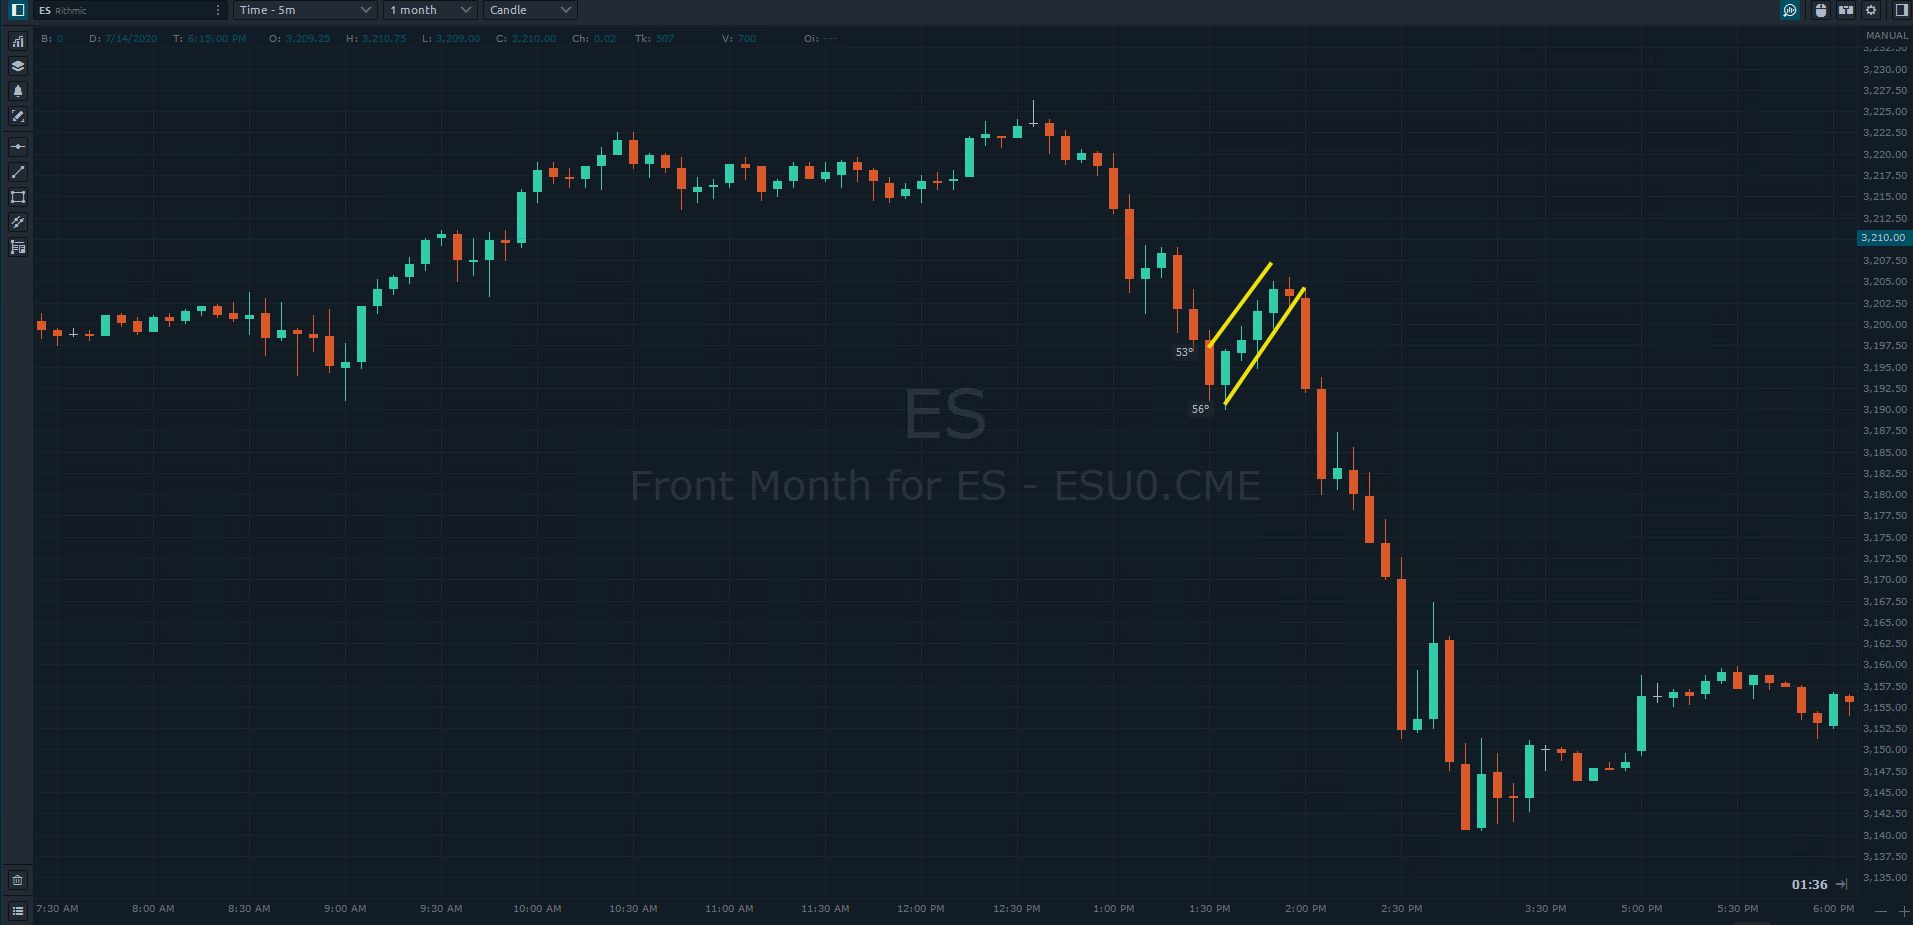
Flags look like small rectangles usually tilted against the main trend and mounted on what appears like a flagpole. The main thing is that flags tend to go against the prevailing trend. So a bearish flag is often tilted upward, while a bullish flag is often tilted downward as illustrated in the chart below.
Bullish flag pattern:
Bearish flag pattern
Ross Hooks (not popular, but frequent and reliable)
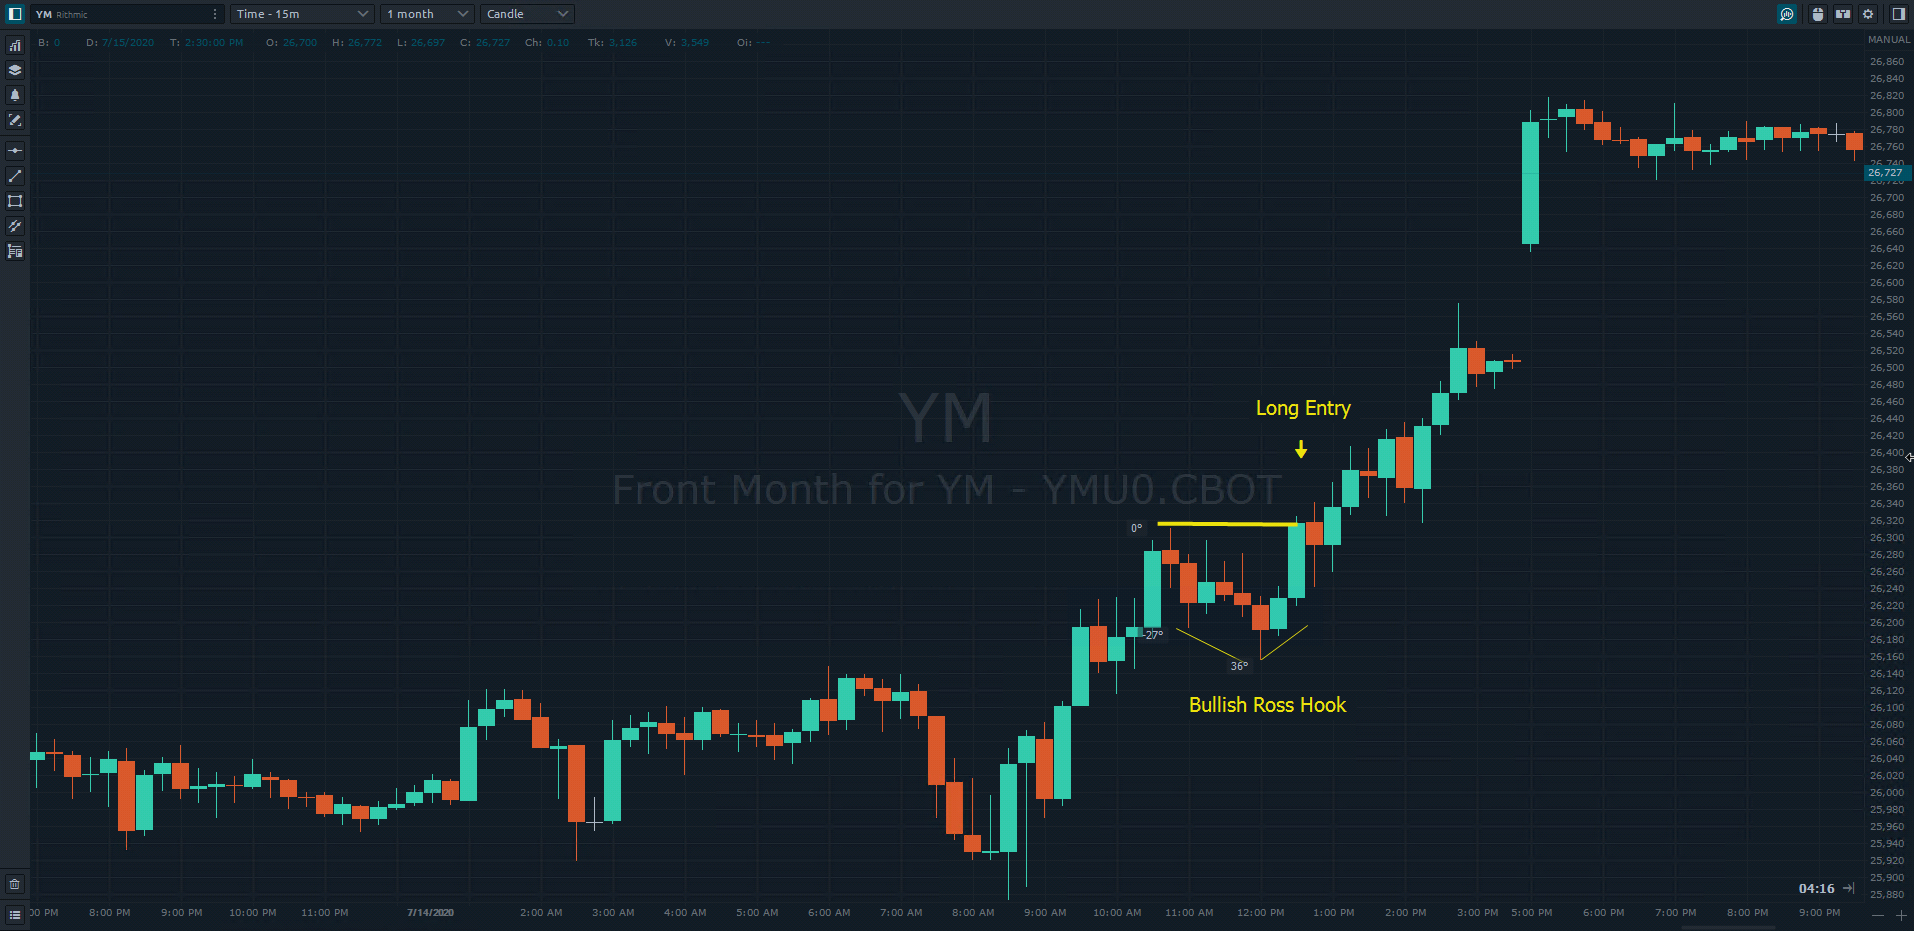
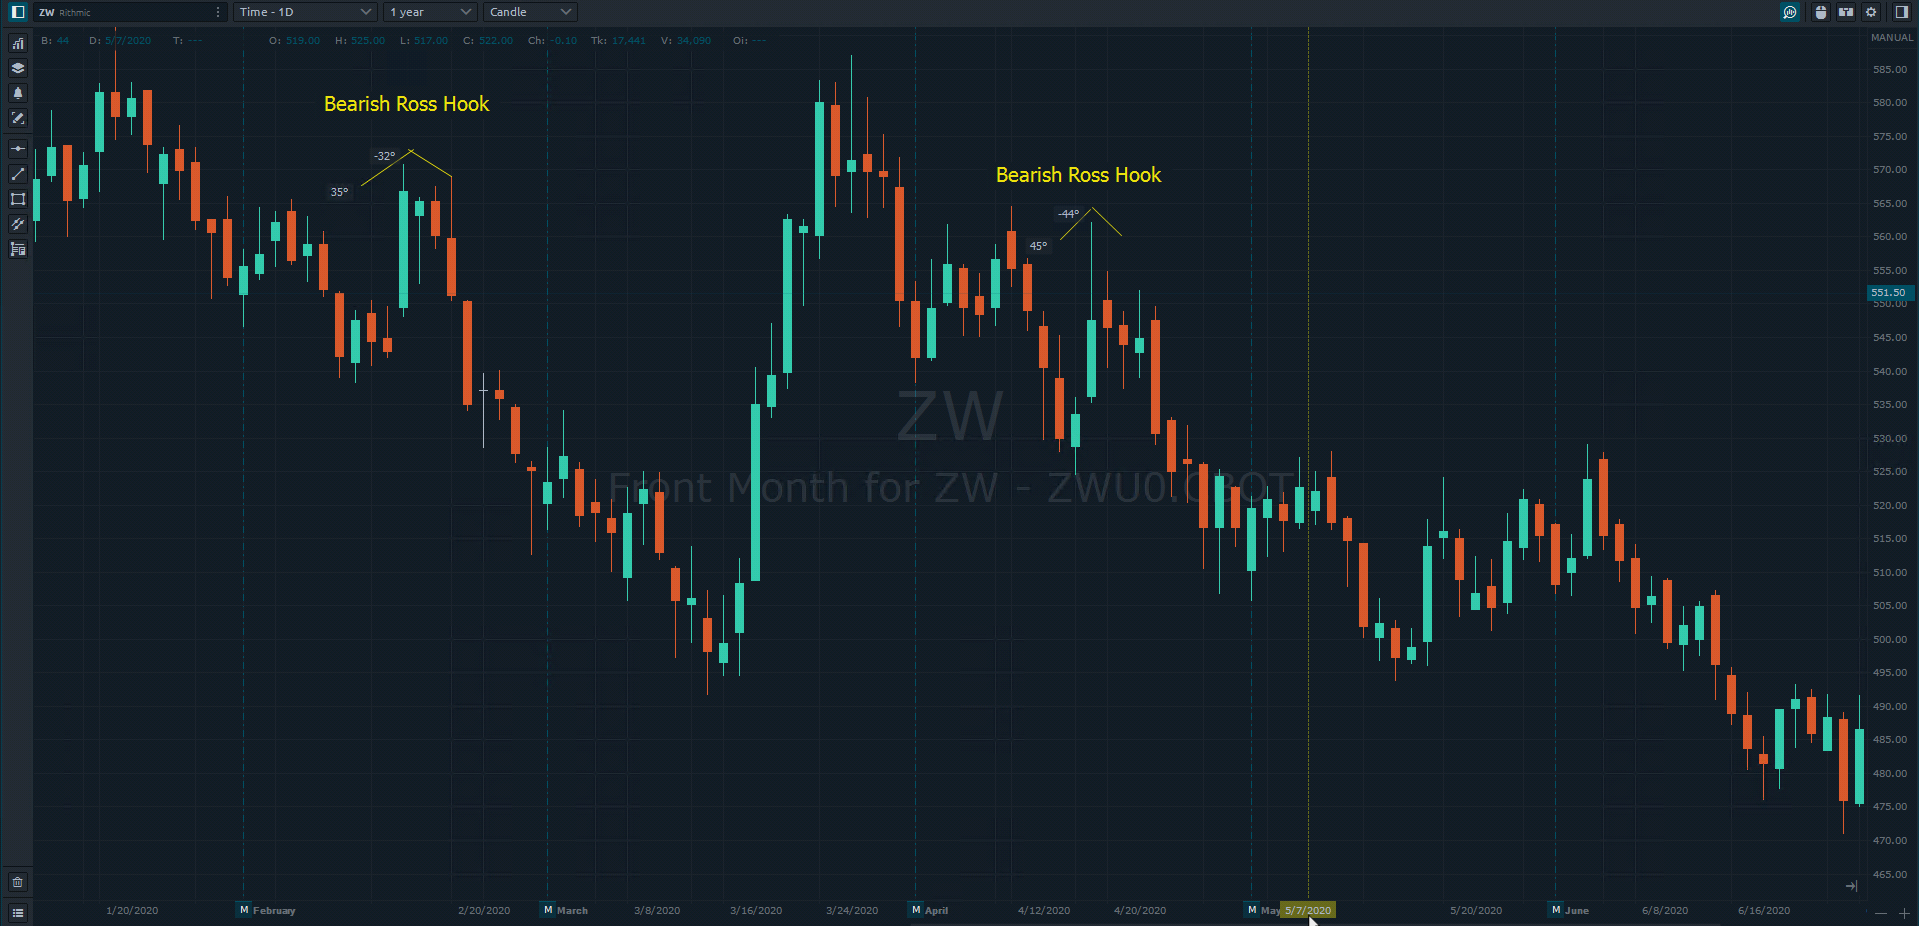
Coined by the famed futures trader, Joe Ross, the ross hook may not be the most well-known chart pattern, but it is one of the most frequent and reliable patterns that day traders and swing traders can use to exploit short-term market opportunities.
Ross hooks are simply pullbacks that occur after having made a breakout (toward the upside or downside) continuing the current trend. Sounds easy? Well, it is, and that’s what makes the pattern both reliable and effective. Better yet, these patterns show up almost everywhere and in every time frame, expanding a trader’s horizon of opportunity.
How do you trade it? Enter upon a breakout of the hook as shown in the illustration below.
Bullish Ross Hook (15-minute chart – day trading example)
Bearish Ross Hooks
Rectangles
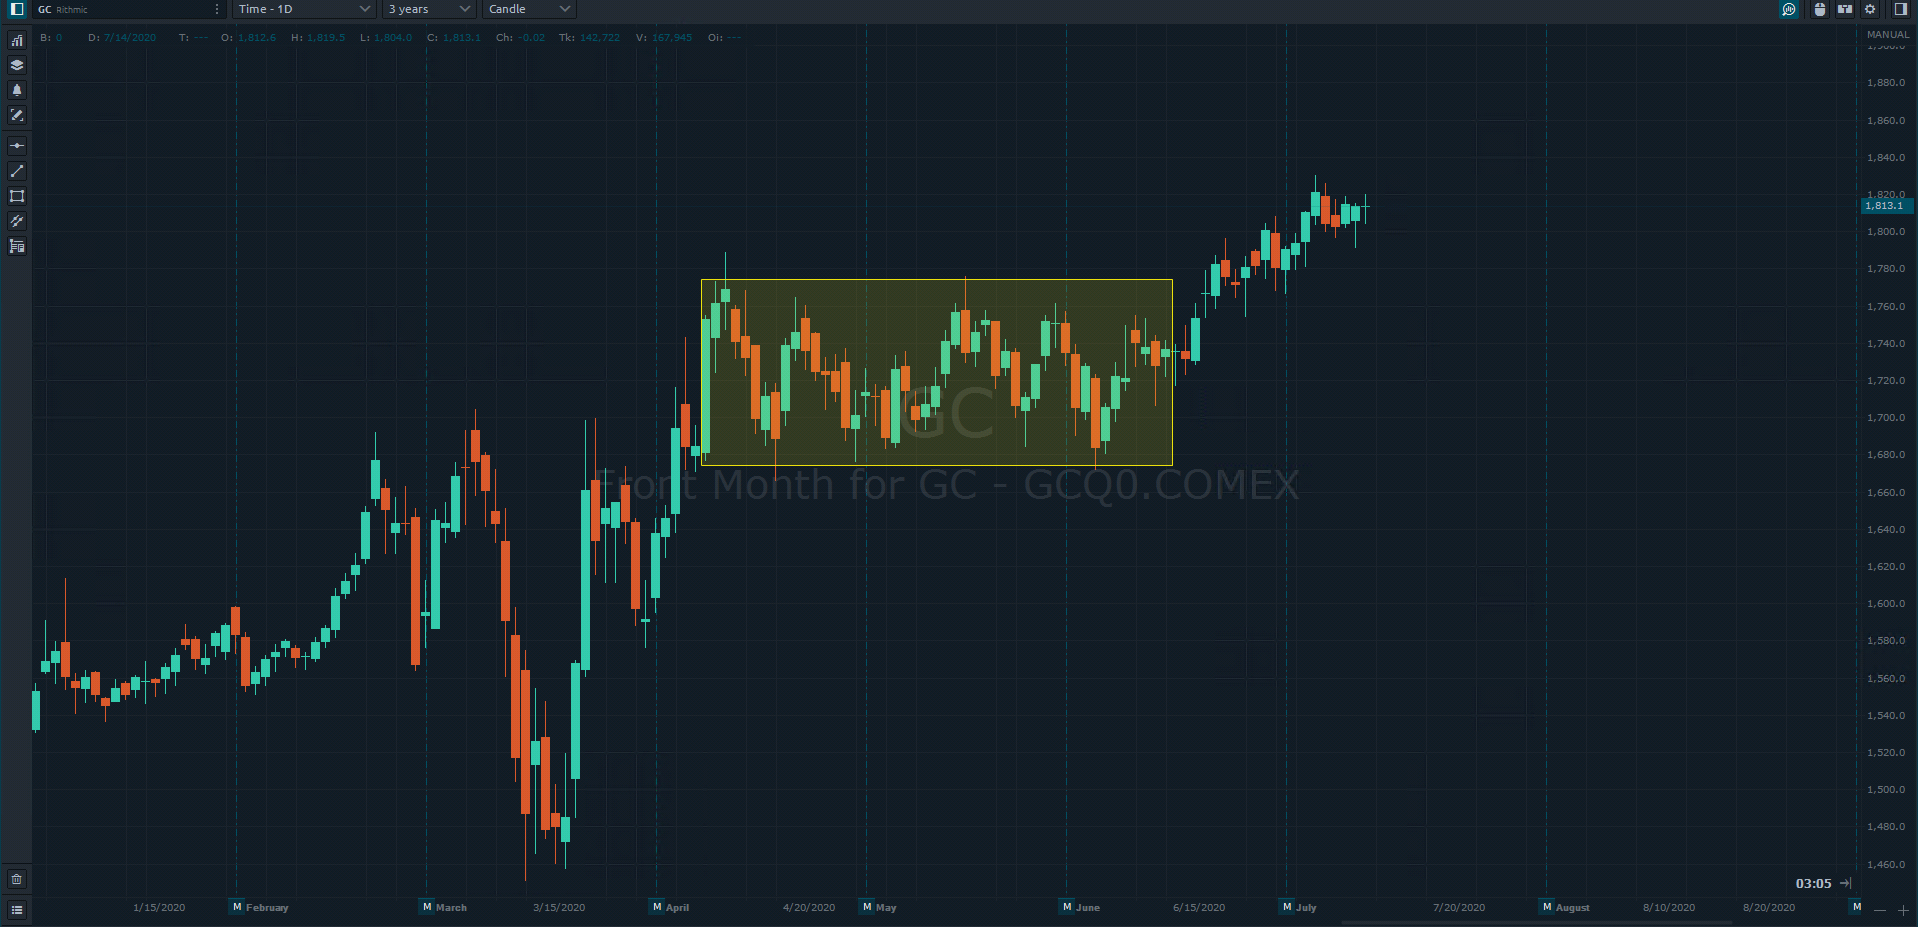
Not all rectangles are perfectly clean, with support and resistance levels lining up perfectly. But in most cases, rectangles are easy to spot. They’re essentially trading ranges from which price will eventually breakout (either direction). Hence, they provide traders the opportunity to play either side of the market.
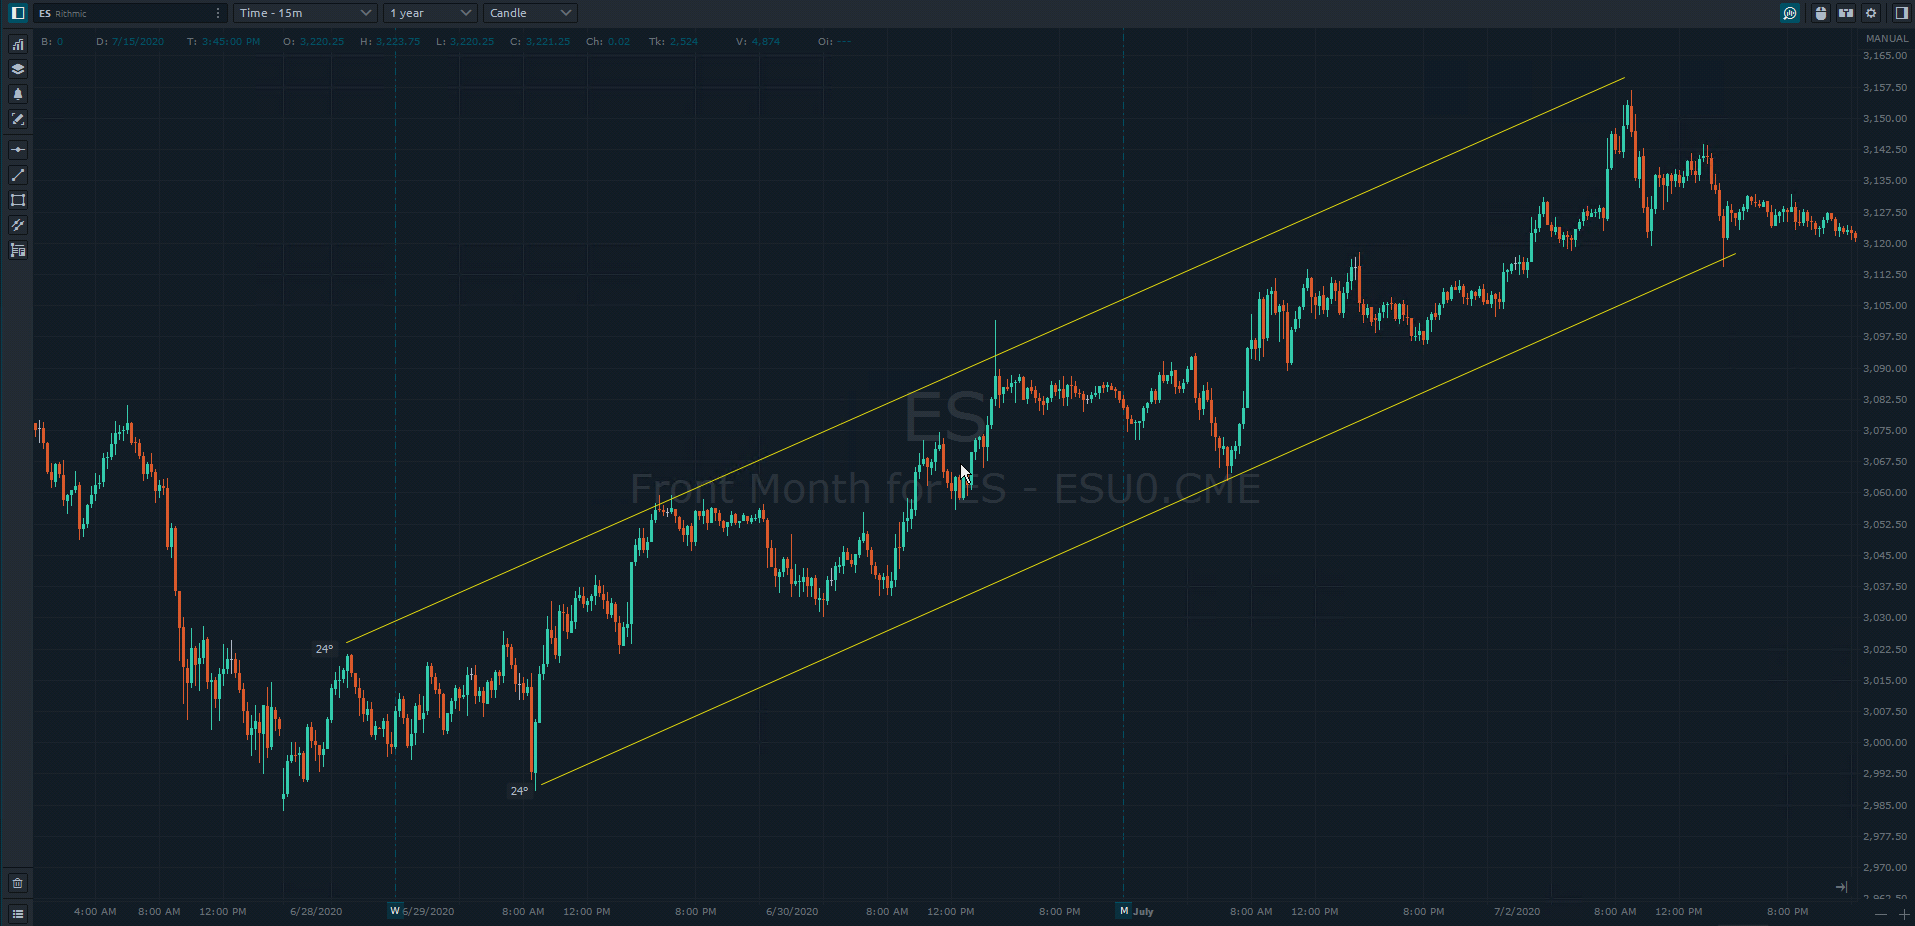
Channels
Channels are striking due to their near symmetrical progression. However, although they’re easy to identify in retrospect, they’re hard to forecast. But if you do identify a market that appears to be channeling, you can use many different approaches to trading a channel–from going long and short to adding successive positions to using it as a measure for entries and exits.
There is a substantial risk of loss in futures trading. Past performance is not indicative of future results.