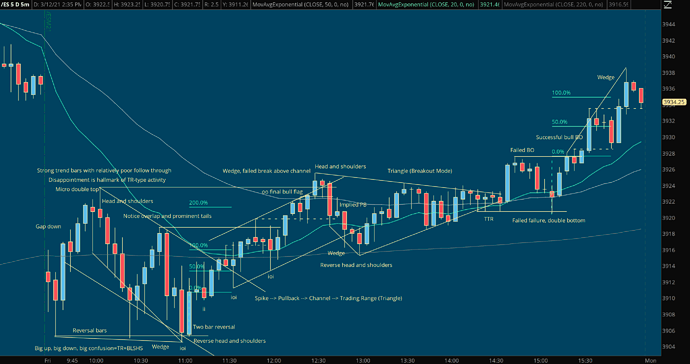
This is an example of an exercise that I do to help reinforce the sorts of things that I look for during the day to understand what’s happening on the chart in front of me. This exercise is done in retrospect on a static chart so the analysis will obviously fit that, however I use the same sorts of methods in real time to help understand what’s going on. I come from a competitive athletic background and view analysis of a static chart (and chart replays) to be akin to watching game footage, real-time SIM trading to be similar to scrimmaging, and live trading to be actual competition.
I don’t note down everything I see since things wind up getting way too cluttered, but I aim to point out important recurrent behaviors so that I continually reinforce the habit of looking for these sorts of features in the live market. You may notice that I noted numerous formations that repeat themselves on this chart. I also use lots of acronyms to help reduce the clutter. A lot of the terminology I use comes from Al Brooks. I generally start by drawing in lines that immediately jump out at me and then look to get more detailed. I also have a 20, 50, and 220 EMA on the chart that are used as reference lines. During the session I just draw in lines (channels, trend lines, horizontal S/R, measured moves, etc.) and typically talk to myself since it takes more time to type things out. I aim to understand things from both the bullish and bearish perspective of the activity. Better understanding leads to better trading.
I wasn’t at my trading desk (I use Sierra Chart on that computer) so this was done in ThinkorSwim with a 5 minute chart on my laptop rather than the usual constant volume bar (CVB) charts I normally use, however the process is the same and I felt like posting an example. I find CVB charts to be a bit easier to read and trade price action, but the principles are the same whether I’m looking at a minute-based, tick-based, or CVB chart. I don’t use range, renko, point and figure, or other similar charts since I like seeing the formation of the individual bars in relation to one another and that can’t really be done with those chart types. I view each bar as a consensus of activity over the designated periodicity and find it very effective to study and trade charts by analyzing bar by bar.
