Hello Optimus Futures Customers and users of the Bookmap trading platform,
We’d like to bring to your attention a soon to be released feature, Delta Volume Dots. This feature displays the true delta of the volume, Buys minus Sells. This is an excellent new feature and offers even more transparency into your volume studies.
This feature is currently in the pre-release version and is expected to reach the full version in the upcoming weeks. Feel free to refer to the text below for insight as to how this feature works, how it can be configured, and where to download it!
Thanks,
Optimus Futures Support ![]()
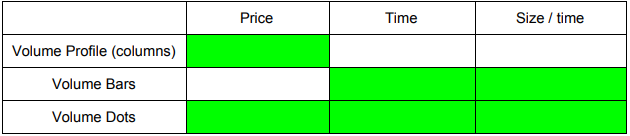
Short background about Volume dots
Bookmap displays transacted volume using the volume dots. Each dot represents the aggregate
volume that has been executed in time, price & size. Volume bars and Volume profile are
aggregated projection of Volume dots onto price axis and time axis accordingly.
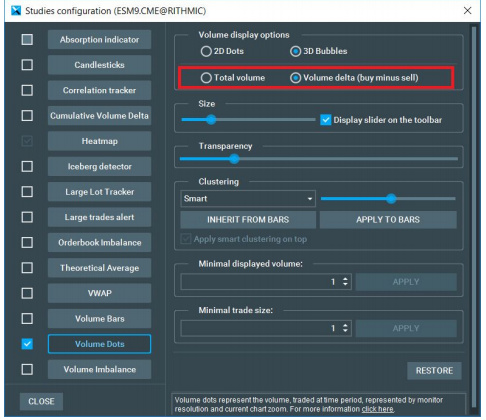
What is Volume delta?
Is the volume dots (or volume bubbles) set to show the delta between aggressive buyers and
aggressive sellers (buy minus sell)
Configuration is done as part of volume dots settings
The value of volume delta
The volume traded contain valuable information and many traders are using different charts and
different tools such as footprint to analyze the movement on a short, intermediate or long-term
basis. One of the problems of current volume analysis tools is that they are hard to analyze in
real time as you have to wait for the bar to build.
The new volume delta feature shows clearly the relationship between the aggressors side and
the price movement, in addition, it lets traders easily compare between current traded volume
and past traded volume. This together with the good visualization of the liquidity provided by
Bookmap, traders get a complete picture of both market status and its recent dynamics.
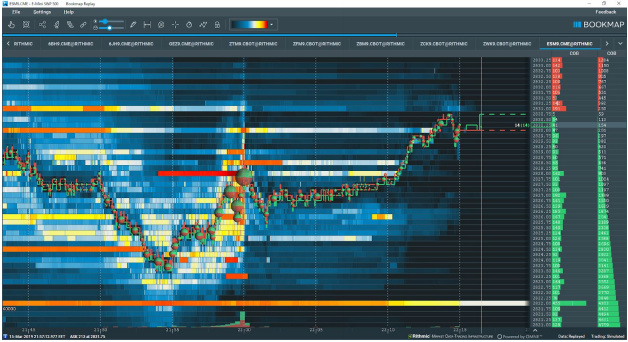
To see the difference, take a look at the following charts:
Example with regular volume dots
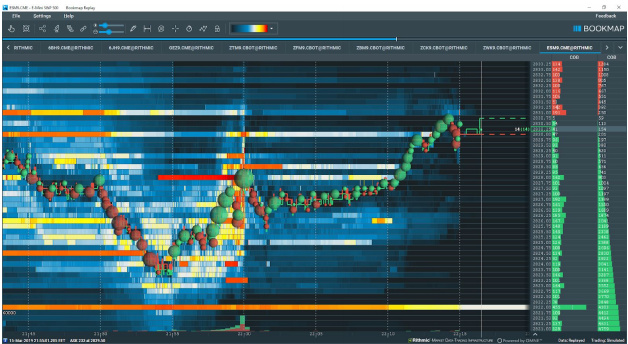
Same image with volume delta selected
Pricing
Provided for free as part of all Bookmap packages (also included in the free version)
Q&A
1. Where can I get it?
a. You have to install the latest Bookmap Version 7.1.1 (alpha version).
Please note when the beta version is announced to the general public, you’ll
need to log into bookmap.com and download it from there, no automatic updates
occur with the alpha version.
2. Can I create a filter to see only delta above xxx?
a. Yes. it works with filter and also in combination with all other modes (e.g.
clustering)
3. If I set the minimum traded volume to 20. Will it show min volume of 20 or min delta of
20?
a. Min delta of 20
4. How do I still see the total volume traded
a. Via the volume bars (at the bottom of the chart) or via the columns (CVP / SVP)
5. Can I set the volume bars to show the volume delta?
a. Yes, same settings as the volume dots could be applied to the volume bars
6. When I set min traded volume and I zoom in, why does the dots disappear?
a. Same as in regular mode (total volume), the volume dot represent an
aggregation of volume traded over certain time period. When you zoom in, the
total aggregated volume is smaller (e.g. if you’ll zoom to microsecond you’ll see
much smaller volume), therefore it becomes below the filter you’ve set.
