Anyone else noticed this? I can see the wicks plotted real time, but when backtesting, some of these wicks will not show. Most of them don’t repaint, specially those that are in major pivot points / reversal levels, but the ones after those, sometimes in the middle of a huge move, usually disappear on historical charts.
Hello @FuturesNoob1981,
We appreciate your patience with this response and thanks for your question.
What time frame are your Renko charts configured with?
Many users configure Renko charts with tick charts and most data feeds have very little historical tick or volume data available. I suspect this may be related to a lack of historical data, but without more information about your chart settings, it’s hard to say.
Feel free to follow up with a screenshot of your market replay settings and the chart timeframe/settings you have configured - it may shed more light into why your renko wicks missing.
Best,
Optimus Futures Support
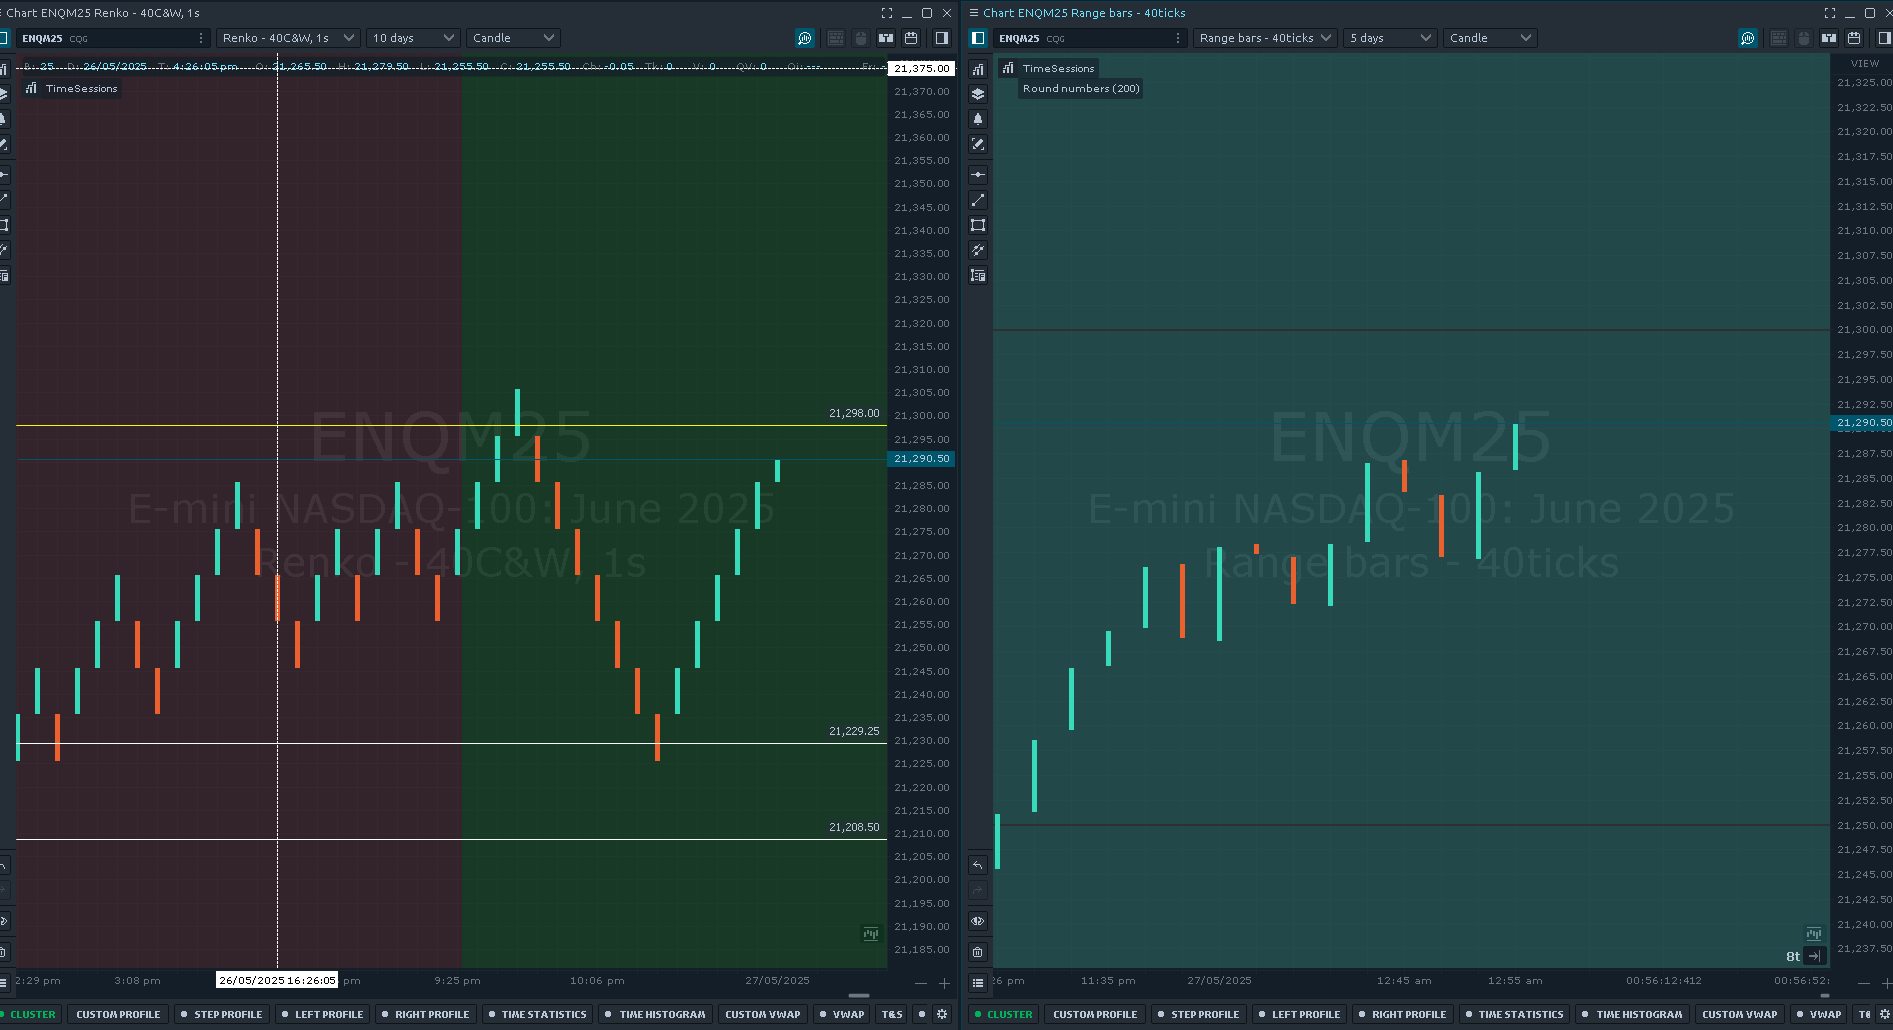
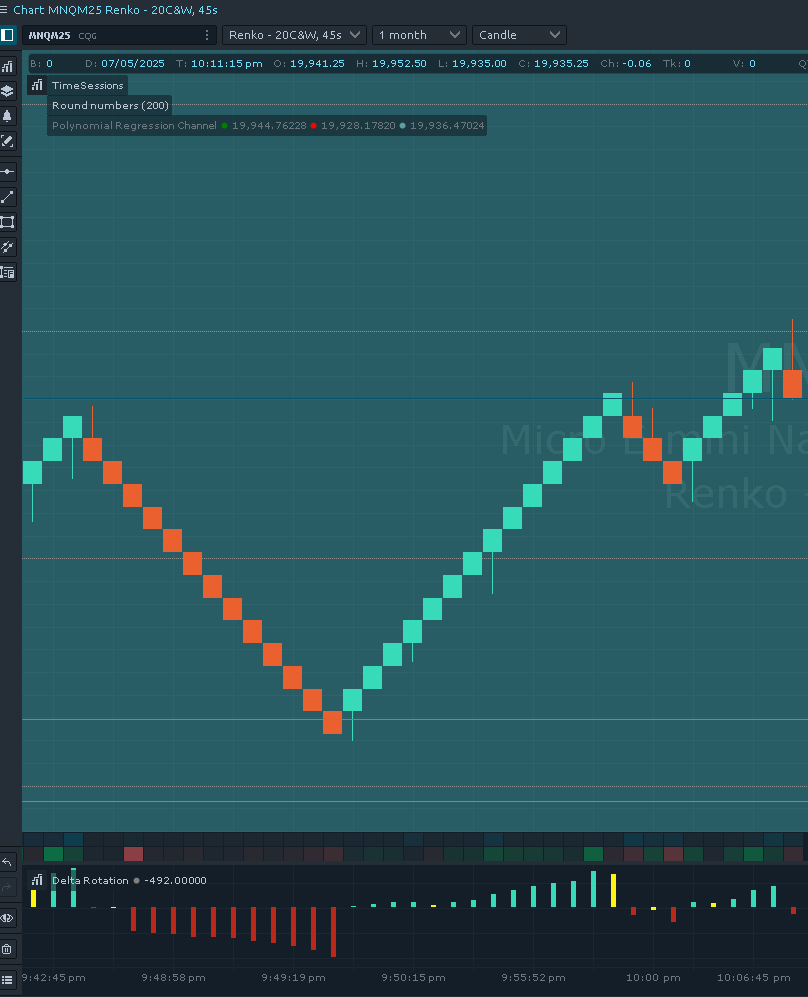
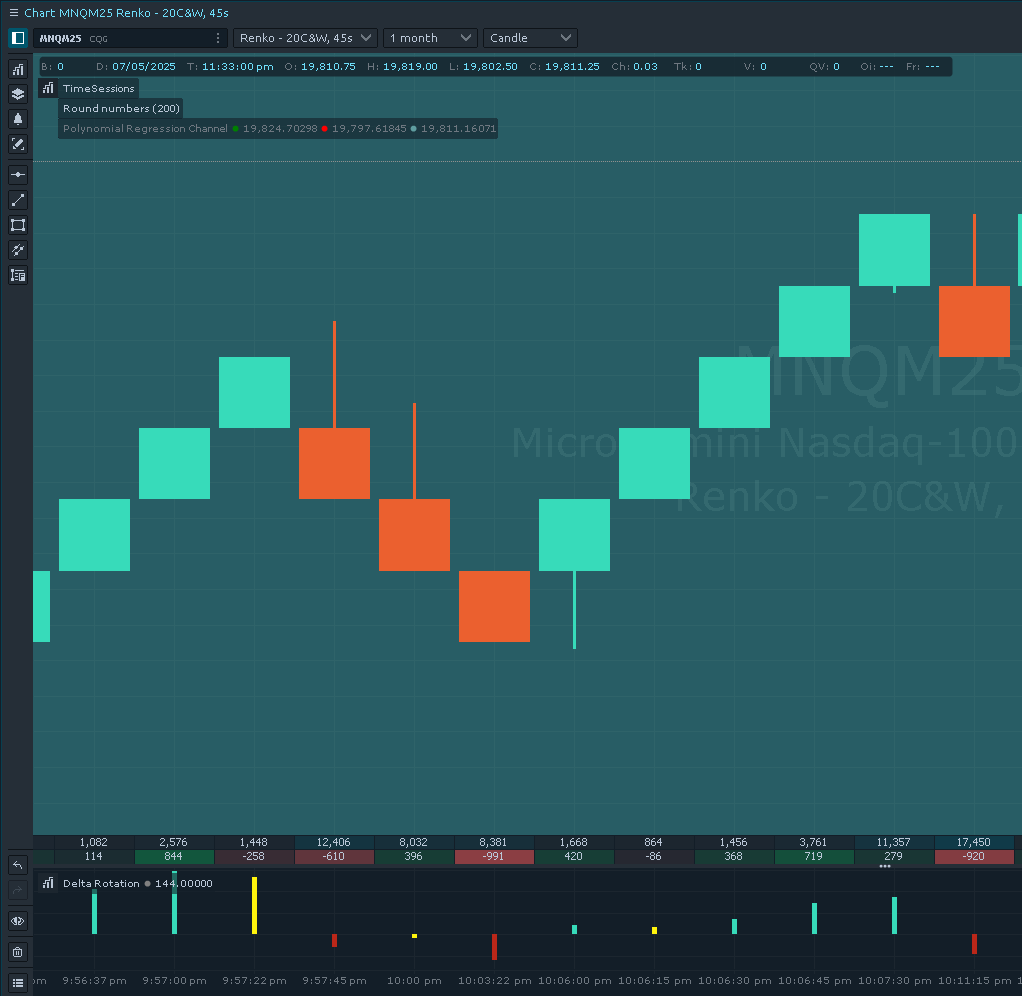
I use 20 tick renkos with a 45s counter. Here are the screencaps. They are around an hour apart. If you focus on the 10:06:45 area, the first screencap shows the final two bullish candles having really long wicks before a minor bearish retracement. The second one, at exactly the same time, the same candles lost their wicks (well the second one had retained a really small one) before the retracement.
Just a side note, if it were a data feed issue with historical tick or volume data, then all or no wicks should or shouldn’t be showing or repainting, if that makes sense. The mere fact that some are retained, and some disappear looks more like an interface issue rather than a data feed problem. Hoping to hear from you guys soon!
Hi @FuturesNoob1981,
Thanks for following up about this.
And just to confirm, you have already tried both right clicking your chart > Reload history (server) and refresh?
Typically the reload history and refresh functionality will wipe out any locally cached data and re-populate it from CQG’s servers.
Also - have you tried this using any other time frames or a smaller amount of historical data (try a week max)? CQG is fairly limited on historical tick data, as far as I know, they are only limited to a few weeks of tick data.
I hope this helps,
Optimus futures Support
Hey Jake, yeah that’s my default TS - reload history and refresh. Now, it’s the Footprint charts having issues. They don’t seem to show even if I change the historical data to just a few days. I’ve just recently upgraded to 1.142.9 btw, not sure if it might be connected.
I’ve tried switching from imbalance to single, double and then to back to imbalance. Nothing shows. Tried restarting Opt Flow, the machine and all other common TS.