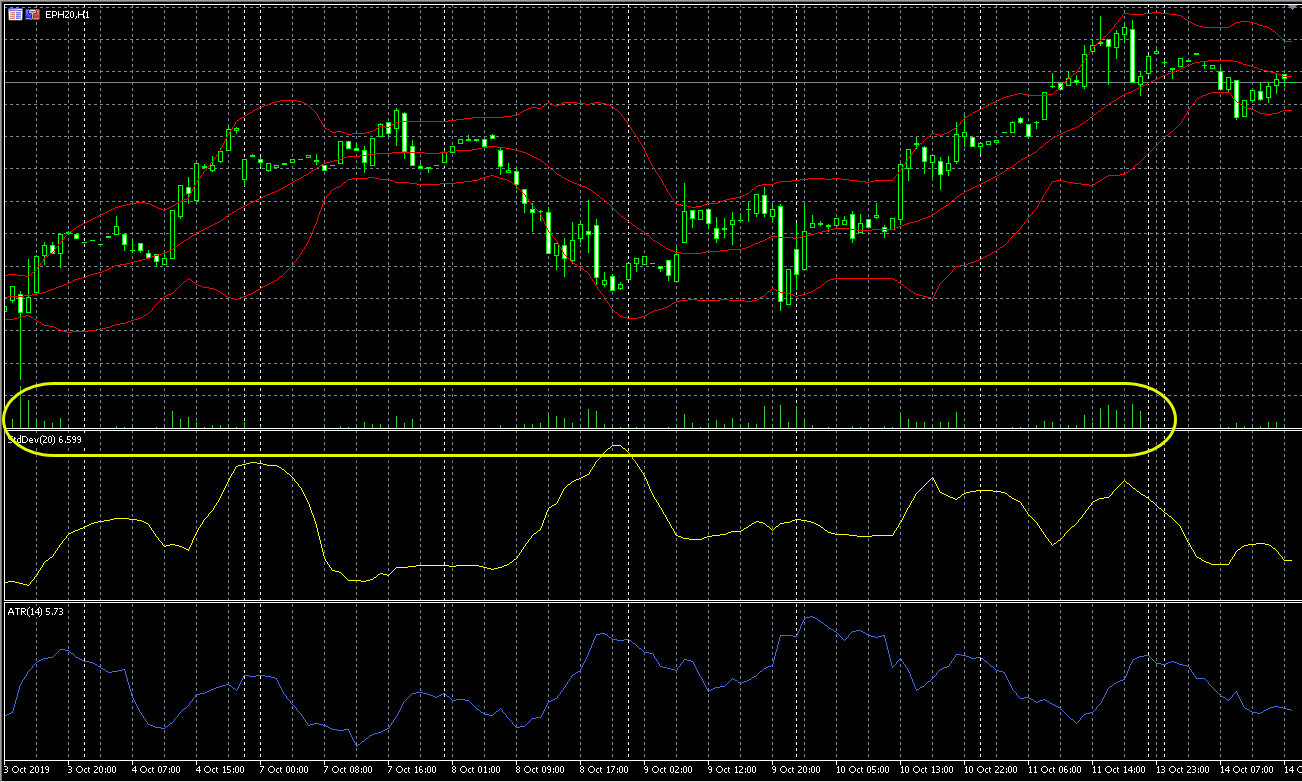
I was looking through the platform and can only find the option to display tick volumes, but I want to configure my entire chart in ticks. You can see what I mean in this image (highlighted in yellow)
By default, there only seems to be two ways of configuring tick-related data on MT5
1. The method you demonstrated which displays tick volume on a chart as an “indicator”. This can be configured by right clicking on a chart and then selecting tick volume within the context menu.
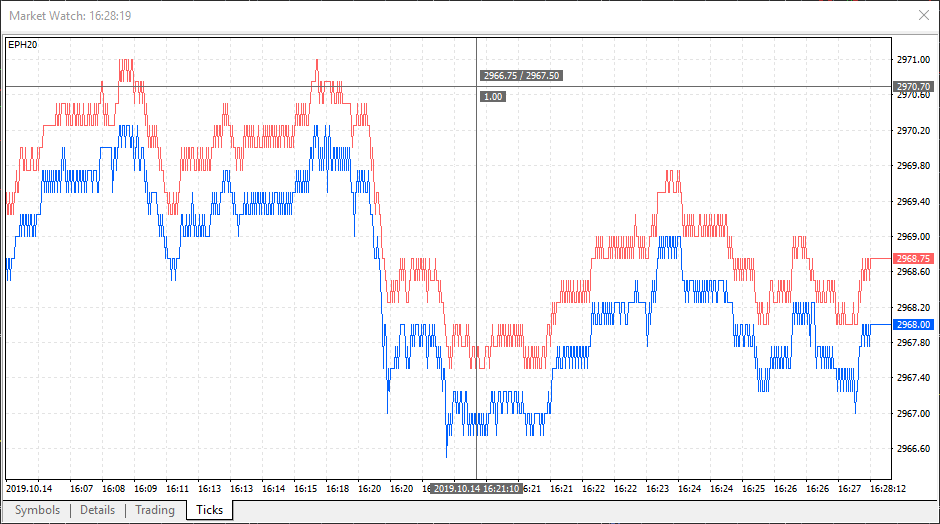
2. Within the Market Watch board, you will notice that there is a Ticks tab. This actually allows you to configure a tick chart. Unfortunately, this tick chart is a bit limited. It only displays a limited number of ticks, it is small, and you cannot scroll within the chart to different time frames. It is possible to resize this tick chart, but it is virtually uncustomizable. See below for an example:
If you don’t already have a market watch open, you can display this by navigating to View > Market Watch or by using the keyboard shortcut: Ctrl + M. The market watch is also used to monitor symbols (similar to a watchlist), contract details, and for trading buttons.
3. Users also have the option of downloading third-party indicators through the MQl5 coding base/Indicator market that allow users to configure their charts into “traditional tick based charts” as we have seen in many other platforms.
We decided not to include this on our list of platforms that support tick charts because third-party indicators aren’t “native” to the platform and the other options are fairly limited in scope.
Thanks for your question and we hope you find this helpful! Let us know if you have any further questions!
Jake
Optimus Futures Support
You can use time charts when you trade and use either seconds, minutes, hours, or days. Tick Charts are based on a number of transactions that occurred either up or down.
Let me use a specific example: You can create a 450 tick chart. This means that every time there are 450 transactions. You can allow a small number of transactions and crate a 5 tick chart if necessary.
Some Futures traders prefer tick charts because there has to be an actual transaction. In contrast, time charts, that may give an illusion of activity when the markets are very slow. Tick charts give a trader the “pulse” of the market.
The quality of the data you receive will have an impact on the tick charts that are built on your graph. Often you will see trader talk about “unfiltered” data versus “aggregated” where one data is showing all the transaction versus some data providers that make an average tick from several transactions.
Matt Z
Optimus Futures
There is a substantial risk of loss in futures trading. Past performance is not indicative of future results.
You can try the tick charts and volume bar charts for MT5 from az-invest.eu. These are a commercial product, but you do have a free trial to see if tick charts suit you on MT5. I’m also sure you will find free versions on MQL5 codebase.