Does TradingView Offer Tick Charts?

Hello,

I came across your tick chart article in my email from your support team. This was a very helpful article thank you for the insight.

I was thinking about implementing tick charts into my strategy and I use TradingView to trade with. However I do not see TradingView listed on the list of platforms that support tick charts at the end of the article.

I could swear I saw that Tradingview had tick charts. Do you know how to set up tick charts on Tradingview? That would be very helpful. Please let me know how to do it.

THanks!

1 Like

Hello @TVTrader,

Thanks for your question!

The reason why we did not include TradingView on the list of platforms that supports tick charts is due to the fact that tick charts cannot be accessed without the use of custom code, scripts or indicators.

There are several third-party indicators that have been created by the TradingView community that allows traders to implement tick size, point value, and cumalative tick data, but nothing in the traditional sense as you may find in the platforms we mention in our article.

After looking through various forums, it does look like the TradingView team claimed that tick charts would be implemented into the platform sometime in 2019, but at the time our article was published, tick charts still have not been integrated into the platform. As soon as this feature is added, we will update this post letting our users know that Tick Charts are now supported on TradingView.

Thanks for your question,
Jake
Optimus Futures Support :optimus_logo_no_backroug:

1 Like

I was searching for tick charts for Tradingview, and I came across this forum.
My question is whether I can use your own platform Optimus Flow with tick charts along with TradingView?

Hi @YiejiTrader

Optimus Flow offers tick charts, which can be accessed through a username and password that links Tradingview and Optimus Flow. By doing so, you can view your account on both platforms seamlessly. You can refer to the tick charts on our platform and use Tradingview for everything else. Alternatively, you can use Flow for execution and reference Tradingview without any account connection. We will also assist you with any configuration to help you save on exchange data.

Best,
Matt Z
Optimus Futures

Just to clarify, I use Tradingview for charting. For trading execution, I use Flow and Tick charts if needed, side-by-side with Tradingview.

1 Like

Yes. That is the cheapest way to configure it.

Matt Z
Optimus Futures

Do many of your users use tick charts? Are there any benefits to them, or should I avoid using them?

this comment may be slightly off-topic, but it’s worth noting that the effectiveness of a particular trading method, in terms of time frame, is entirely up to the trader. A “tick” refers to the smallest unit of trading, so it’s important to have strong analytical skills when dealing with such data.

Besides that here are some benefits, in our opinion, of tock data:

Futures traders turn to tick charts for several reasons, depending on their trading objectives.

Here are some of the common applications for using tick charts:

  1. Decrease Distractions: Tick charts help traders focus on significant price movements by filtering out irrelevant ones. This is especially valuable during low volatility or consolidation periods, where time-based charts may generate numerous bars with little significance.

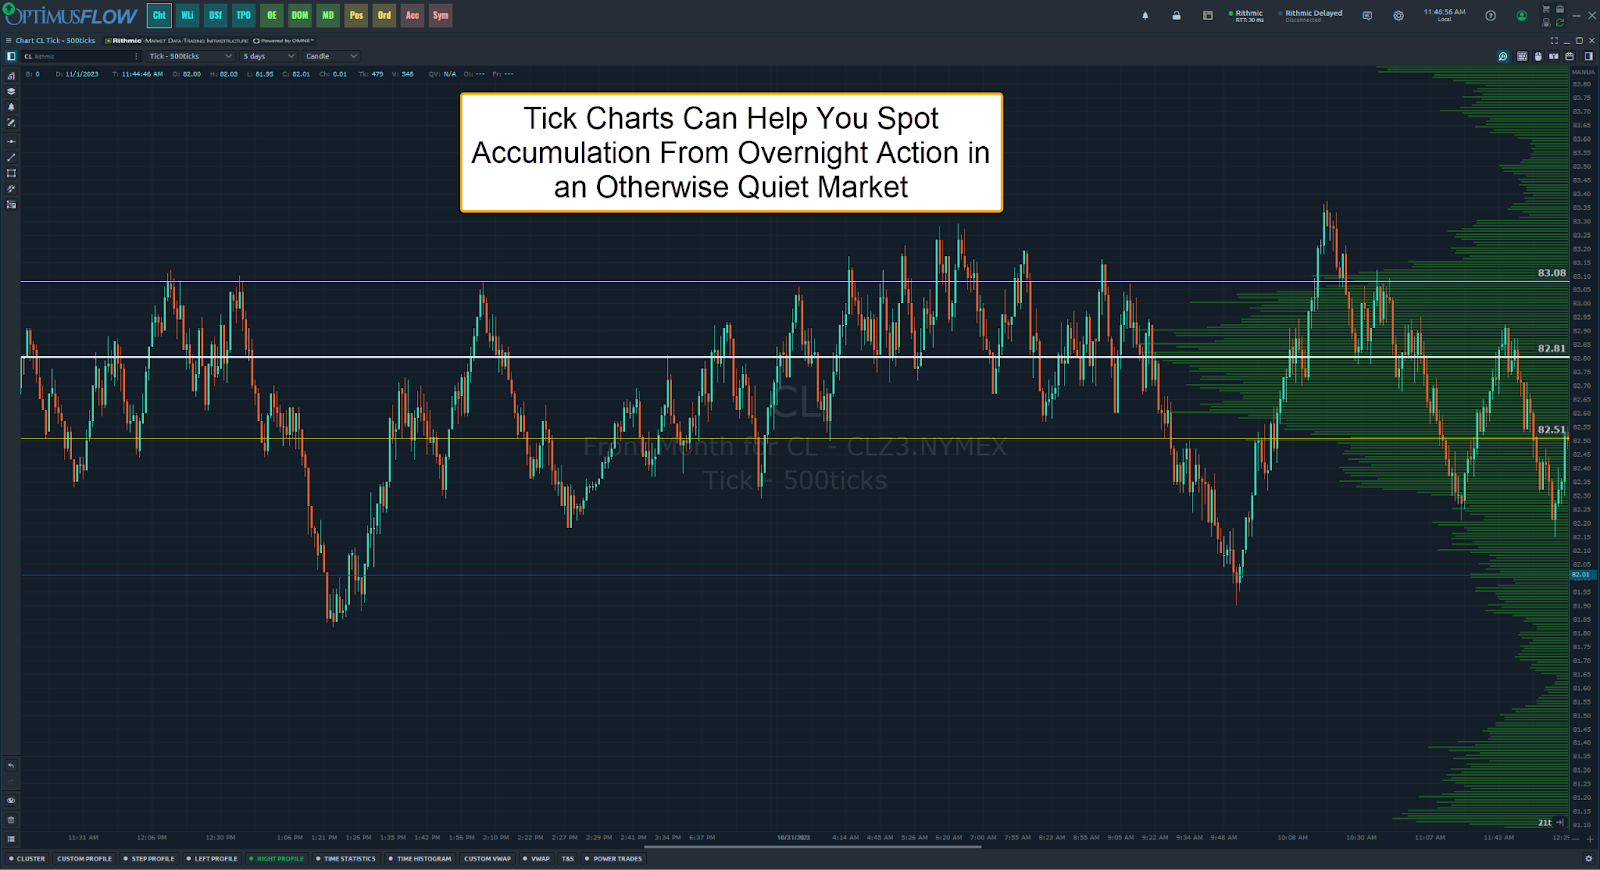
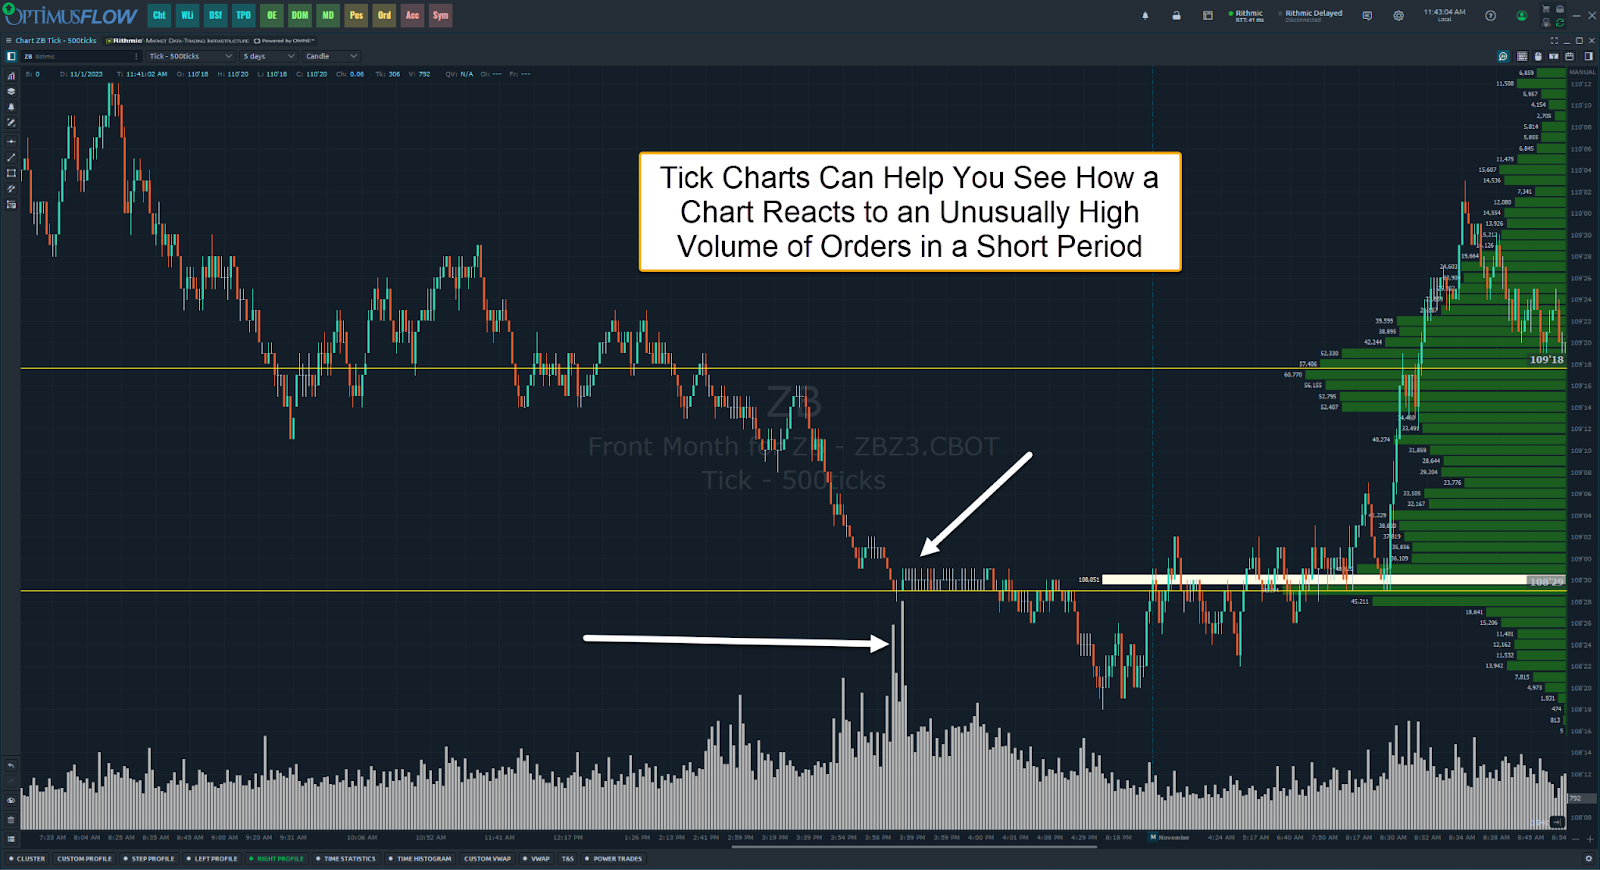
  1. Identify Price Movements: Tick charts highlight price movements supported by high-volume trades, making it easier to spot buying or selling pressure. Time-based charts can obscure volume information.

  1. Recognize Trend Exhaustion: Tick charts can signal when a trend is losing momentum, allowing traders to anticipate reversals or corrections.

Utilizing Optimus Flow for Tick Charts

Optimus Flow offers a range of powerful tools to streamline futures trading and supports tick charts. In addition, it has time charts, Heiken-Ashi, range bars, Renko, line break, Kagi, Point and Figure, and volume charts.

But that’s not all.

Optimus Flow also provides:

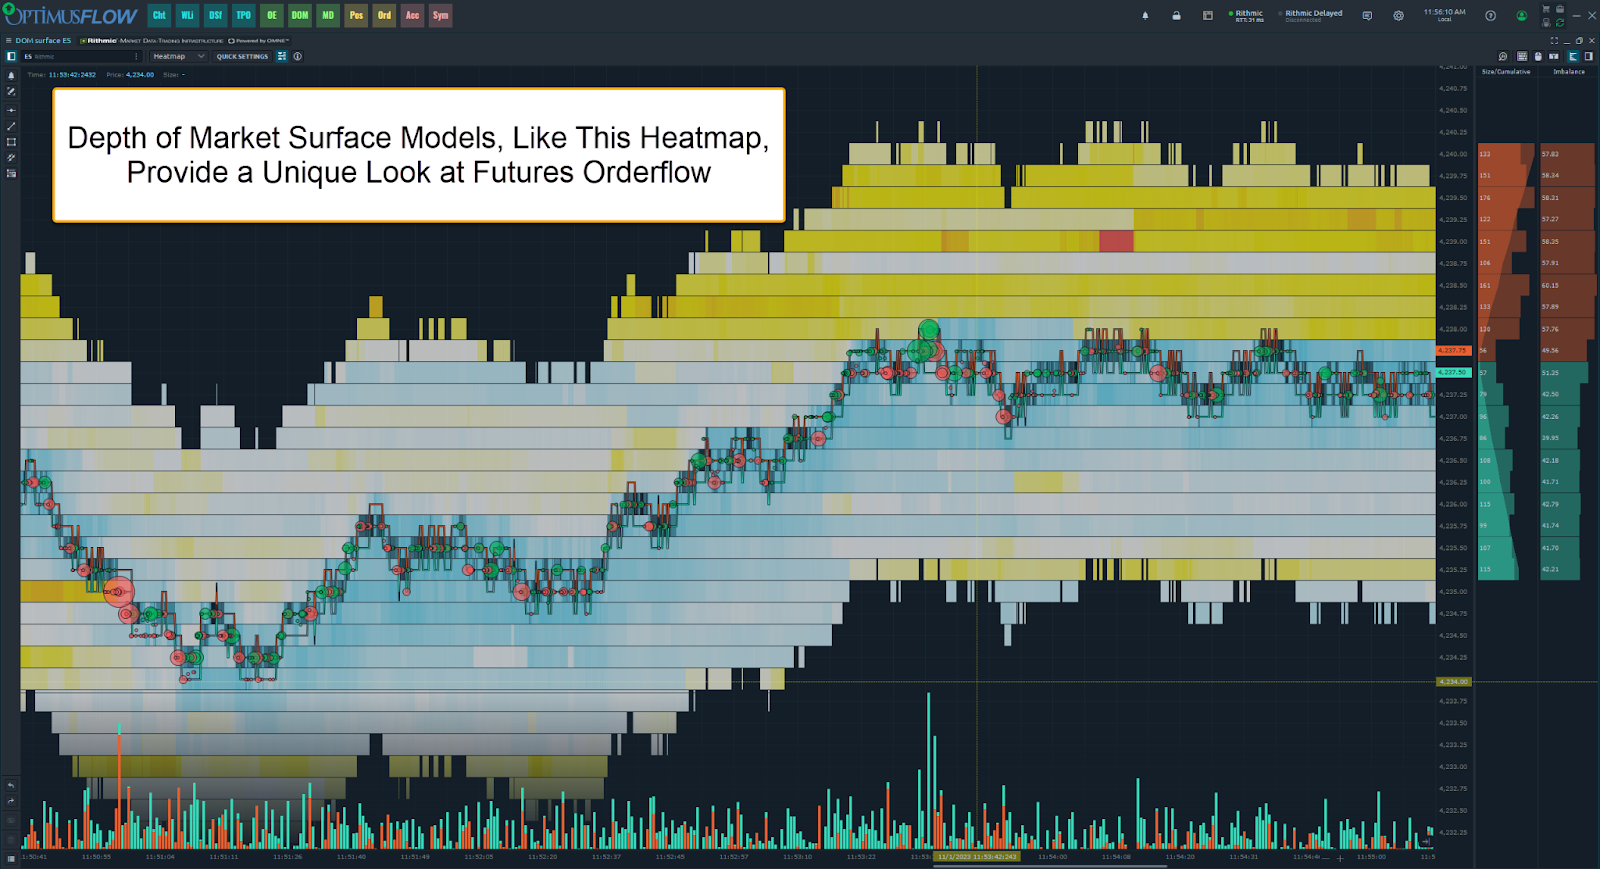
DOM (Depth of Market) Surface: Monitor shifts in liquidity and trading activities with Heatmap views, gaining deeper insights into market movements.

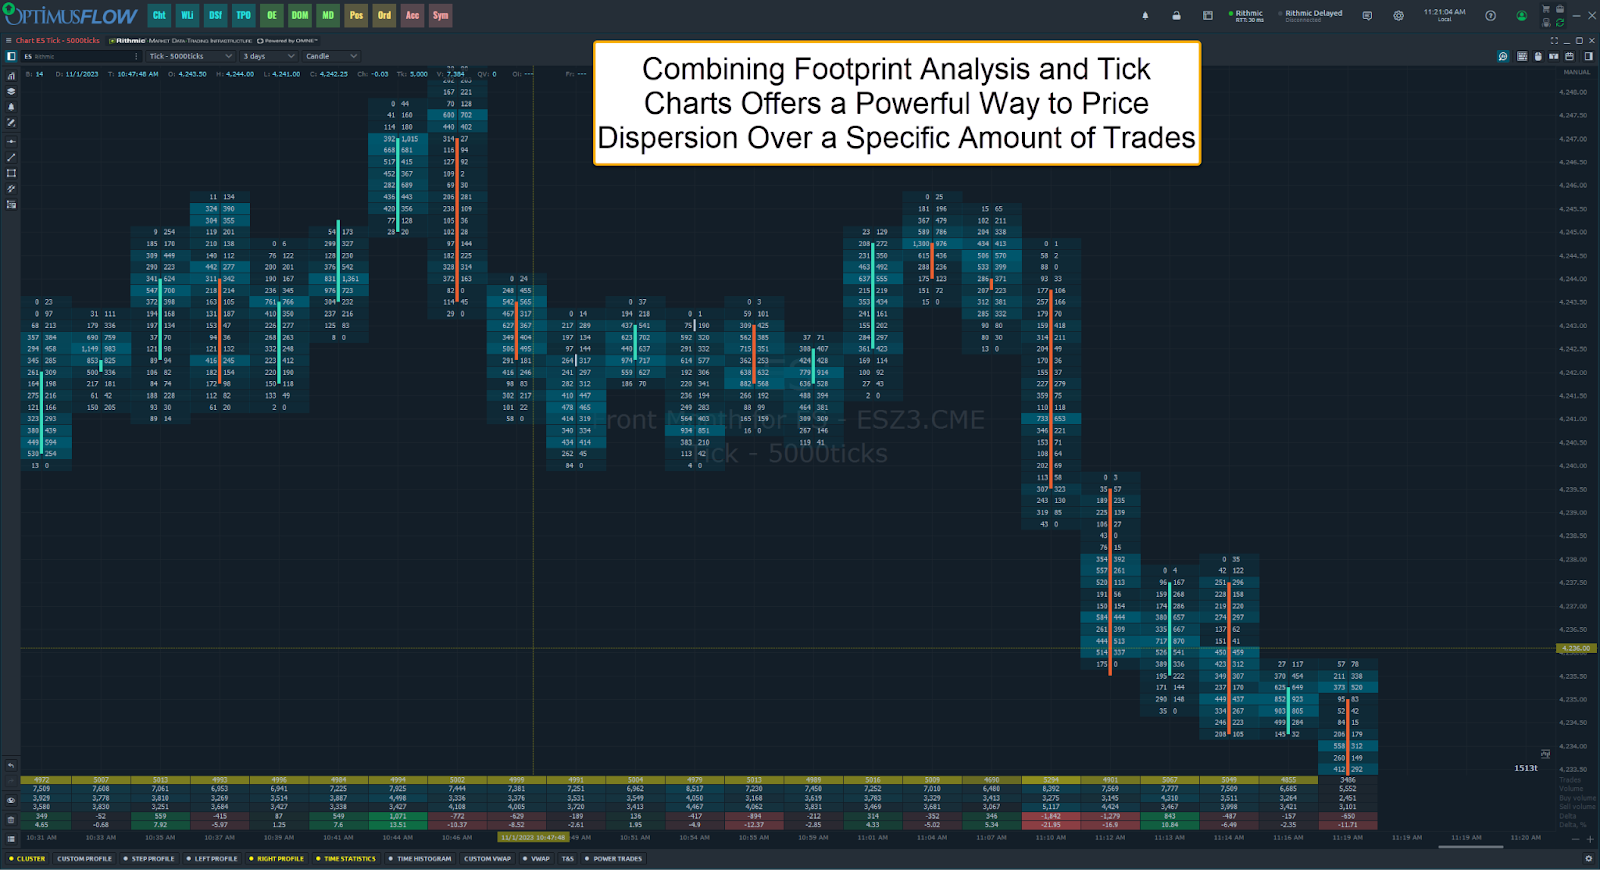
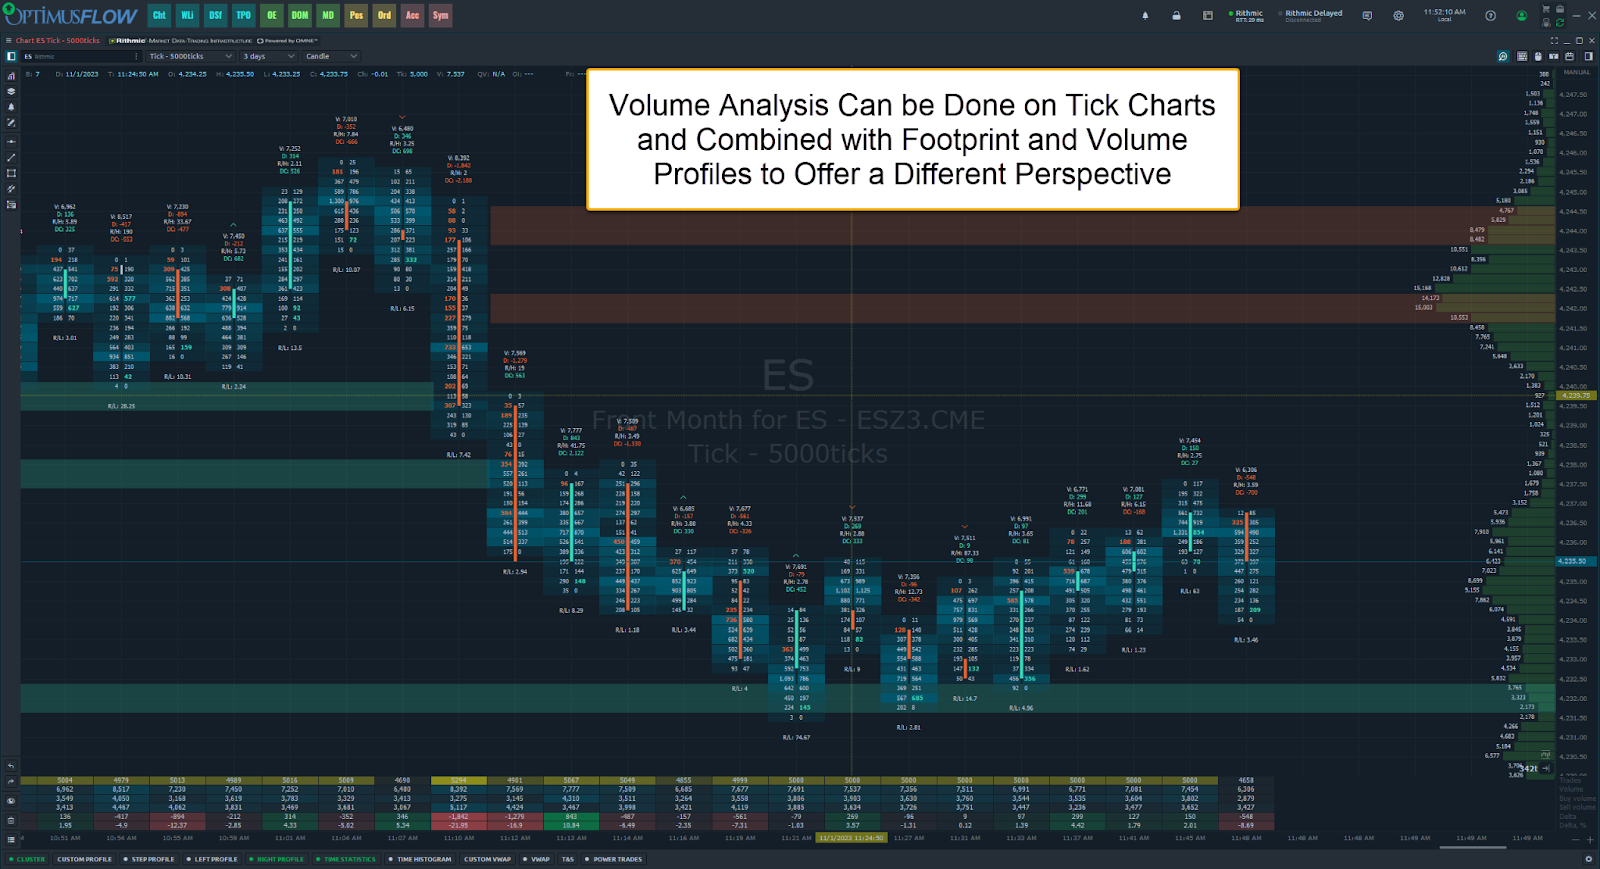
Volume Analysis: Utilize Cluster charts, Volume profiles, Time statistics, and more for comprehensive price and volume analysis.

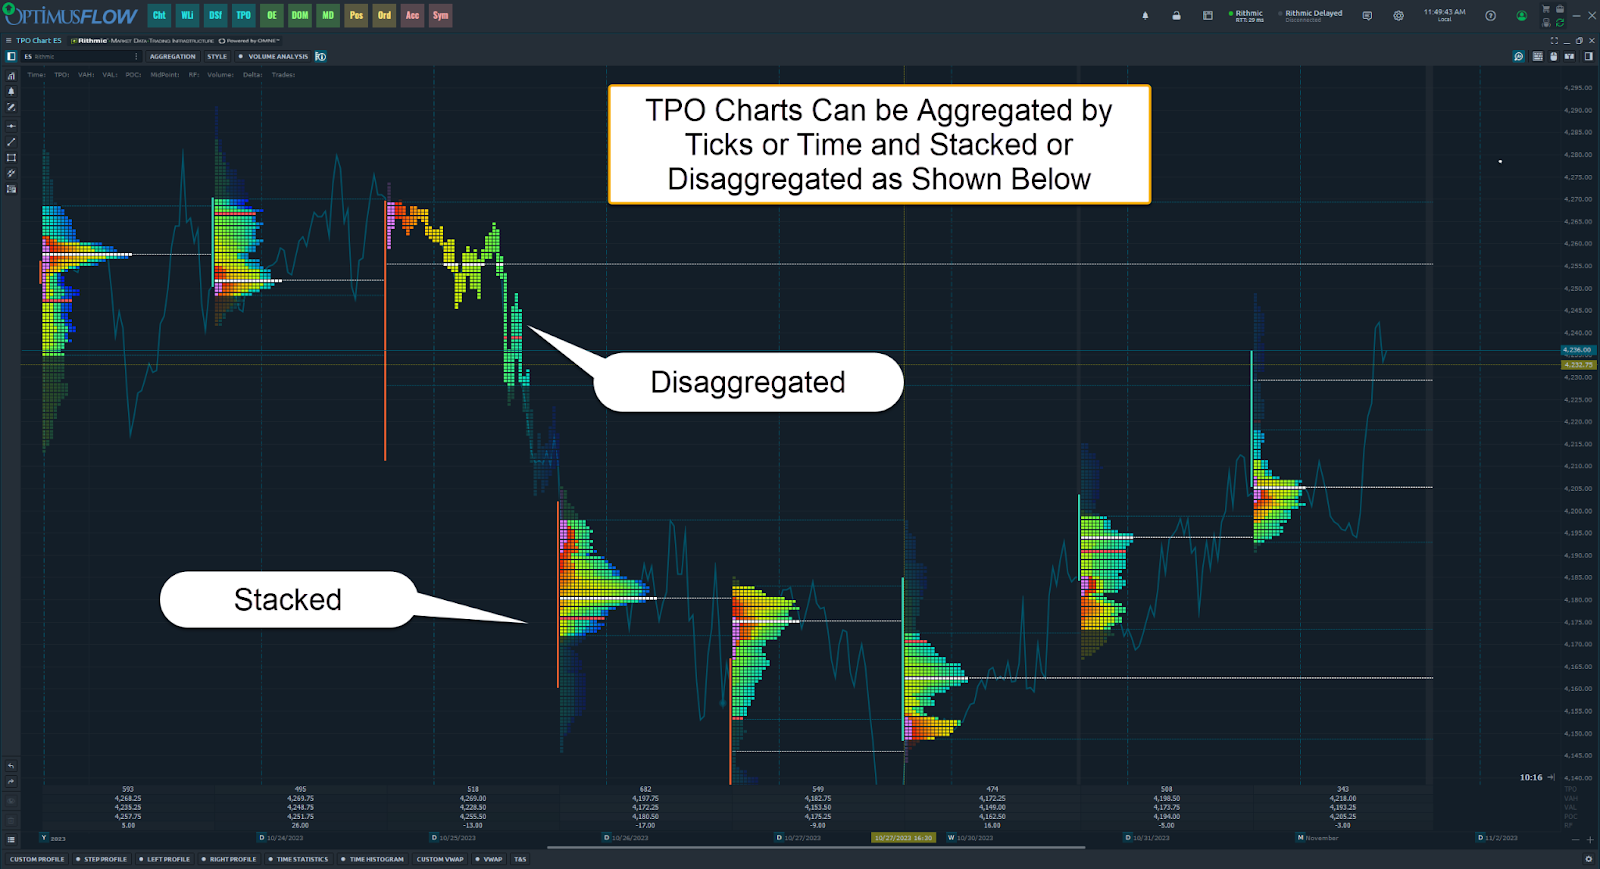
TPO (Time Price Opportunity) Profile Chart: Identify significant support and resistance zones based on time with the TPO Profile chart.

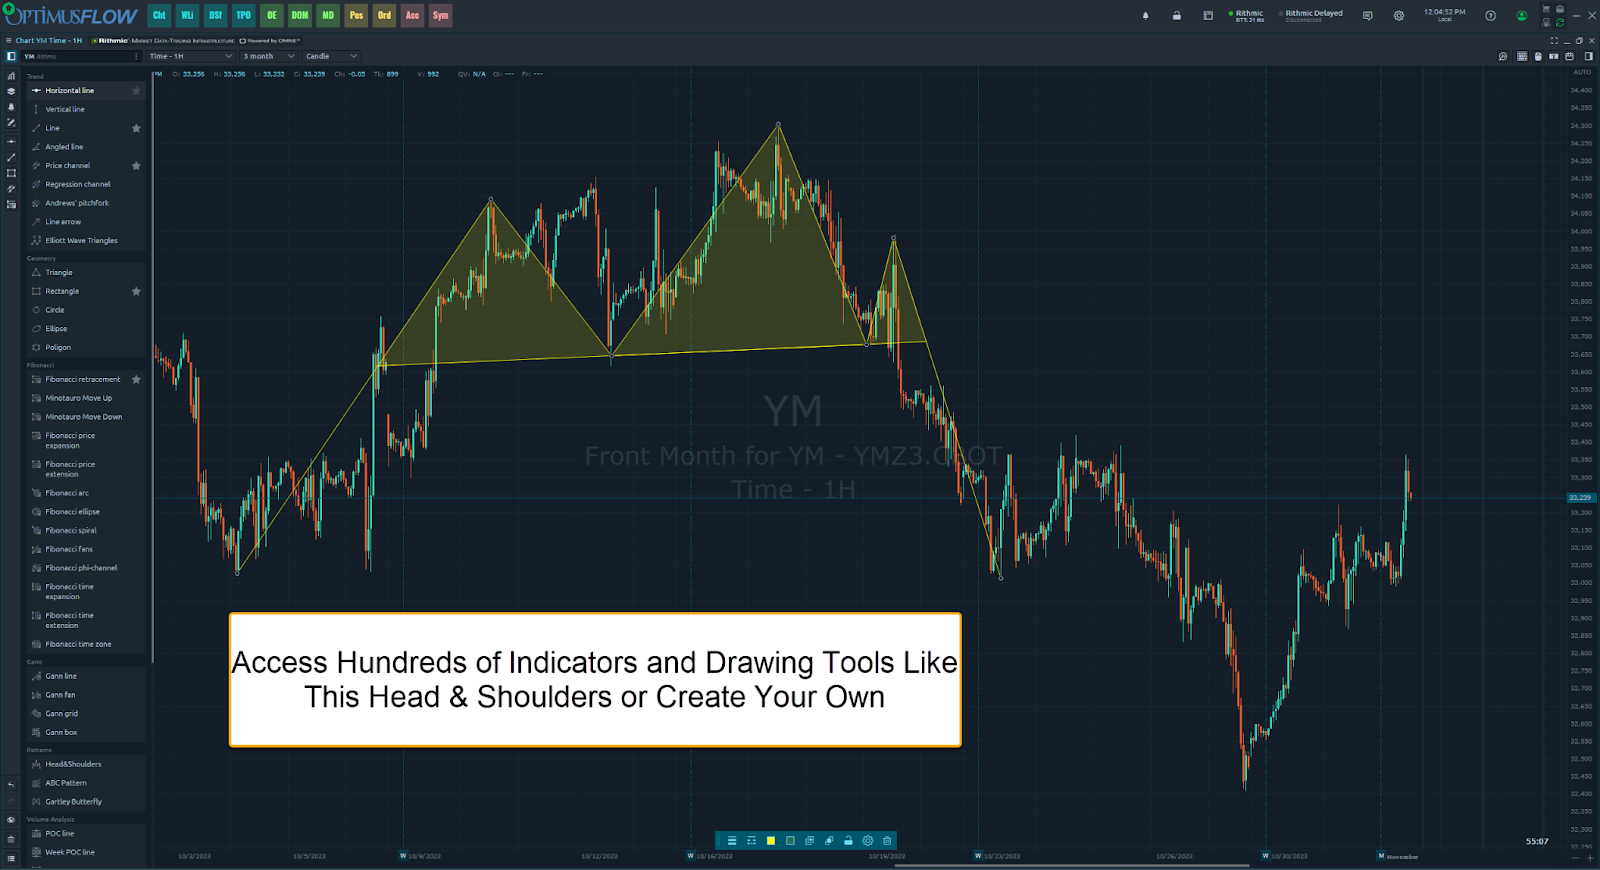
Advanced Features: Customize your analysis with unlimited overlays, indicators, chart alerts, and specialized chart types.

Power Trades: Capitalize on rapid price changes with tools designed for massive order executions in a short timeframe.

Options Trading: Access a suite of tools for crafting and evaluating options trading strategies.

If you’d like to demo Optimus Flow free, click here to get started.

Thank you,
Matt Z
Optimus Futures

There is a substantial risk of loss in futures trading. Past performance is not indicative of future results.

1 Like