When it comes to trade data there are many different solutions for display on a chart. Candle-stick, OHLC, Renko, and Point & Figure bar types are all various ways to show market data as it comes in. FootPrint® charts are an additional way to plot where an instrument has traded, but they are able to incorporate some more valuable information within them in addition to regular trade data.
This extra data that is included in FootPrint® charts is volume related. Several different types of volume data can be show: Total Volume, Volume Delta, or Bid & Ask Volume. This means that traders visualize not only where the market has traded, but also the amount of contracts that were traded at these price levels at any given price point, at any given time.
Let’s take a look at what a Footprint Chart actually looks like:
Courtesy of MarketDelta
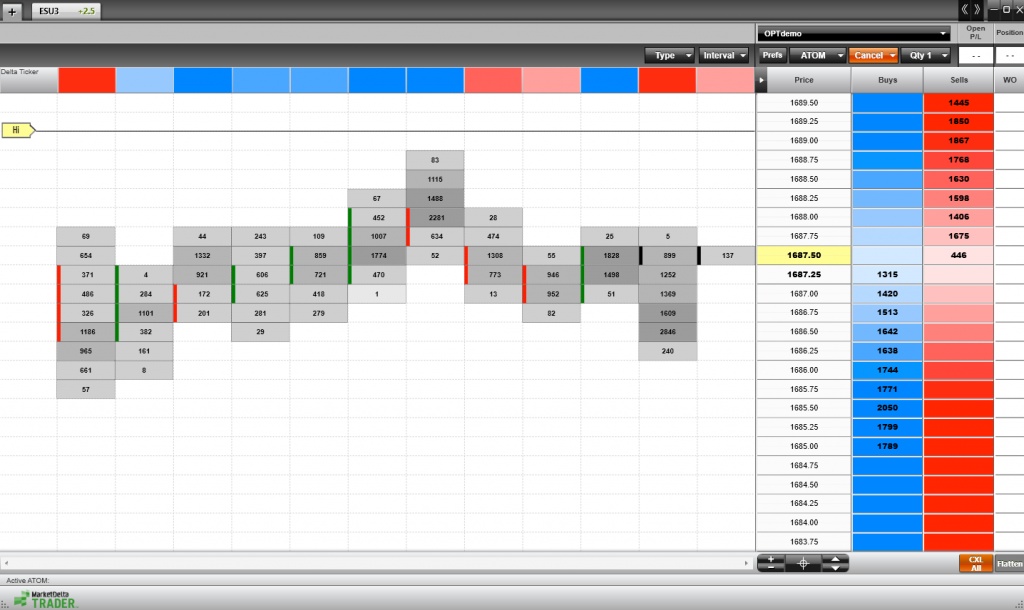
This first image shows a footprint chart from Market Delta Trader, which can be downloaded for free.
You can see the FootPrint® chart is attached to the DOM on the right hand side. Each row of cells on the Footprint chart corresponds to the price level shown on the trading DOM. Every column on the FootPrint® chart corresponds to a 15 minute time interval.
For every column, traders can then locate what price levels the market traded at in combination with the Total Volume that was traded for each specific price level in this case. Showing the Footprint Chart alongside the DOM window gives traders the flexibility to look at both Post-Trade Volume data (what volume levels have already been traded for each price point) and Pre-Trade Volume data (market depth, or the volume available at each price level).
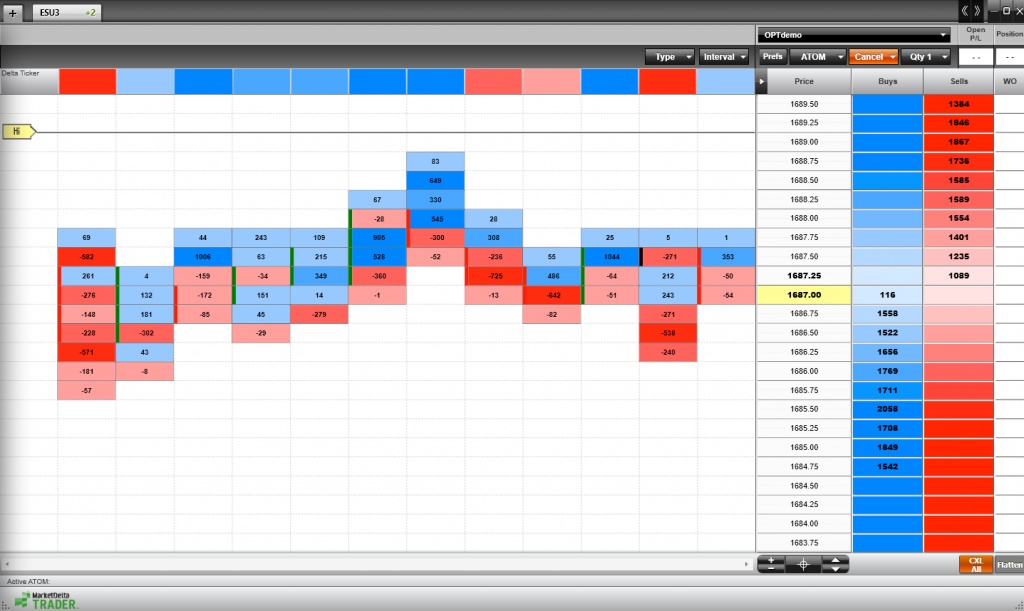
If we take a look at another image, we see a similar set up, but the volume values in the FootPrint® chart are either positive or negative. This is because this Footprint chart is using Delta Volume values as opposed to the Total Volume traded. Delta Volume, by definition, is the difference between the ask and the bid volume levels.
Courtesy of MarketDelta
Delta Volume is said to help illustrate whether the bears or bulls were in control. A negative Delta Volume value meaning that more volume was traded in line with the bears, and a positive Delta volume value meaning the more volume traded in line with the bulls.
When using the Delta Volume option for Footprint charts, the cells are also color-coded to show the varying Delta value thresholds. Values that are more extreme receive a darker color than values that are less extreme. For example, a darker blue for a positive Delta value shows a much greater volume level than a lighter blue. This helps valuate each cell while noting if they are overall positive or negative. For darker red cells traders can see that they are more negative than other cells that may be negative, but only slightly so.
In short, FootPrint® charts can be a good way to get a fresh perspective on the market, and for traders to incorporate reading volume during their analysis. Visualizing where trades have been during a specific time period, how much volume was traded at each price point, and where market depth is currently in relation to these values can provide plenty of insight into where the market could be heading
TRADING FUTURES AND OPTIONS INVOLVES SUBSTANTIAL RISK OF LOSS AND IS NOT SUITABLE FOR ALL INVESTORS. THE USE OF STOP LOSS OR CONTINGENT ORDERS MAY NOT PROTECT PROFITS OR LIMIT LOSSES TO THE AMOUNT INTENTED. CERTAIN MARKET CONDITIONS MAY MAKE IT DIFFICULT OR IMPOSSIBLE TO EXECUTE SUCH ORDERS. PAST PERFORMANCE IS NOT NECESSARILY INDICATIVE OF FUTURE RESULTS.
THERE ARE RISKS ASSOCIATED WITH UTILIZING AN INTERNET-BASED EXECUTION, BUT NOT LIMITED TO, THE FAILURE OF HARDWARE, SOFTWARE AND INTERNET CONNECTION. SINCE TicktoTrade DOES NOT CONTROL SIGNAL POWER, ITS RECEPTION OR ROUTING VIA INTERNET, CONFIGURATION OF YOUR EQUITPMENT OR RELIABILITY OF ITS CONNECTION, WE CANNOT BE RESPONSIBLE FOR COMMUNICATION FAILURES, DISTORTIONS OR DELAYS WHEN TRADING VIA THE INTERNET. TicktoTrade EMPLOYS PHONE SUPPORT IN THE EVENT OF PLATFORM FAILURE.
VFM 29656