How do you Draw or Decide on Support and Resistance?

Let us know in the comment section below: How do you draw support and resistance?

Please tell us your thought process behind drawing support and resistance lines and how you approach it.

Anyone who participates will have a chance to win:

  • THREE months of our platform Optimus Flow
  • FREE Live Data for CME from dxFeed
  • 30 minute one-on-one consultation with Matt
1 Like

Using today - I was taught to look at Highs and Lows.
You want to see a higher time or “range” (I use ranges) you see where price has broke to a new high and when that break is being used as support .

Using this a guide or major levels
I pull up a smaller chart


you’ll see from the trade I took using the prior peek, I used it as support to go long and could have done so three times. My rules currently is after a trade I wait 15 minutes and then i can proceed so because of that I was not able to take the other two trades that came into play

1 Like

2021-03-05T01:13:00Z

Thank you for participating in today’s support and resistance webinar.
Here are the keynotes about support and resistance in any asset class:

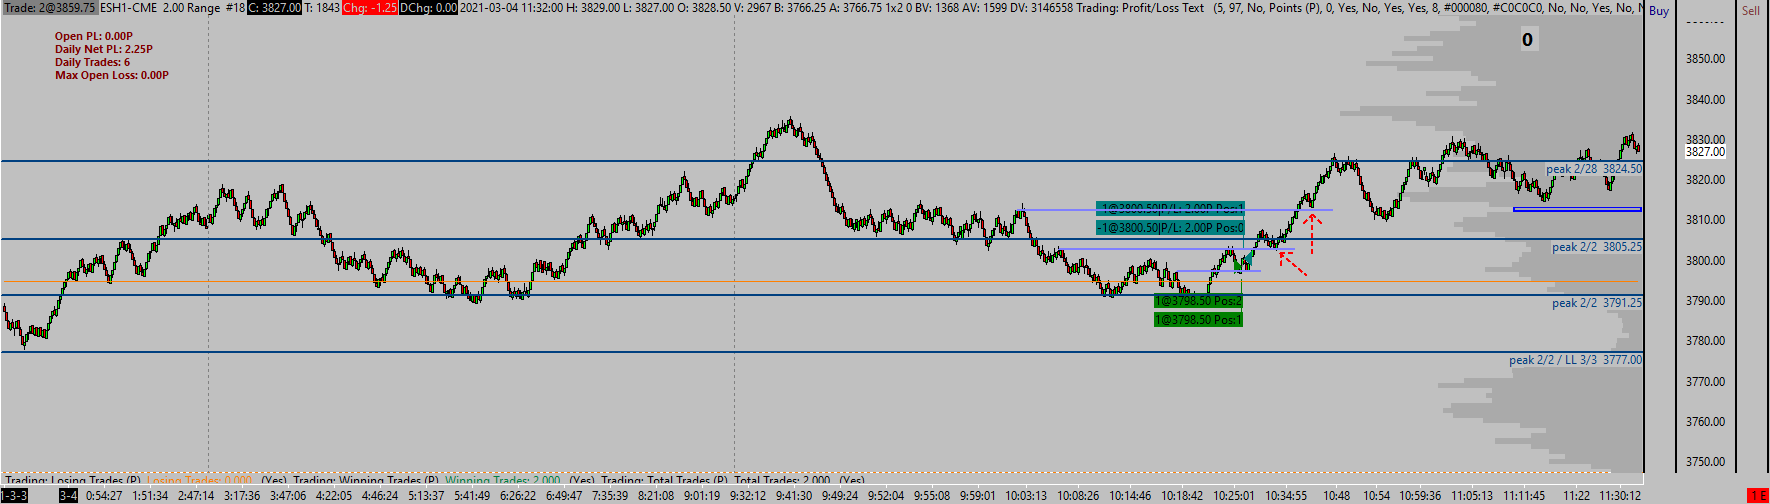
Support and resistance are the most widely used terms used in technical analysis. These levels can be handy and alert you to trends in a particular asset’s price. Support and resistance are easy to understand but hard to master. Support is a level that an asset’s price bounces off from if a downtrend begins. As an asset’s price falls, it will fall to support then bounce back up sharply; this is called a bounce or a pullback. But, support and resistance are not a precise science. It is a subjective interpretation while each trader may find different areas, or we call them in trading lingo, the zones.

On strong trending days:
Look for support in a bullish market trend
Look for Resistance in a bear market trend
Why? While on strong days you have fluctuations back and forth, you should look for support on uptrends. You should look for resistance on downtrends.
This in my opinion should increase your odds of winning trades.

As a day trader, you should use at least three time frames for reference.
Look at two time frames that are higher than the one you are trading from.
Look for support and resistance within these time frames and see whether they occur within the same levels as your shorter time frames. If they do appear, they become “stronger” support or resistance.

As above, support and resistance are not a precise science. No method is. There is always a level of noise you need to accept when you trade. While trading support and resistance, you will see that very often, with a specific channel, there are false breakouts, and then the price resumes to the channel.
Be patient and see how the price behaves around support and resistance, and see whether the support holds or not. It is better to trade a few points of support or resistance because it could verify whether the support or resistance held or not.

Don’t treat support or resistance as a predictive tool rather as a tool that would add probability. Above all, DO NOT try and guess whether specific support and resistance would hold. This is one of the biggest mistakes that traders commit when it comes to support and resistance: A tendency to be impulsive and try and guess whether support or resistance would hold. They would place an order ahead of support or resistance being touched. Remember trading is not a business of prediction it is an odds game while you react to what the market is doing precisely. Exercise patience.

Junior levels versus Observed Levels: These are my terms of distinguishing between those support levels that appear for the first time versus repeated times.

Junior levels could at times serve as reliable support or resistance. The observed levels, often called touchpoints (especially those that repeat many times), are viewable to the entire market and may not hold as traders anticipate.

Let me know if you have any questions.

Best,
Matt Z
Optimus Futures

There is a substantial risk of loss in futures trading. Past performance is not indicative of future results.

3 Likes

I do my standard top down drawings on candlestick charts:

I also find levels in the Footprint chart:

There is a substantial risk of loss in futures trading. Past performance is not indicative of future results. The figures here represent an opinion. The placement of contingent orders by you or broker, or trading advisor, such as a “stop-loss” or “stop-limit” order, will not necessarily limit your losses to the intended amounts, since market conditions may make it impossible to execute such orders. Please conduct your own due diligence if Futures are an appropriate instrument for you.

1 Like

One thing I find helpful is to clear all support/resistance lines before taking a break away from the screen. When I return, I get to see the chart with fresh eyes and can then draw support and resistance lines I see without being affected or biased by any pre-existing drawings.

3 Likes

So I use the SMA and vwap indicators. The SMA being the most important to me. I also draw support and resistance similar to how Matt did in his presentation but without the rectangle boxes… Although I do like the idea.
In my photo the vwap is the blue line going across the top for the most part. The SMA is the white line. I trade 5 minute candles.
So starting from the left you can see where about 10 candles in we get a big red candle that breaks below the sma. If the next candle follows through thats where I will short. I’m still new so I always cover to soon or if long I always sell to early. Right now I just want to build confidence that I am making the right decisions.
So using the VWAP right about the same place you can see the trading went right up to the VWAP line (Blue line). It acted as resistance and everything turned lower. If we were trading above the VWAP I would be looking to see if it held as support and if so I would be looking for a bounce off of it and take a long position when I feel comfortable.
I also draw trend lines and channels throughout the day but really I am rarely trading more then an hr or 2 during the day. Watching the screen all day makes me go blind. I just cant do it.

Thanks for doing these podcasts Matt. It has been really helpful. It’s also kinda of funny, sometimes I listen to you and think your talking about me. LOL. The other day you mentioned that you thought it could actually hurt traders to have success right out of the gate… That was me. Make 700 on my first 5 seconds trading right at the end of the day… It was downhill from there. :).

I do have some very special challenges I will go over in a new post that I will make this week.

3 Likes

Oh and I wanted to add thet if you look on the right side of the chart you can see where we got a big blue bar that broke above the SMA. Follow through on the next bar is a buy signal for me. You can see where that SMA is now acting as support. I wouldn’t have held the entire time but that 2nd bar above the SMA I probably could have scalped 10-15 point on. Depending on how fast it moved. In the overnight market it sometimes just moves way to fast to even try and get in on.

2 Likes

Thanks for the kind words. We all go through certain emotions when we started trading, and one of them is overconfidence. As they say, the market is a humbling mechanism.
I always try to add to the podcast as time allows to help the trading community.

Please feel free to create a new thread with your current challenges. Other traders would be able to chime in as well.

Thank you,
Matt Z
Optimus Futures

3 Likes

Thank you Matt, I have actually been thinking about the new thread I will start… Probably put it together over the weekend and get it posted. My challenges, how I am dealing with them and how I am proceeding going forward. :).

2 Likes

I encourage you to write and describe your challenges because I am sure many face the exact same issues. Being open, honest, and detailed allows you to pinpoint specific weaknesses that need tweaking.

Matt Z
Optimus Futures

2 Likes

Hey Matt, I really enjoy your videos and am glad I stumbled upon them! I’ve been trading stocks for a several years (still very new and learning alot) and now am learning about futures. Your videos have been very helpful.
When I mark out support and resistance lines I start on my smallest time frame by marking out the trend channel. Then I will go back and do this for key price levels. I will then do it on my larger time frames as well. I will then look at the level 2 data to take note of. I don’t pay a huge amount of attention to this because of bluff orders and ice berg orders. What I will do is watch how the market responds (volume, order flow, ect) when we get close to an area I marked out as resistance/support. I will then make a determination of if I will execute or not. I feel like doing this has worked out well for me, but I am always open to learning more to support my method of trading.

Futher I current use a couple different brokers, Lightspeed being my main for stocks and ninja trader for futures. I would love to be able to discuss my options for switching over to you as my futures broker. I would say order execution, speed and platform reliability would be my top needs in a broker. It is also awesome to see a broker from my home state of Florida! One that actually takes time to interact with customers and find out there needs while helping out newer traders! Very cool!

If you or one of your staff could reach out to me and possibly set up a phone call to discuss my options that would be great!

Have a blessed day,

  • Matt M.
2 Likes

Thank you Matt for our Thurday Seminar. Again it opened my eyes again. I like your notes referring independent Thinker. I am not flexible with my time at this moment behind the screen which effect my decision making proces .You need to be totally devoted in case of scalping or day trading otherwise you make mistakes and are placing wrong trades. .I have to learn to follow a fix routine before starting the current trading day. How do i prepare that day, what am i looking for during that day and how can emphasize important point on the chart are for me still important questions. Are you only looking to lines or are you also write down numbers?

What @autobahn in his topic said, i agree with. The only thing is that it is alot of work. Another point is that during the day new short term support and resistance can be created which you has to add to your chart

Drawing Support and Resistance gives me alot ot confidence. I like to 1, 5 and 15 minutes chart to draw support and resistance. The 1 minute give the best probabilities for trades. When all three timeframes on one line just like roof tiles, i find out that probability is the most. You do not see this alot. Important question for me is: Are you trading around new highs and new lows for that day or do you like to trade ranges.

I look to the High, Low of the current day and the first 5 minute candle open and close of the ES, The high low and close of the day before. the high and low of the week and the high and low of that month. In a trending day market i try to see what the average retrace will be and if it will hit again an old support or resistance. How many ticks are in between so you can measure you risk and know where to place you stop loss. I call it one step on the chairs and then on step back and give it a try again.

Hi @Emile_Beijl , I do see how that may be a lot to reset your charts, I would recommend having a base template with all your drawings then duplicate on a shorter time frame and draw your levels.

Then just reference back to your base template and you can clear the lines on the short-term/temporary charts.

I do this maybe once a day, twice a day. It does help me see it clearer and reset my bias.

In terms of trading the highs or lows, I’m going to quote @Mod-MattZ here. He said trading is about “Taking advantage of pricing inefficiencies.”

Retaining this mindset can help us remember that are pricing inefficiencies happening all the time.

I’ve experienced this where I have a short position in a range, then buyers come back and it’s near new highs. It’s clear they are taking over and I either reverse or get out and stay out. I always have to ask, “Where’s the opportunity?”

3 Likes

Thank you for your reply @Ben_M I like your advice to copy the template with the drawings. I will try it out.

I also have questions about your style of trading. I firmly believe that Volume is the only no lagging indicator. I am only struggling with who are the market participant at the moment in the new Candle and does it make any sence to know who that is. I will ask you some questions later next week at the topic you started.

My knowledge says:In the pit with open outcry the ineffeciency was much higher. Ineffeciency in the stockmarket is getting less and less during the years because of computers, automated trading and HF-market making. For scalpers it is getting more difficult especially now HFT are frontrunning our order because of low latency connection or receiving information from a few broker. As far as i know, they can frontrun you limit order but can they also frontrun you stop order? In trading the higher timeframes, you do not have this issue. Maybe i am wrong in this case?

Can you go more in detail about @Mod-MattZ statement " Taken advantages of pricing Ineffeciencies" during trading.

I appriciate your help.

Glad to help, and very happy that the Videos are working.
We Just broke the 7K mark on our YouTube channel, and I hope to fill it with additional useful information to help traders.

We will gain contact with you as requested. In case you need our contact:

Thank you for sharing your ideas with us, and I look forward to your ongoing participation in the community site.

Matt Z
Optimus Futures

1 Like

@Emile_Beijl , I agree with your statement about order flow and volume being the only no lag indicator, I believe this firmly as well.

When I used to trade in Chicago at Kingstree, the CME allowed you to see who you were trading with. Just the firm code, but you could tell who it was.

For instance, Scott who traded the ES Mini was the largest trader in that market. He started seeing large size coming in from 990, Gelber Group, and noticed a trader there spoofing his orders and trading into his own bids and offers.

This created a feud between the two traders. When they saw they were trading with one another, they knew how much size each trader could put on and ultimately used that against them to force a puke and then run price the other way.

Keep in mind, Scott and Oystacher (990) could put on 3,000 - 5,000 contracts at a time and that amount doubled if they were reversing. Scott could be long 4,000 contracts then literally stop the market in it’s tracks with an 8,000 contract offer to reverse.

My point is that it’s common to think and feel there is a bigger player out there messing with retail traders, but if you are trading anything below 500 contracts you probably won’t raise any flags about your style or tactics. There are days when I see “someone”, whether it’s a firm or one trader, who isn’t discrete about their size. But it’s only to the tune of 1,000 contracts or so. In the end, the market still goes the way it goes.

I would ask, when you talk about front running are you missing your entries or exits by 1-2 ticks?

2 Likes

@Ben_M Thank you for your reply. I appriciate your help. I like your videos and explanation. Next week i have much more time to look into your posts more thoroughly. Glad to see that much other traders are participating in the " Optimus Futures Community" with interesting subjects and valuable information.

I always had in my mind: if i can not explain certain situations in simple words to others, then i do not understand the issue.I am just starting investigating Market profile , order flow and bookmap. With your explanaton it is getting more and more clear. We are on the right track.

Coming back to your question: I think your right. The market goes where it has to go. It has to move in a certain direction back and fort because traders want to have a piece of the cake. On the other hand, certain market participants are obbligate to trade because of the funds they have to there disposal and needs to be located in the market. For example hedgers. At a certain moment you have to except the market conditions and anticipate on the movement. To much trading information makes you desperate. During the seminar @Mod-MattZ mentioned that there i alot of useless informaton available on the internet and you have to filter what you need. I agree on that. You have to find your own niche in the market and try to make it more perfect.

1 Like