I can see my chart in my local (new york) time zone. And, I can also see in Exchange (chicago) timezone. How can I view my chart in a custom timezone, such as NY+7 timezone? (This helps me see ES chart to start Monday at 1:00am in NY+7 timezone)
Hi @usus222,
Thanks for your question and welcome to the community forum!
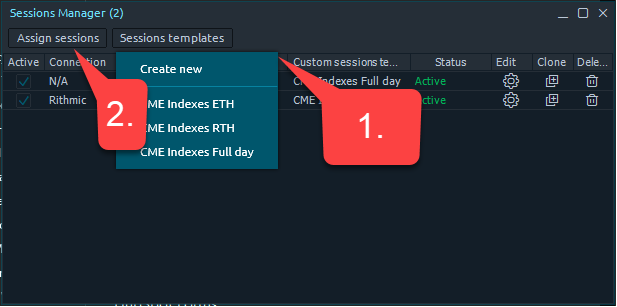
For what you are requesting, it sounds like you’ll need to create yourself a session template. You can use our platform’s session manager to create custom sessions for your charts. You can separate sessions by any custom timeframe on Optimus Flow:
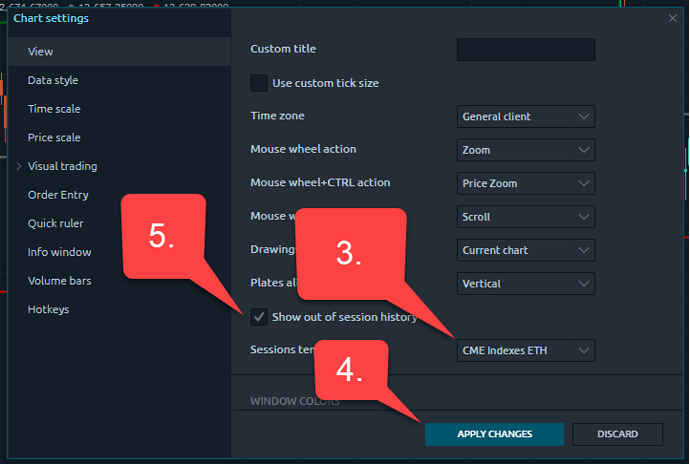
We then have an option within all charts for “Show out of session history” – if this is disabled with a custom session created around the hours you specify, it will block out all data outside of your desired time range OR you can enable it to show all data (and just graphically display the session breaks).
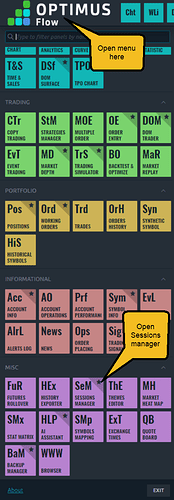
In our main menu, go to SEM (Session manager):

Then create a template and choose your hours. Once you have a template saved, right click your chart > Settings > View > Sessions Template > And then choose template you created.
From there, you can uncheck the “Show out of session history” right above to replicate what I described above
This will then only display market data for your specified end time or graphically display the session breaks on your chart.
I hope you find this helpful!
Optimus futures Support
Thank you. How can I do this for MultiCharts?
Hi @usus222,
We apologize, the instructions above were for our platform, Optimus Flow.
According to what we can find on MultiCharts, it seems that the platform can only customize timezones based on the local computer time or by the exchange time. If you haven’t already, you may first need to customize your local time zone on your computer to NY+7.
Once you have set the timezone on your actual computer to NY+7, we believe we found the solution on their site here: Time Zone - MultiCharts.
Time Zone is set from the Format Instruments window:
-
Open the Format Instruments window ( To open the Format Instruments window, click the Format Instruments icon on the main toolbar; if the Format Objects window appears, select the symbol and click the Format button.)
-
Select the Settings tab.
-
In the Display section, in the Time Zone drop-down list box, choose Local or Exchange Time Zone
We hope you find this helpful!
Best,
Optimus Futures Support

