I’m brand new to Sierra Charts and still trying to figure things out. The issue I’m having is that I want my Market Internals indicators (NISS-NYSE & TICK-NYSE) on my ES chart. Unfortunately they are listed under the symbol ‘Market Stats’ and when opened, open in separate windows. Even when using the vertical tile alignment feature, it is difficult to sync the times on all 3 charts to identically correlate. Is there a way to make these indicators appear on my main chart the same way a ‘Study’ does?
1 Like
Hi @DonB,
Great question. There is actually a study that allows you to add additional symbols to your “main chart”, this is study is called Add Additional Symbol.
This will allow you to add more than one chart to a single timeframe on Sierra Chart.
First you will need to open a chart. I recommend to open the ES symbol in a chart first. The contract you add first will be considered the “Primary” contract and will set the time interval for the other two charts you are looking to add.
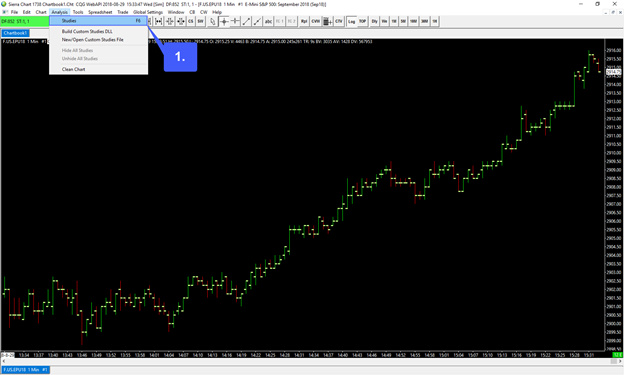
1 . After opening your E-MINI S&P 500 contract on a chart, head over to Analysis > Studies
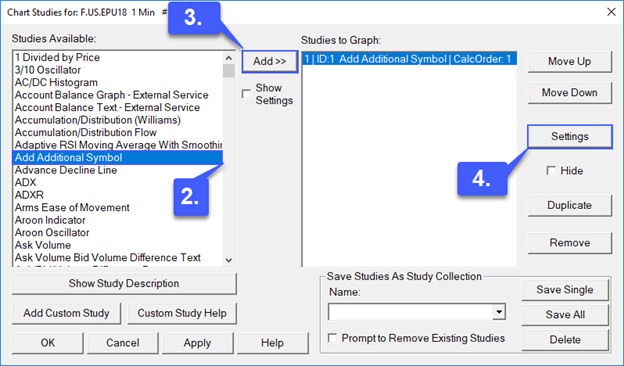
2. In the studies window, scroll down just a bit until you reach the Add Additional Symbol study and left click it to highlight it. (Studies are listed in alphabetical order)
3. After highlighting the study, left click the Add >> button.
4. Once the study has been added and appears on the right hand side of the window, left click the Settings button.
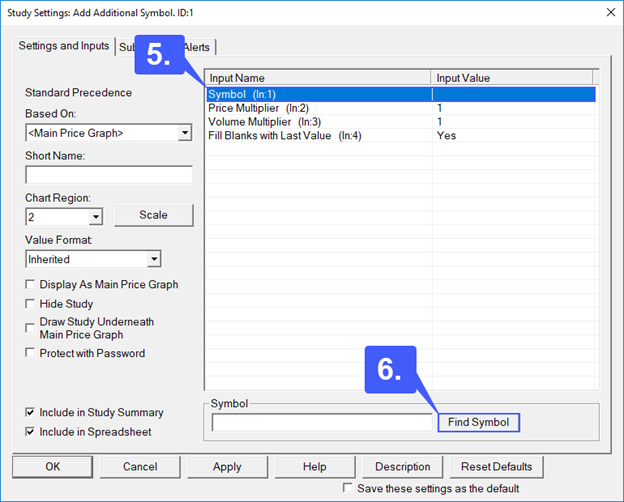
5. In the settings window, first, highlight the Symbol field.
6. Then left click the Find Symbol button located in the bottom right corner of the window.
7. We can now add our next contract to our chart. As requested, we will be adding the NYSE AD line and NYSE tick data. This is the same process as opening a chart, locate your symbol in the menu and then click OK. First we will be adding the NYSE Tick.
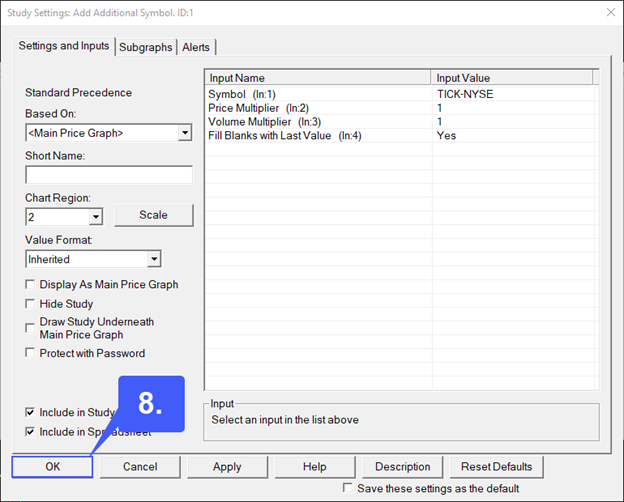
8. Once added you can now see that the symbol appears in our symbol field. Left click the OK button once the symbol has been added.
9. We will now need to follow the same exact process once more to add an additional symbol. First, add another Add Additional Symbol study , access settings, add your final symbol (NYSE AD Line), and then left click OK.
10. Once both studies have been added with the correct symbols, in the Chart Studies window left click the Apply button to add the symbols to your primary chart.
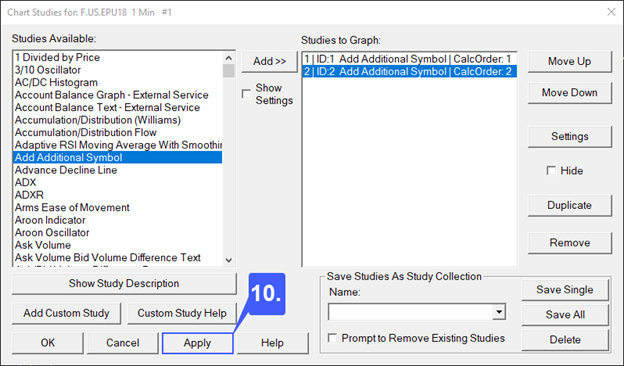
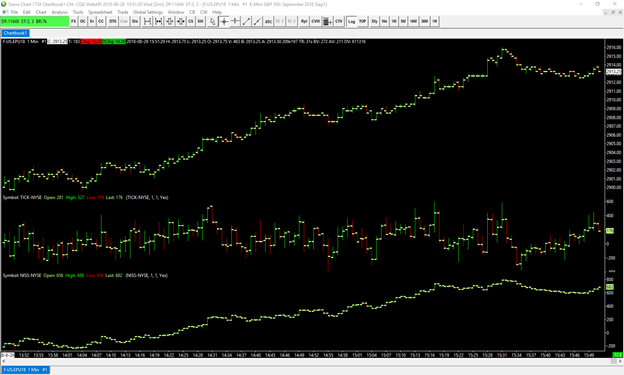
As you can see based off of the image below we now have three separate symbols/contracts on one chart, all sharing one time frame that can be scaled all at once.
If you’d like you can also take a look at one of our videos covering this topic:

I hope this was along the lines of what you were looking for.
Let me know if you require any further information or assistance,
Jake
Optimus Futures Support
(800) 771-6748
2 Likes
Thank you so much Jake!
1 Like