How to save the recent changes on the CHARTS and/or DOMs as defaults for future charts and DOMs?
Thanks,
- P11
How to save the recent changes on the CHARTS and/or DOMs as defaults for future charts and DOMs?
Thanks,
Hi @Project11,
By saving the current windows you have open to a chartbook, the platform will automatically save any settings/studies/drawings you have applied to those windows as the “default” for the next time you open your saved chartbook. This can be referred to in this thread here: How to properly save default settings, workspace, chartbook? - #3 by Project11
As for creating a universal template which can be applied to other charts down the line, you can create templates for both charts and studies individually.
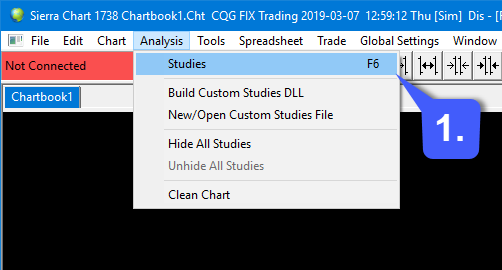
A study template can be referred to as a study collection on Sierra Chart. A Study Collection can then be applied to an existing or new chart by selecting the Study Collection name from the Analysis menu. To save any applied studies on a chart as a study collection, which in turn, can be applied to future charts head over to 1. Analysis > Studies
2. Within chart studies, first add the studies you’d like to use as a template going forward.
3. Type a name you would like to create for your “template” or study collection.
4. Click Save All
5. Going forward, on any new chart that is opened, navigate back to the Chart Studies window, select your customized study collection from the drop-down menu shown in step 3, and then click the Apply button. This will automatically apply any study you have saved to a study collection.
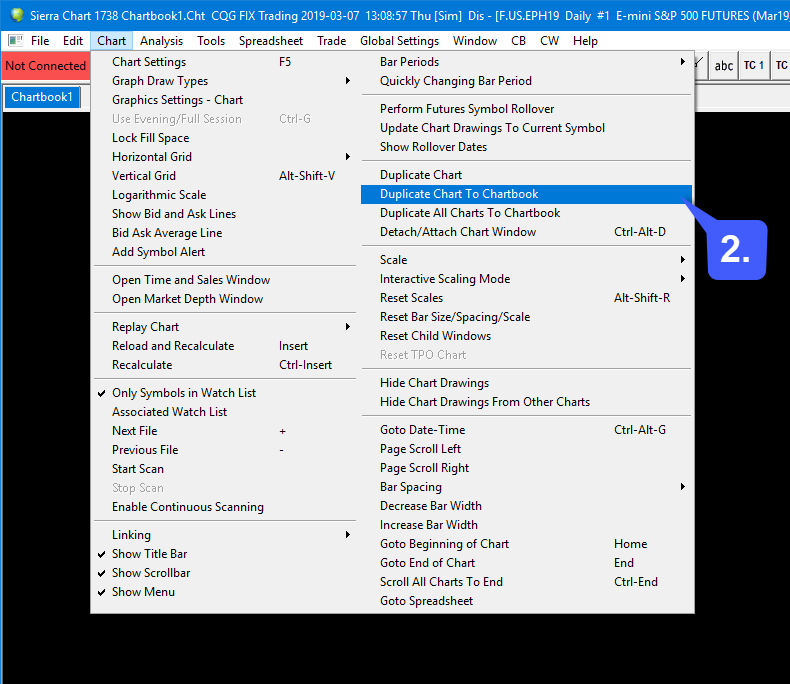
As for duplicating a chart template, if you have saved your chart/DOM as a chartbook referred to in the linked thread, you can first open the chartbook and then duplicate your chart/Dom settings to a newly opened chart.
You can do this by 1. Opening the chart you would like to duplicate the settings from.
2. Navigate to Chart > Duplicate Chart. This will extend the exact settings from the first chart to the newly opened second one.
Lastly, if you want to set default chart settings for any new chart opened:
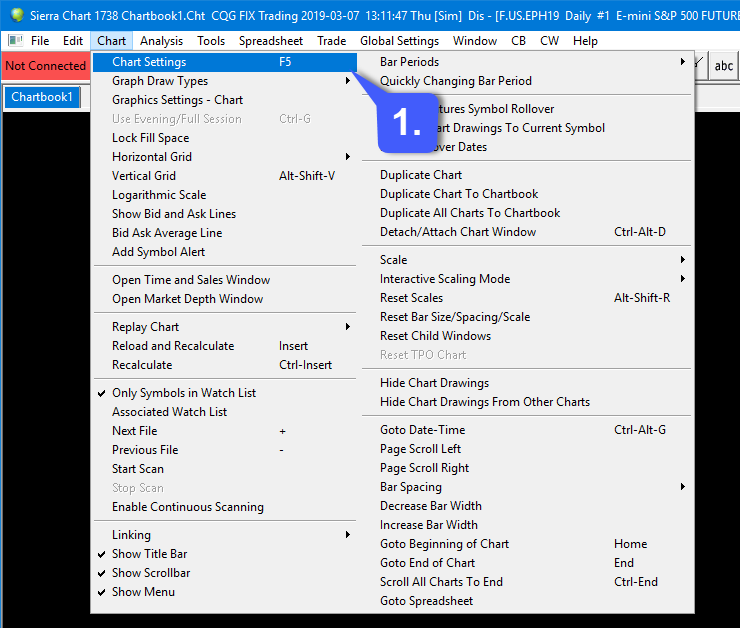
1. Select Chart > Chart Settings on the menu.
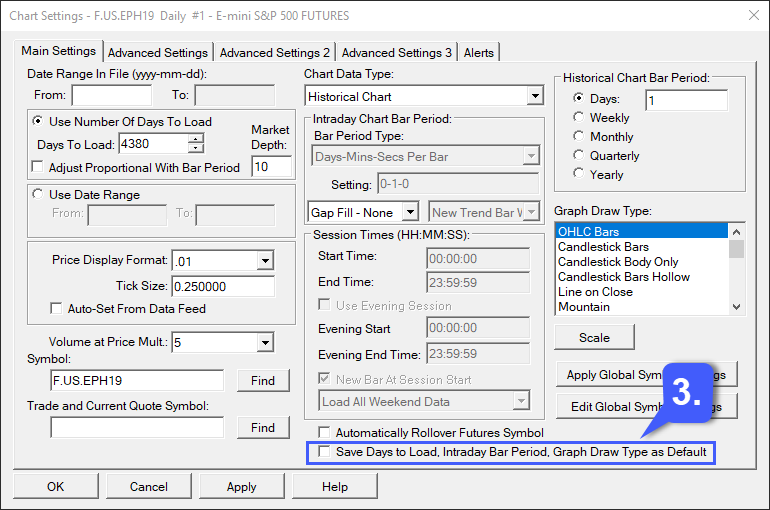
2. Set the Days to Load, Intraday Bar Period (Intraday charts only) and the Graph Draw Type as you require.
3. Enable the Save Days to Load, Intraday Bar Period, Graph Draw Type as Default option.
4. Press OK .
5. When you open a new chart, these default settings will be applied to that new chart.
This was quite a lengthy answer, but I wanted to provide you with as many alternatives as possible. There are so many configurable options on Sierra Chart, some may work for you, some may not. It’s best to look into all the options available!
Thanks,
Jake
Optimus Futures Support ![]()
@Mod-JakeM,
Most appreciated. You have clearly explained exactly what I was looking for.
Thanks!!