Originally published at: How to Trade Using Renko Charts | Renko-Based Trading Strategies
This article on Renko Charts is the opinion of Optimus Futures

Sometimes the optimal way to gain an edge in trading is to reduce or eliminate anything that might detract from it. In other words, addition by subtraction . To make an FX analogy, this would be like one national currency strengthening because its counterpart currency is weakening, thus naturally propelling its price higher. In the realm of trading, we’re talking about the balance between signal to noise –reducing one to strengthen the other.
From July 21 to July 3, 2019, the YM 15-minute chart does not give us any substantial indication of clear directionality.
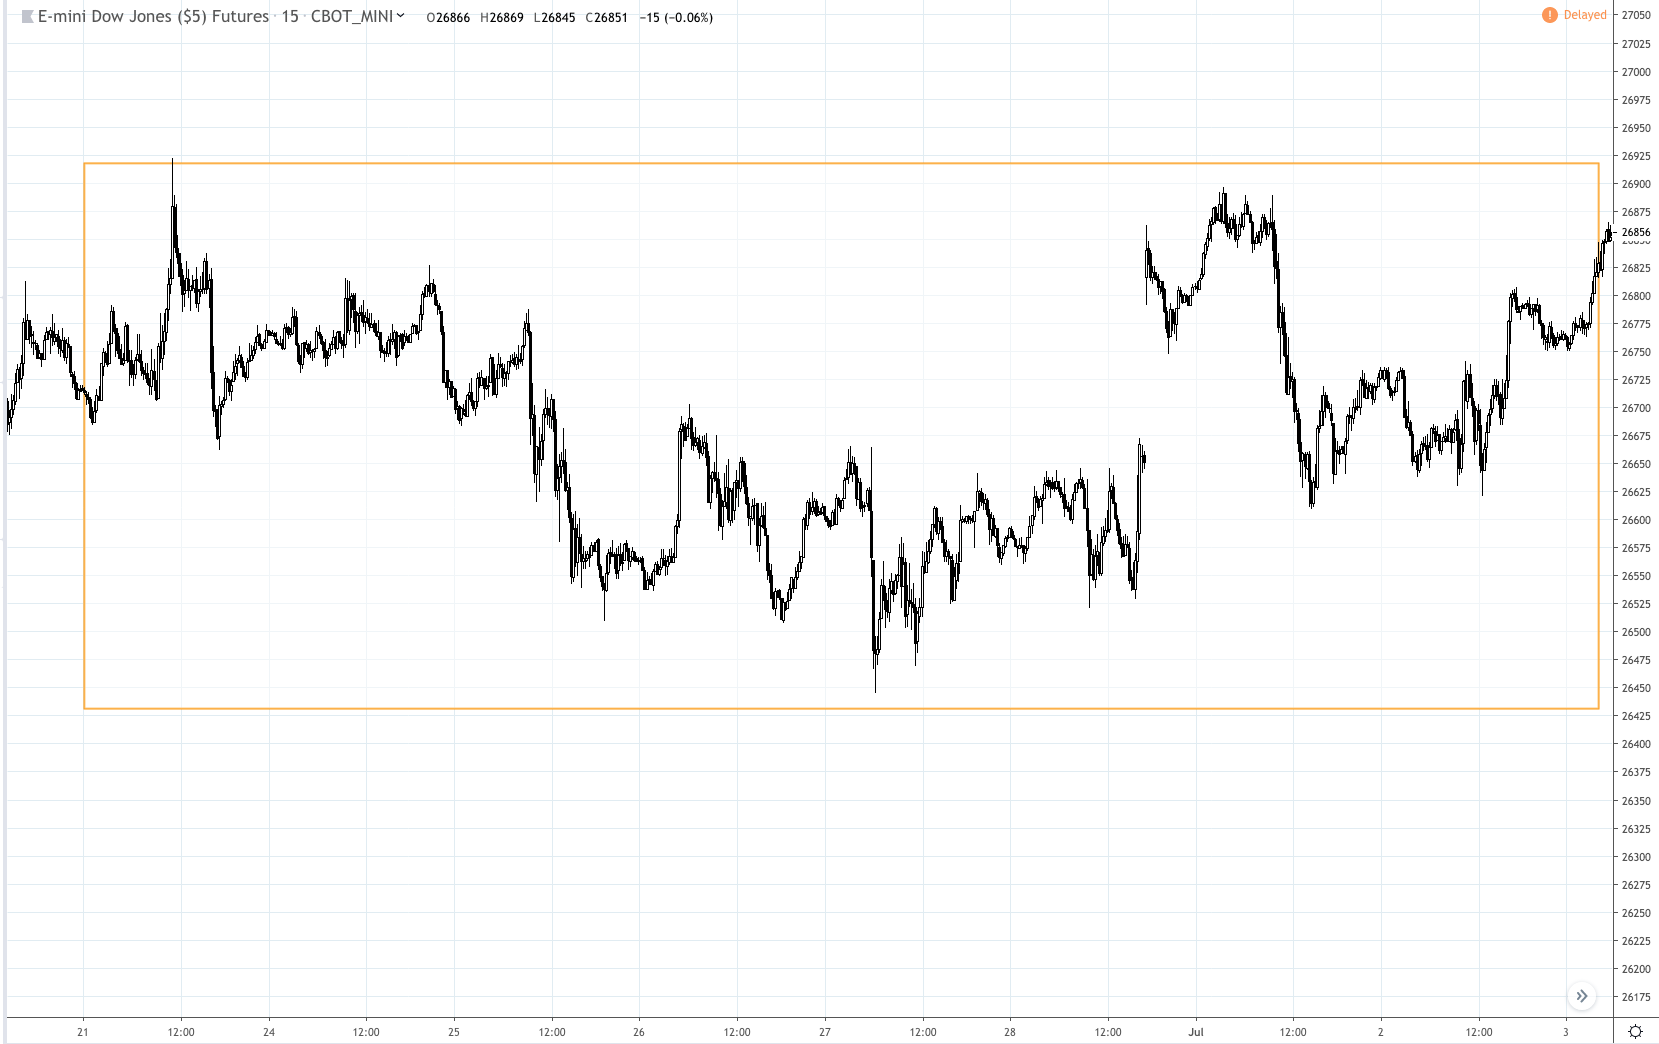
We see a range, tradeable perhaps, but only for those who trade noise (which is a legitimate form of trading). Add to this difficulty the likelihood that the broader stock market’s mood has been sensitive to President Trump’s tweets concerning US-China trade talks. In addition to this, the global trend toward reflation via central bank policy has been supportive of the fundamental environment, countering market fears of a global economic slowdown.
Would you technically trade noise given this type of environment? Zooming out to the 1-hour can sometimes help, but in this case, it makes very little difference.
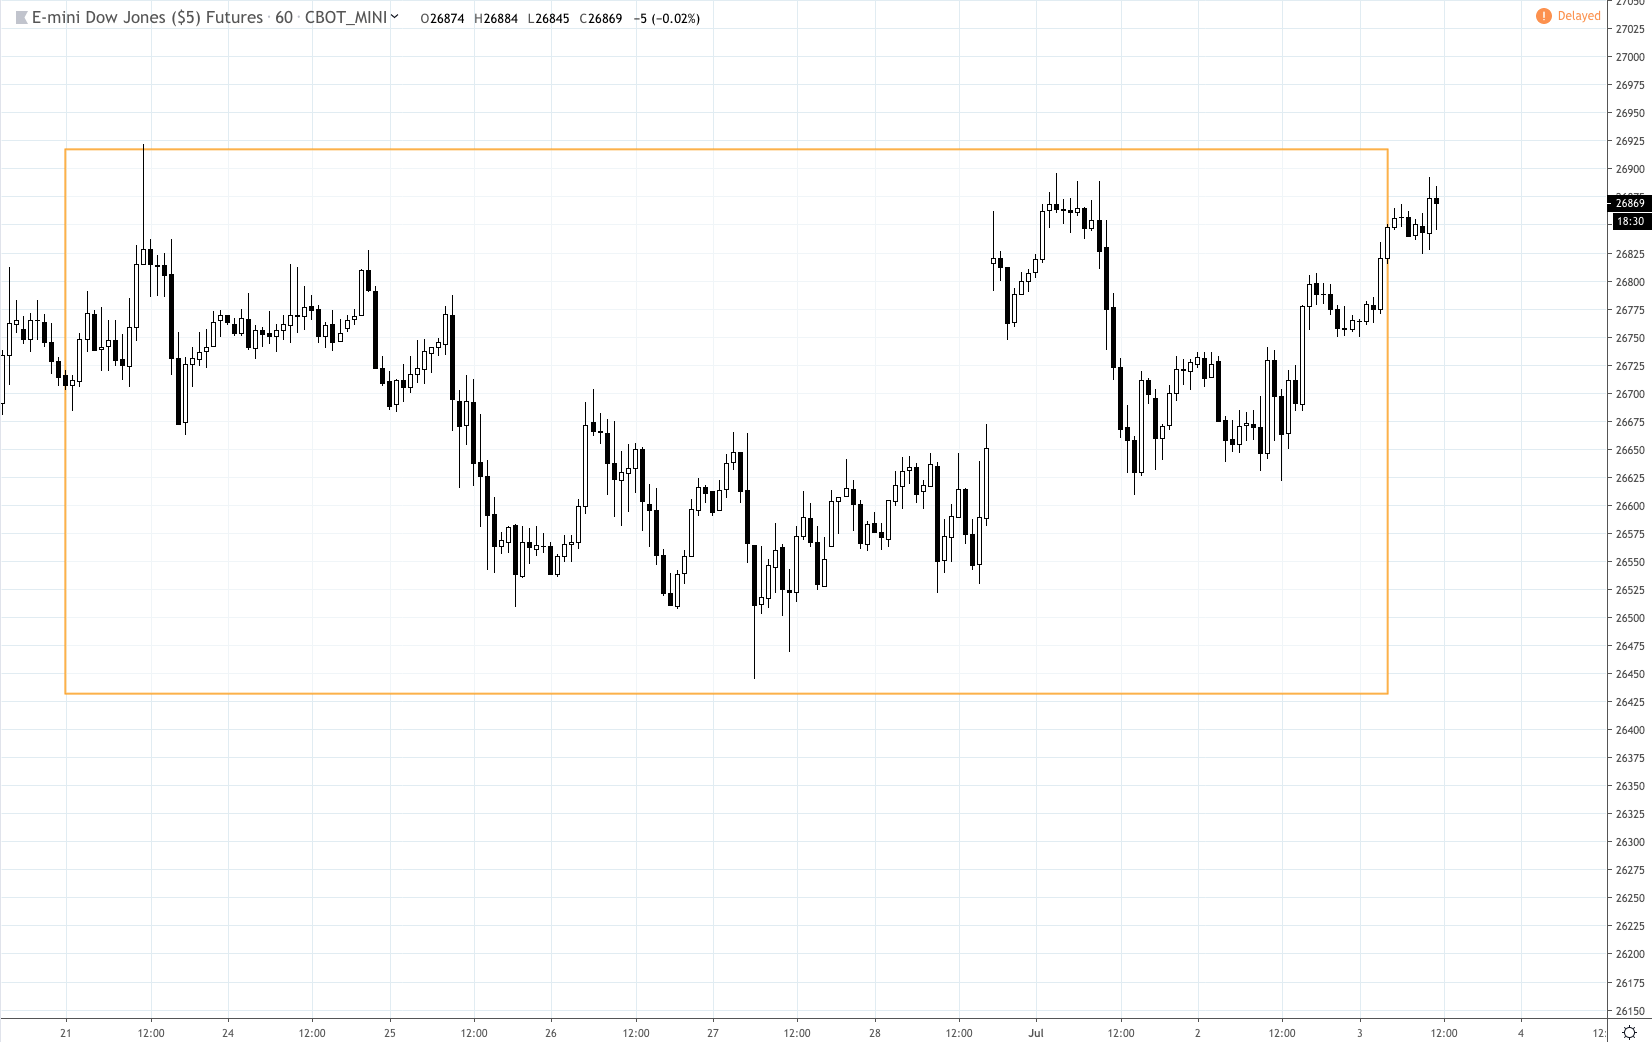
The 1-day chart gives us a little more context.

Given the bullish trend line at [1], was the spinning top at [2] the place to get in, keeping in mind that price breaking above resistance at [3] may be critical to confirming the bullish bias?
Perhaps the chart below paints a clearer picture of the “potential” reversal, one that might have been actionable if you were to have used it as a reference point for any other chart you may have been looking at.

Here, not only is the reversal bias clear, we can also see three potential entry points. Comparing them with the candlesticks, these price points coincide as follows.

The first entry at [1] would have been slightly above the lowest spinning top; the entries at [2] and [3] might not have been triggered until the end of the close of the third to the last bar which marked a down day. But unlike the candlestick chart, which might not have given you an indication to go long, the renko chart showed a two-brick break toward the upside which might have gotten you in position to catch the subsequent upward movement.
Amplifying Signal and Turning Down the Noise Volume
The main point here is that renko charts can help to amplify the signal, that is, the substantial movements, if that is what you intend on trading. You can use renko as a stand-alone chart, or you can use it as a supplement to confirm directional bias regardless of what chart you are using and which time frame you may be trading.
Because, renko charts do not chart “time,” what you are seeing are the movements of price. If you are not familiar enough with how renko charts are constructed or how they work, see the appendix below–at the end of this article–for a quick primer .
For now, let’s take a look at two renko-based strategies that might help you anticipate turning points and entry/exit points in a manner that cannot easily be seen on your candlestick or bar charts.
Strategy 1 – Renko Charts and RSI Divergence
Note: The following renko chart has a box (brick) size of 50 points. When price closes above or below a 50-point increment, the box gets colored in. You can see prices in real time (in the form of light boxes that get shaded in as price moves above or below the incremental range, but the color of the box doesn’t become prominent until the end of the day). But because you can see the boxes responding to real-time prices, you may be able to trade the instrument in real time.
In the YM futures, whereas the RSI on the candlestick charts from January 19 to February 25, 2019 showed nothing out of the ordinary for the price swing below…

…however, the renko chart showed a much more prominent divergence between price and RSI…

So did this say anything meaningful, as in “actionable”? It turns out that it didn’t, besides giving an early warning. You might have been able to trade the pullback, but that might not have gotten you very far. It’s what happened next that really made a difference.

As you can see, the divergence was pretty significant. Whereas the RSI on the renko chart declined from 96.36 to 77.79, the RSI reading in the candlestick chart covering the same period actually rose from 61.58 to 66.62. Yes, there was a divergence reading as illustrated by the red arrow in dashes, but even that didn’t signal as much of divergence as the RSI-renko figure.

A short position at the failure of the second green brick, or a break below the red brick following would have made for a clear short entry. Of course, you may have had to follow this in real time. But nevertheless, the short signal in the renko chart was quite clear.

The candlestick chart may have not given as clear a signal, as the candlestick equivalent of the renko chart above would have appeared like the chart below.

The topping action might have given something of an indication, but the stronger confirmation took place upon a breakdown of the support level highlighted by the red line. Whereas the candlestick downtrend confirmation would have still given you a clear indication upon a violation of support, the renko chart would have prompted you to take a position before that point–somewhere within the price range in the orange box.
Another ticker convergence took place between May 13 and June 2, 2019, when the RSI reading rose from 15.68 to 18.49 while YM prices declined sharply.

If you are a strict technical trader, the opening stage of this rally might have taken you by surprise. But it shouldn’t have. It had everything to do with a statement made by Federal Reserve Chair Jerome Powell hinting that the Fed may be open to slashing interest rates to mitigate the likelihood of a recession. And in light of the G20 summit hopes, a potential resolution to the US-China trade war–you might have anticipated this (not so) unexpected move had you been following the news and the fundamentals.
So in light of these developments (plus the RSI divergence, an entry point in the first two bricks (as shown below) would have served you well.

In the candlestick chart, such an entry would have been right near the open, justifiably, a breakout of the previous candle’s high. If you would have taken this trade anyway, the renko chart might have served as an additional means of confirmation, as the green brick clearly signals a change in trend.

Strategy 2 – Three-Consecutive Bars
Since the color of each brick represents a directional bias based on the fulfillment of a fixed price increment, then what if we were to take the bricks at face value and trade in the direction of the current bias after three consecutive bricks (confirming the likelihood that price might continue moving in a given direction)?
Since renko charts don’t chart the highs and lows, it might make sense to use this in combination with a candlestick or bar chart to plot your stop loss.
If you were to reference this chart with a candlestick, you would be presented with the following scenario:

Trades [1] and [3] might have pre-empted the price swing, with the first trade going short on an up candle and the third trade signaling a short before the big drop. Trade [5] might have ended up with a small loss, and trade six (reflecting the current price action at the time of writing) is pending confirmation on a reversal.
Note that the current reversal (July 5) is the market’s response to positive jobs report data, meaning, the Fed may not cut rates in the near future. This kind of sudden and fundamentally-driven reversal is similar to what happened on trade [4], where Jerome Powell announced the likelihood of the Fed cutting interest rates.
On the chart above, the red lines represent where stop losses might have been placed if you were following a three consecutive bar renko strategy. It makes sense to place stops at market highs and lows. And although such a strategy might produce some whipsaws, the lag that renkos naturally present (as it concerns closing prices) may be a way to get in position after confirmation while still allowing you to enter positions before the big move (as in trades 1 and 3).
In either case, candlesticks may provide a more “tactical” scenario for the more generalized ‘strategic’ outlook presented in the renko chart. But whichever strategy you decide to you use, be sure to study the correlation of both charts to determine a setup that works for your own personalized approach.
Stoploss Disclaimer: The placement of contingent orders by you or broker, or trading advisor, such as a “stop-loss” or “stop-limit” order, will not necessarily limit your losses to the intended amounts, since market conditions may make it impossible to execute such orders.
Appendix – What Are Renko Charts and How Do They Work?
Understanding Box Sizes or “Bricks”
Imagine the following price scenario: an asset opens at the price of $10.00, hits a low of $8.00, breaks as high as $11.75, and closes at $10.50.

A candlestick chart, which details the open, high, low, and close would represent the price movements in this manner:

Note the opening and closing prices in the body, and the upper and lower wicks denoting the highs and lows.
A renko chart would represent things much more minimally.
First, note the following:
- Renko charts use fixed “box” sizes based on an increment of the price (say, $0.50 increments) or Average True Range (say, the 14-day ATR has a block size of $33.50).
- You can select your box size of choice.
- A new box or “brick” will appear diagonally next to the preceding box only when price closes above (or below) the full price increment of the box.
- A bullish brick (price moves up) is typically color-coded green.
- A bearish brick (price moves down) is typically color-coded red.
- Time is not represented in a Renko chart, only price.
So in a Renko chart with an $0.50 box size, the charts above would appear like this:

Note that the renko brick shows the opening price to be at $10.00. The highs and lows are not present in the chart.
But if the asset closed at $10.75, why is it showing a closing price of $10.50 ? The answer is that the box size has been set to $0.50 increments. If price closed at $10.49, then there would be no brick. If price closes anywhere between $10.50 and $10.99, then there would only be the one brick shown above.
Now, if price closed at or above $11.00, then you would see this:

And let’s suppose that price really skyrocketed and closed at $12.30. This is what the chart would like:

Do you get it now? It’s about closing prices at full 50-cent increments.
Understanding the Compression of Time Into Price
Take a look at the hypothetical line chart below representing the rise and fall of an asset’s price over a year’s duration. In January, the asset opened at 65.00, fell to 59.00 on April, it a high of around 78.00 in October, and fell back down to below 63.00 by November.

Now, let’s suppose you were interested in the broader strokes, more specifically, tracking this asset by box sizes of 5.00. If you set your box size in this manner, then your renko chart might appear similar to the one below.
Note that only the significant 5.00 movements are represented, occurring in April, August, September, and November– compressing an entire year’s worth of price action to four renko bricks .

There is a substantial risk of loss in futures trading. Past performance is not indicative of future results.