Key Futures Markets Weekly Roundup
S&P 500 Index
Last week the S&P 500 Emini futures market erased part of the losses booked the week prior as the sharp bounce just above the 2700 major round number allowed a retest of the 2800 support and resistance level.
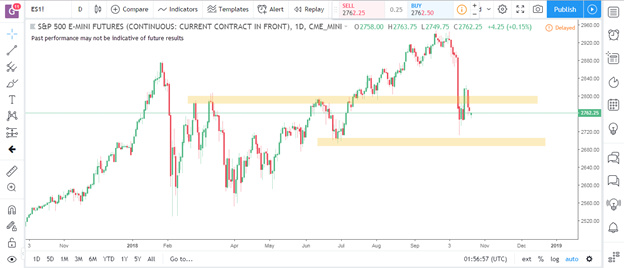
The recently closed quarterly earnings period for US corporates as well as strong American macroeconomic data continues to suggest more upside for the S&P500 index and the broader US equity sector.
We see last week’s rather volatile activity well in line with recent past trends for this market. We noticed similar volatile but sideways trading activity back in February and March when the index reported noticeable losses. Each time, we witnessed the market post a strong stretch of buy side activity. With the broader macroeconomic and fundamental catalysts still favoring more gains for this market, we see this current drop as likely another reason for more buying to enter the market going into the following few weeks.
While we are still eyeing the 3000 major round number as a mid-term target for this market we are aware of potential trouble areas in the vicinity specially the 2800 support and resistance level that buyers will need to press through to allow for higher price levels.
Light Crude Oil
Light crude oil futures market dropped under the $70 price level last week, with major oil producers globally continuing to post strong production numbers.
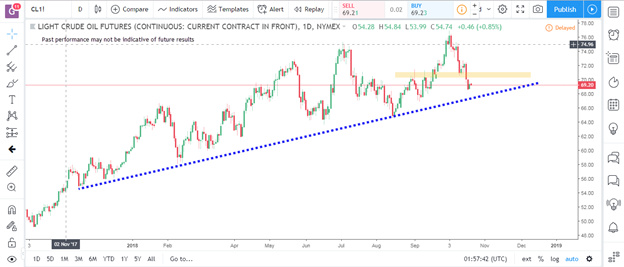
We see the drop under the $70 round number an encouraging sign for sellers and continue to back our initial perspective about this market that it may potentially be rounding up for an extended pullback into the long term up trend off of the crucial $74 and $75 long term support and resistance levels.
Going into this week, we have eyes set at a potential test of the support trend line (marked in blue in the chart above). Should the $70 level continue to provide resistance for buyers, we see lower price levels for this market specially if the support trend line gives way to sellers.
Gold
Futures market for Gold was majorly flat last week as the market sits tight between two important support and resistance levels.
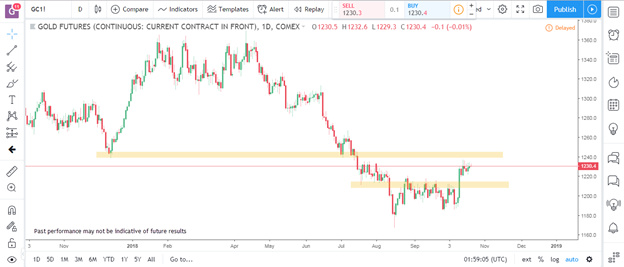
A knee jerk reaction from the earlier sell-off in the US equity sector likely sent Gold prices higher and past the more recent consolidation, but the move has pushed price closer towards the all-important 1240 former support level that may well provide resistance to buyers. Towards the bottom, we see price tightly restrained just above the 1210 mid-term support and resistance level likely pressing attempts from sellers to dominate the market.
We are expecting for this market to continue to consolidate until we see a confident break either past the 1240 level or down under the 1210 level which should essentially take price back into the consolidation phase – perhaps confirming the earlier move higher specifically just a knee jerk reaction due to the S&P500 market selloff.
Euro Futures
Euro currency futures market remains straddled around the $1.16 major support and resistance level that seems to be at the center of a recent notorious consolidation phase for the market.
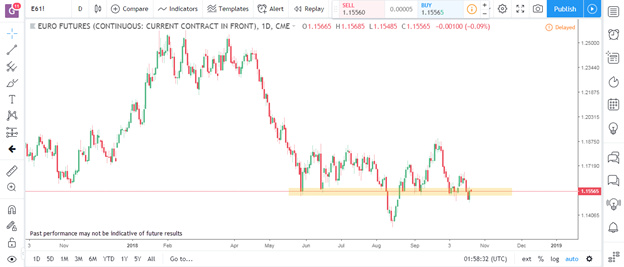
Last week, we did notice two strong days of selling for the market that took price under the $1.16 level although a late Friday rally pulled prices back up, closer towards the $1.16 level yet again.
Our earlier perspective for the market remains firmly in place: We do not expect the market to transition into the trending motion until we see either the buyers or the sellers take price further away from the $1.16 level.
10 Year US Bonds
The market for 10 year US treasury bonds last week posted disappointingly slow trading activity, although the market finding resistance at the 118.20 former support-turned resistance level could potentially be an encouraging sign for the continuation of the long term down trend.
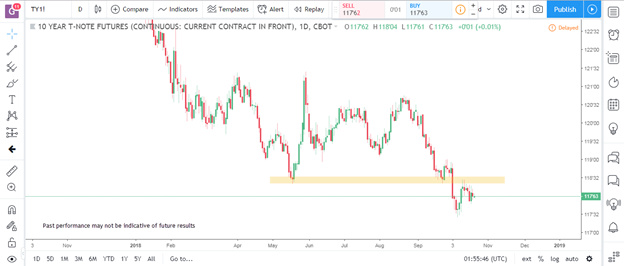
Despite the lack of interest from sellers last week, we have no reason to doubt the break under the 118.2 level, and we still favor the continuation of the long term downtrend as long as the 118.2 level continues to provide resistance to any buying that comes into the market.
While obviously trading lower than the prior recent consolidation phase, the lack of momentum could potentially indicate a prolonged period of sideways trading activity. However, seeing lower lows, and former support levels turning into resistance levels (case in point: 118.2 level) we are still believers in more potential downside for this market going into this week.
For an in depth technical analysis of Key Commodity Markets for the week of October 22, 2018 highlighting the E-Mini, Crude Oil, Gold, Euro Futures and 10-Year US Bonds Futures Market please see the video below: