Market Profile, Volume Analysis, and Volume Profile AMA (Ask Me Anything)

@Ben_M our community expert on Market Flow will start an educational series on order flow.
He will post the first session shortly. Feel free to ask questions, interact with one another and add your own interpretations to order flow.

Matt Z
Optimus Futures

5 Likes

Just checked out a couple of your YouTube videos, great trading and commentary! It looks like you’re functioning as a manual market maker. I have a few questions in no particular order:

  1. The tick-to-commission ratio isn’t particularly good in the ES (compared to something like ZB for instance), but you’re still willing to take some trades off at 1-2 ticks which means that you’d likely have to maintain a very high win rate and comparatively small losses. I noticed that you don’t use a hard stop, how do you protect against sudden fast moves against your position which could make it harder to stay within those parameters? I’m guessing you typically intend on going for a point or more but will you go into a trade planning to only get 1-2 ticks?
  2. The video that I watched you trade in (2/12/21) had a relatively slow market. If the pace of the market is faster and the price action is more volatile do you still trade in this manner or do you wait for things to calm down again so that there’s sufficient time to read the order flow? If you do trade in all market conditions, do you size down and use wider stops and targets?
  3. How do you decide which positions you’re willing to scale into to improve your average and which ones you choose to stay smaller on? Also, in some trades you put on 5 contracts and in others you sized up to 10. What is prompting you to alter your position size?
  4. If I remember correctly, there was a long position that you took just a few ticks above an unfinished auction on the low of a prior bar. Since those prices are often retested, how do you decide when you’re willing to get in before that potential test takes place?
  5. When watching order flow I tend to have a tipping point, so to speak, where I think the opposing side may be showing a bit too much strength where I’d want to exit before my planned stop. Sometimes though that can result in me exiting the position right at the worst point only to see it come back and the stop wouldn’t have been hit. For example, I might be long and I see a seller reloading, the bid drops away, sellers step down and stack and hold lower absorbing more buying, only to see them lift again and for the buyers to aggressively re-stack the bid and press their longs after I get out. Do you have any ways to prevent this from happening or is it just par for the course? I know there are times when the early exit has saved me some ticks so it may even out over the long run.

Thank you!

2 Likes

Thanks @Mod-MattZ!

Looking forward to this thread. I’ll be adding things today and a short video showing an iceberg order.

First I’ll address @Trader with your questions.

  1. I’m usually in and out of the market quickly, unless the position is backed up my momentum in my direction. Many time I get in and out to get a feel for the market and while many times I take a few tick gain and loss, I’m mentally prepared to let it go longer if there is solid continuation. Those trades are the ones that mitigate the scratches or small wins regarding commissions.
  2. The trade can vary so much from day to day that I need to be able to trade in many conditions. Sometimes it’s a choppy range or trending. Typically what I find is that if I can adjust my approach and outlook on the market and notice what it’s doing, I don’t mind slow or fast, as long as I’m aware of how the market is trading.
  3. This one really depends on volume, how it’s trading for the day and what my overall idea is for direction. However, I don’t typically like to make a habit of this.
  4. I like this question! I like to be in the market ahead of the move, so if I’m buying on the low end of the range either I’m going to cover at the top of the range or hold off If I see buyers coming in. Again all varies on the trade.
  5. Yeah this is a hard one for sure. I’d say watching order flow and making the best decision possible for your risk or methods. The big thing here is asking what impact a win or a loss will have on your mental state. Sometimes I need a few wins to get my confidence going so I’ll take the win and at that point, I HAVE to not worry about the market does after. It’s easy to say I could or should have, but focusing on what you actually did and your execution is the most important.
2 Likes

This thread is going to start from the very basics and continue to more in depth strategies and methods to utilize order flow the best we possibly can.

Starting Terms

Bid - Limit order to buy a specified number of contracts at a particular price.
Offer - Limit order to sell a specified number of contracts at a particular price.
Inside Market - The highest bid and lowest offer within the market.

Market Order - An order to buy or sell at the closest offer (market buy) or bid (market sell).

Market Buy:

This order would execute at 3,825.50 and reduce the current bid of 20 contracts down to 10. There are 20 contracts offered (limit sell order) at that price.

Market Sell:

This order would sell 10 contracts at 3,836.50 and leave 3 contracts left on the bid (13 - 10 = 3).

No matter how far “off” the market the order is placed it will always take the highest bid amount.

Rule of Thumb - Limit Orders (bids and offers) make the market while Market Orders move the market.

There is a substantial risk of loss in futures trading. Past performance is not indicative of future results. The figures here represent an opinion. The placement of contingent orders by you or broker, or trading advisor, such as a “stop-loss” or “stop-limit” order, will not necessarily limit your losses to the intended amounts, since market conditions may make it impossible to execute such orders. Please conduct your own due diligence if Futures are an appropriate instrument for you.

3 Likes

Iceberg Orders or Reloading

Here’s a video showing an iceberg order in the ES Mini.

There is a substantial risk of loss in futures trading. Past performance is not indicative of future results. The figures here represent an opinion. The placement of contingent orders by you or broker, or trading advisor, such as a “stop-loss” or “stop-limit” order, will not necessarily limit your losses to the intended amounts, since market conditions may make it impossible to execute such orders. Please conduct your own due diligence if Futures are an appropriate instrument for you.

1 Like

How to Identify Potential Breakouts

This question came up in a webinar about how to identify which way the market could move on a breakout from a range.

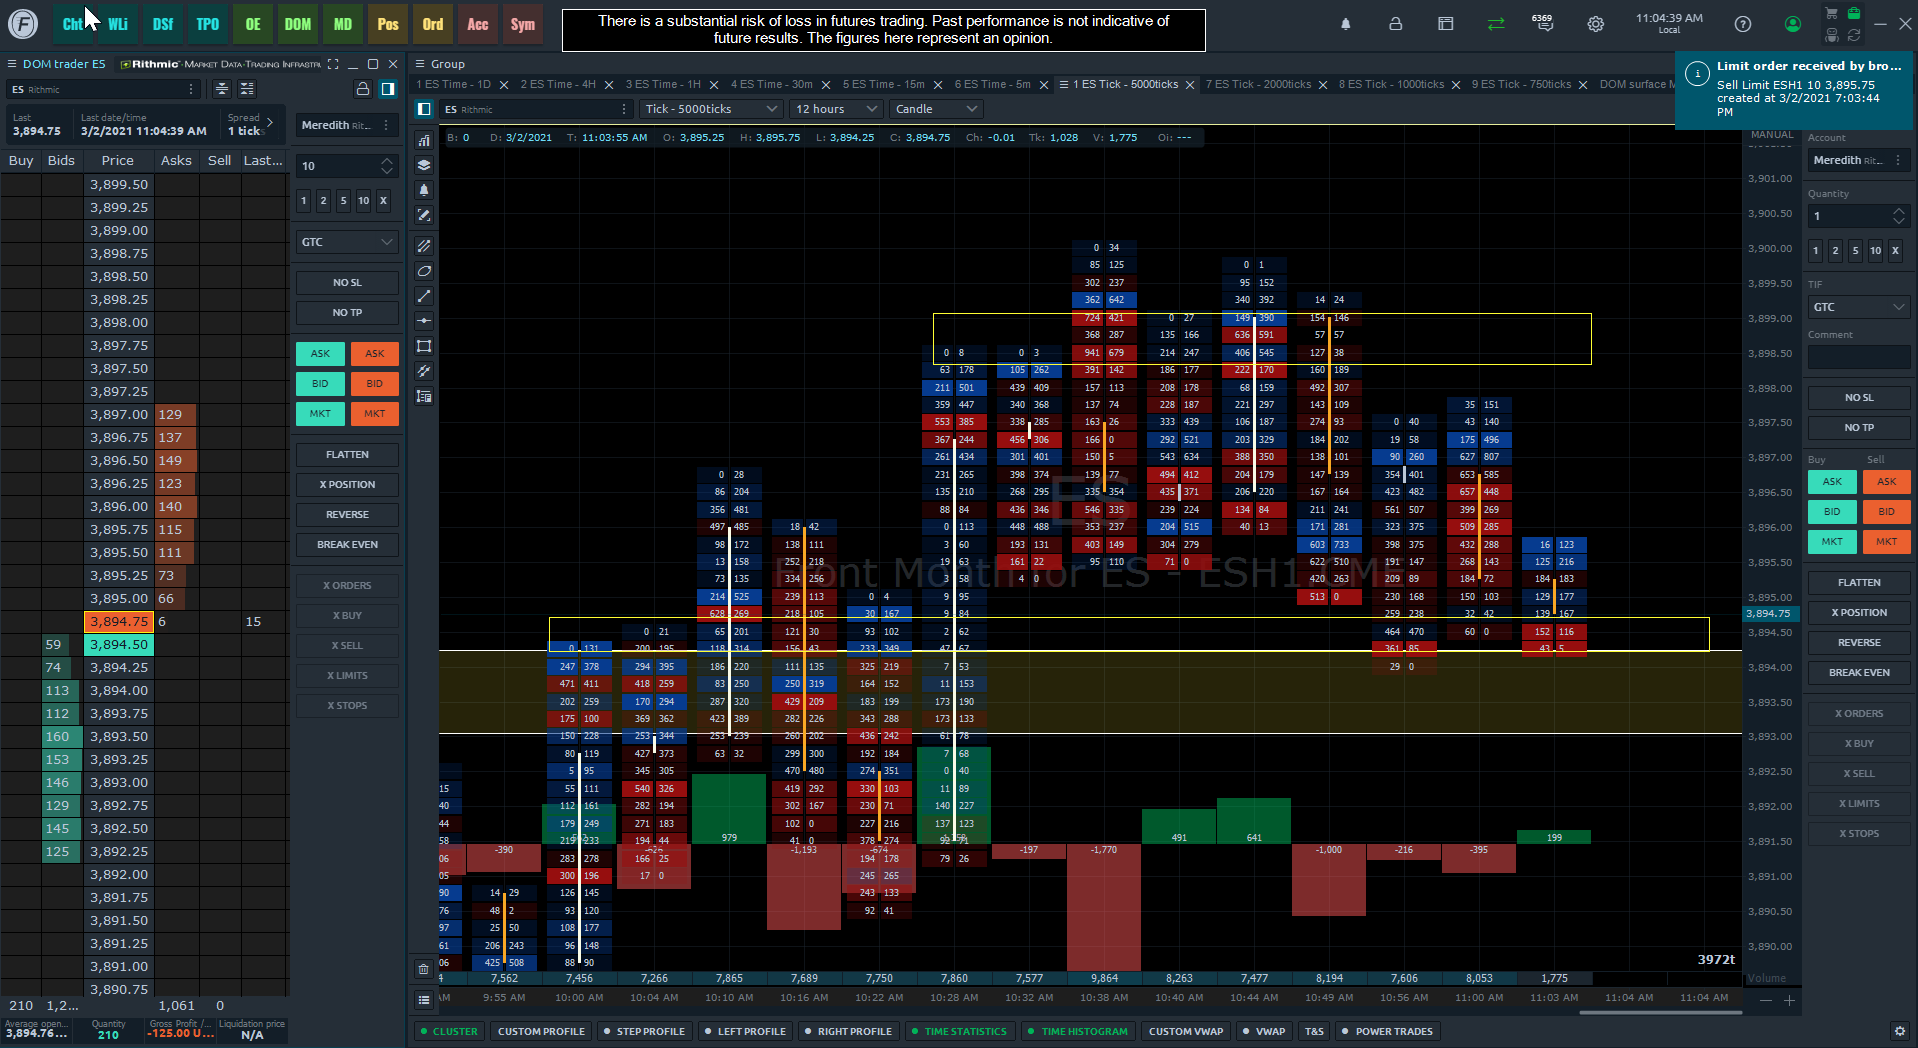
Keep in mind this is a demo account.

While we can’t know for sure, there are things to look for to potentially improve the probability of knowing.

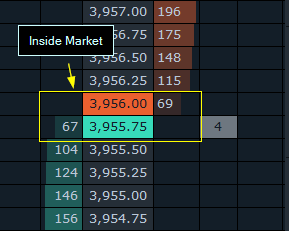
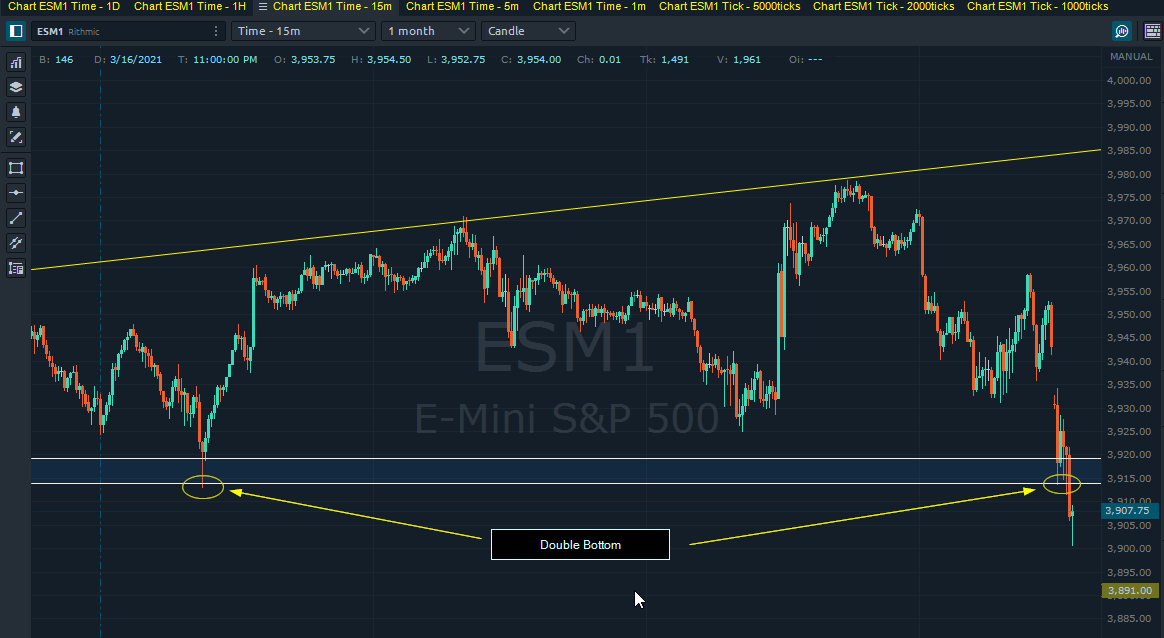
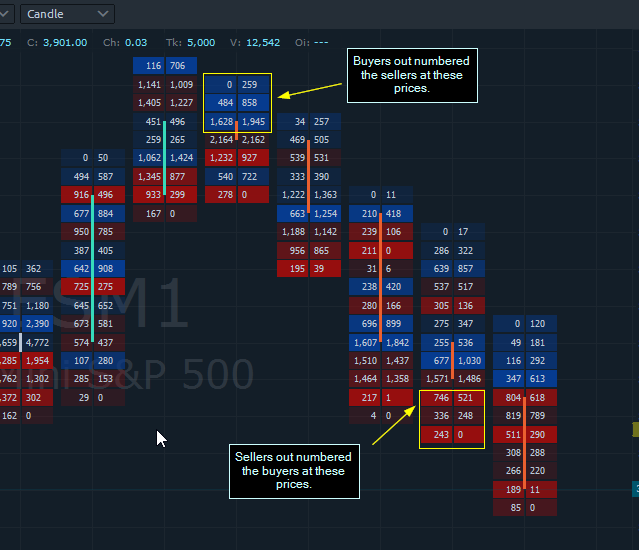
During a range, there are buyers and sellers that will be taking short and long-term positions. We want to be able to see how the orders are coming into the market, the velocity and direction of them as well.

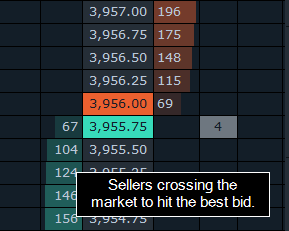
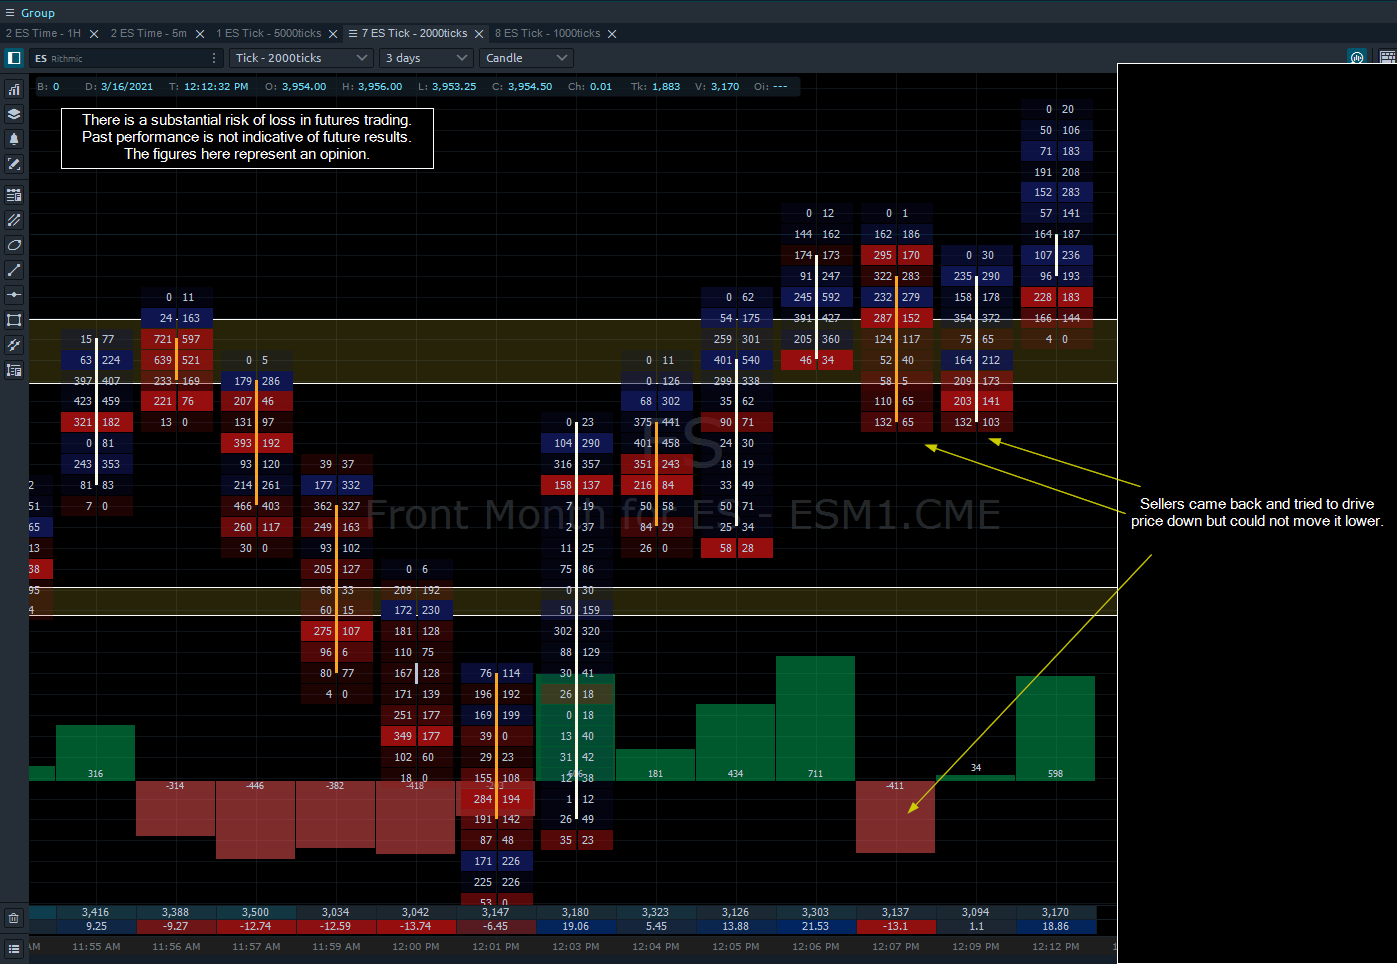
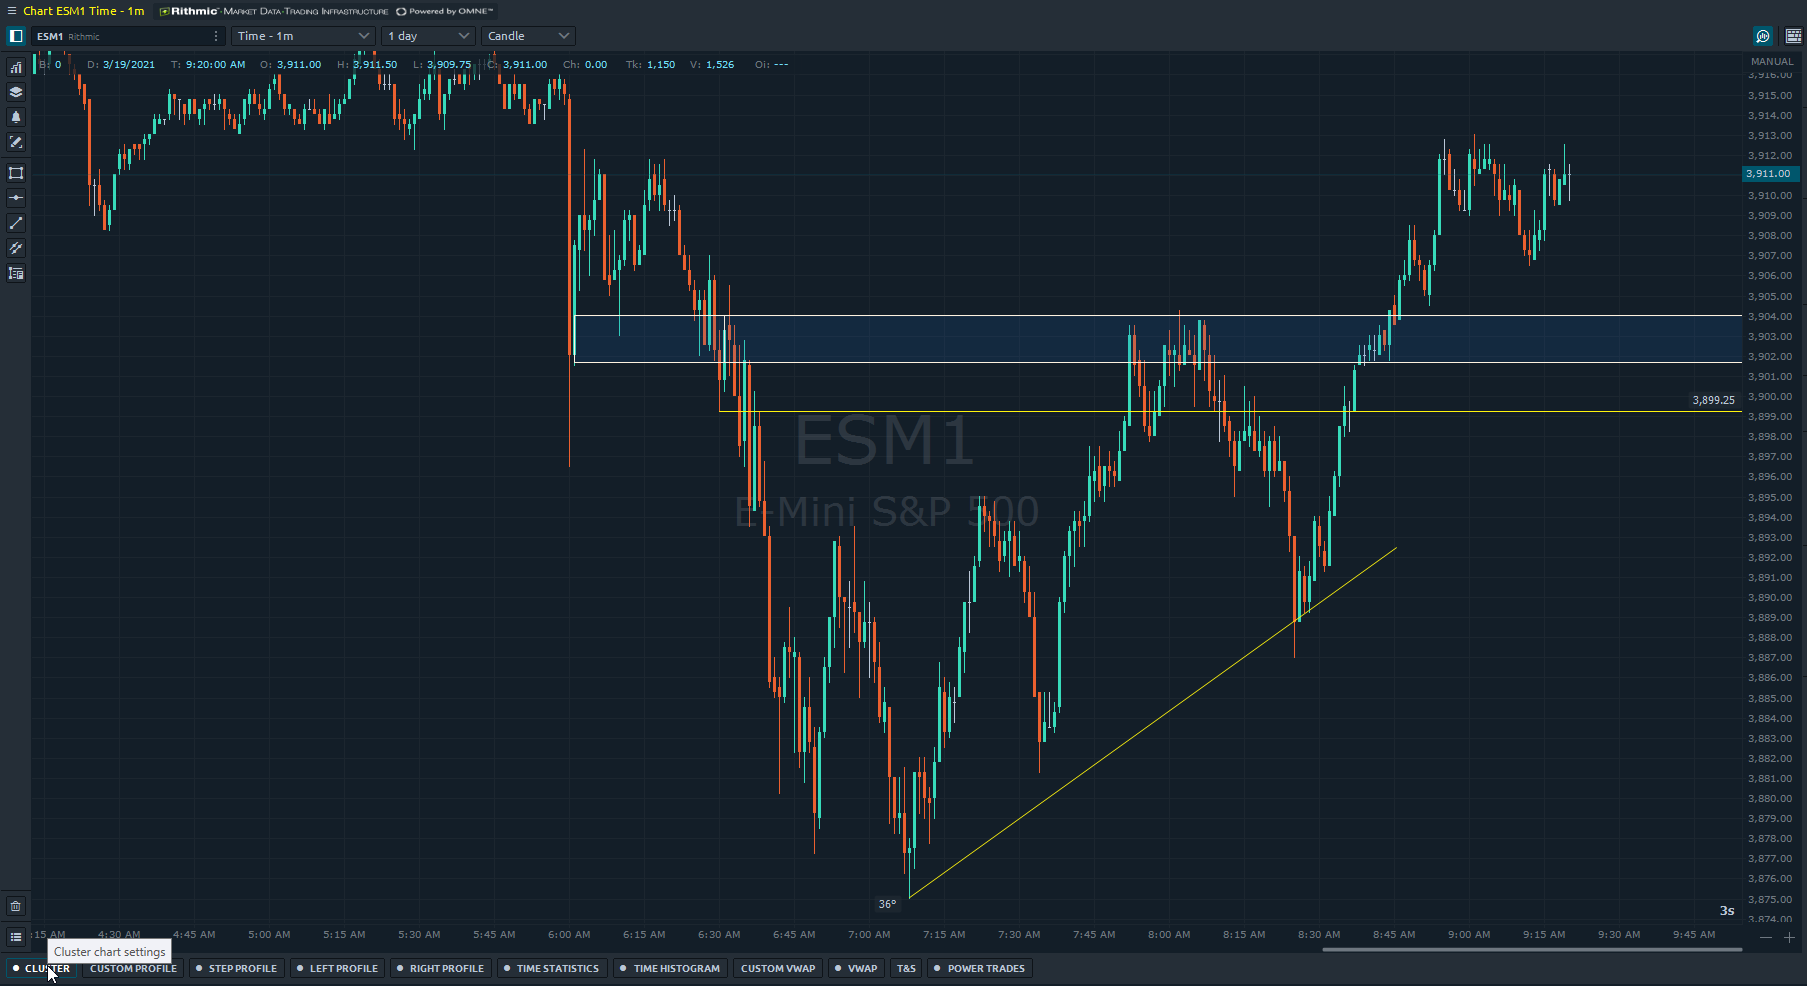
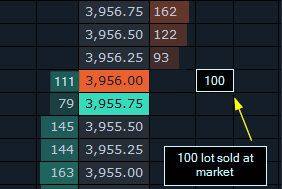
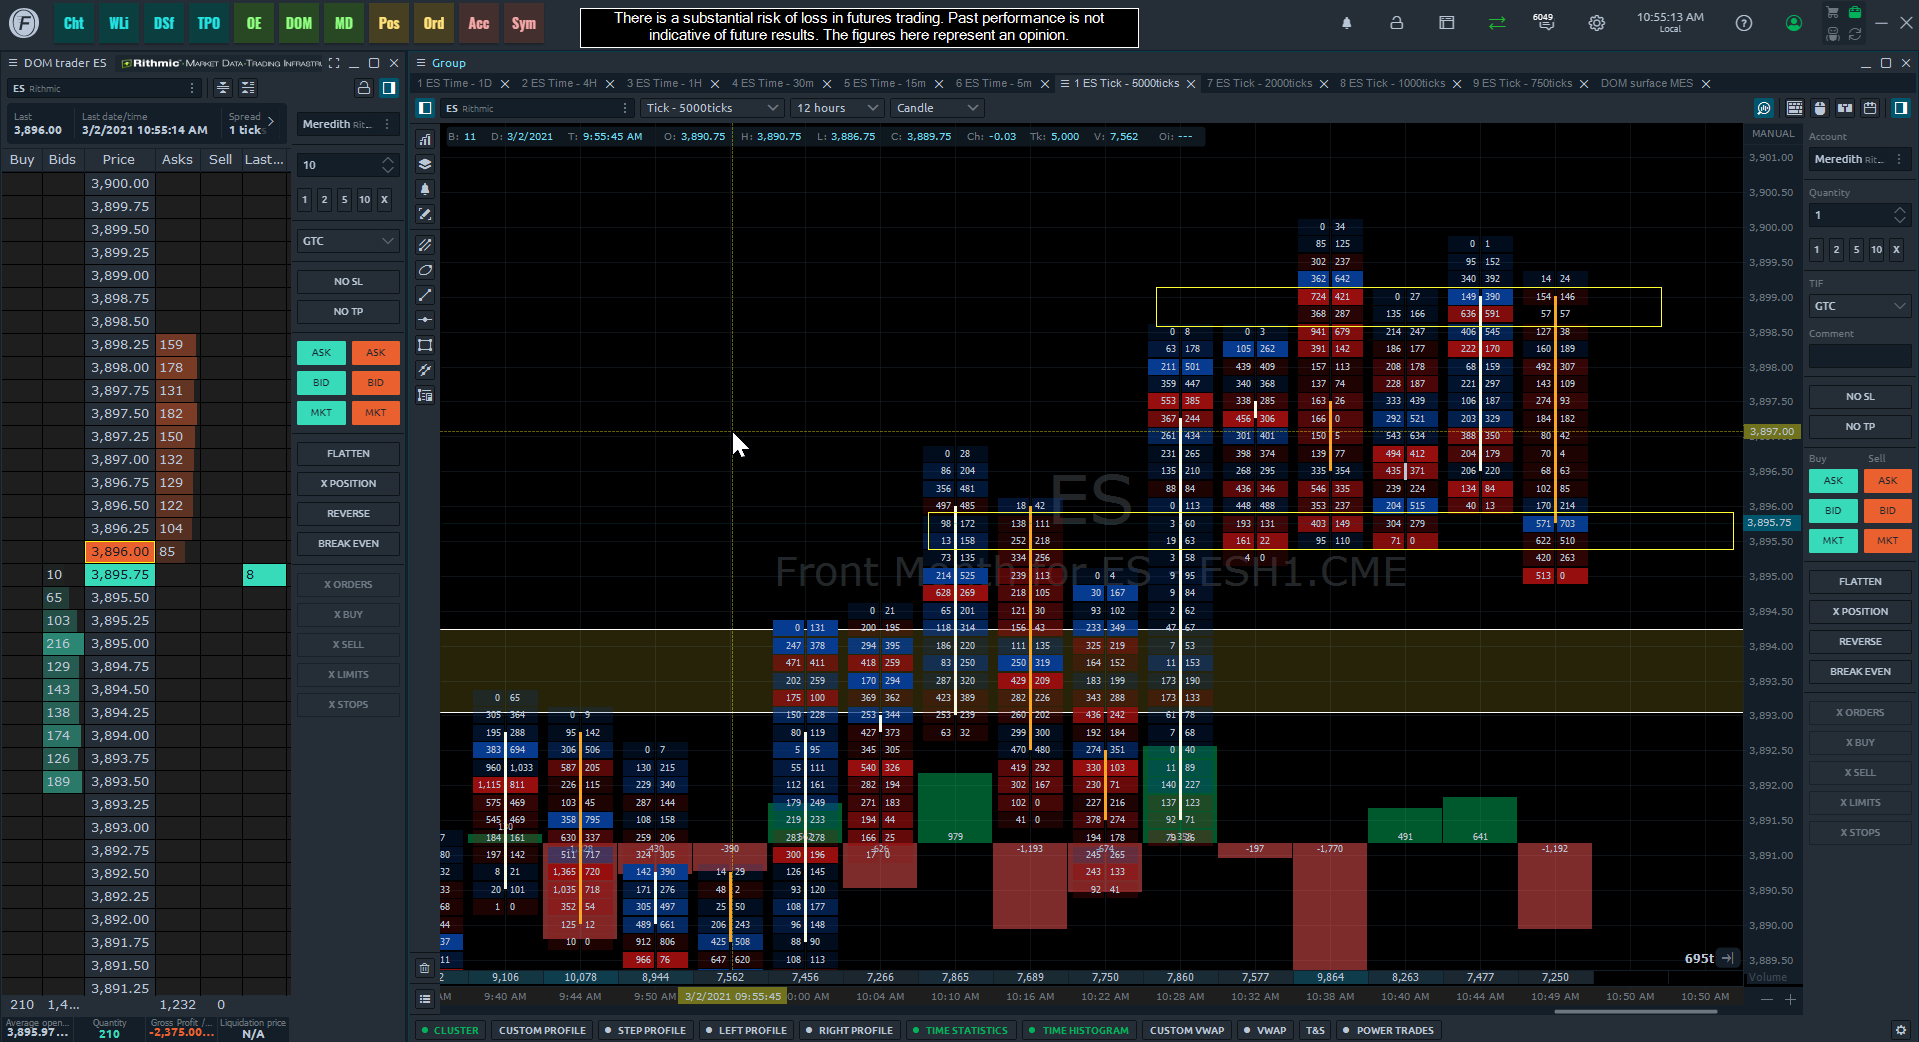
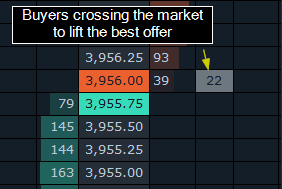
This way we can get an idea of where the bias is and how influential it may be. Let’s look at a Footprint chart of a range:

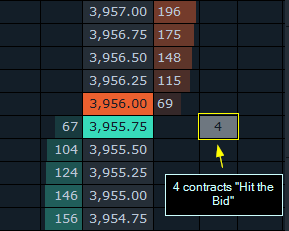
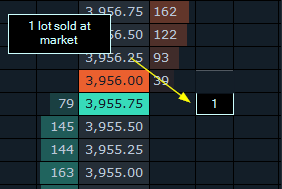
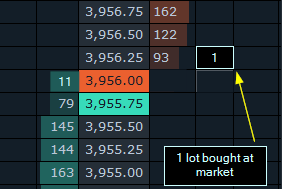
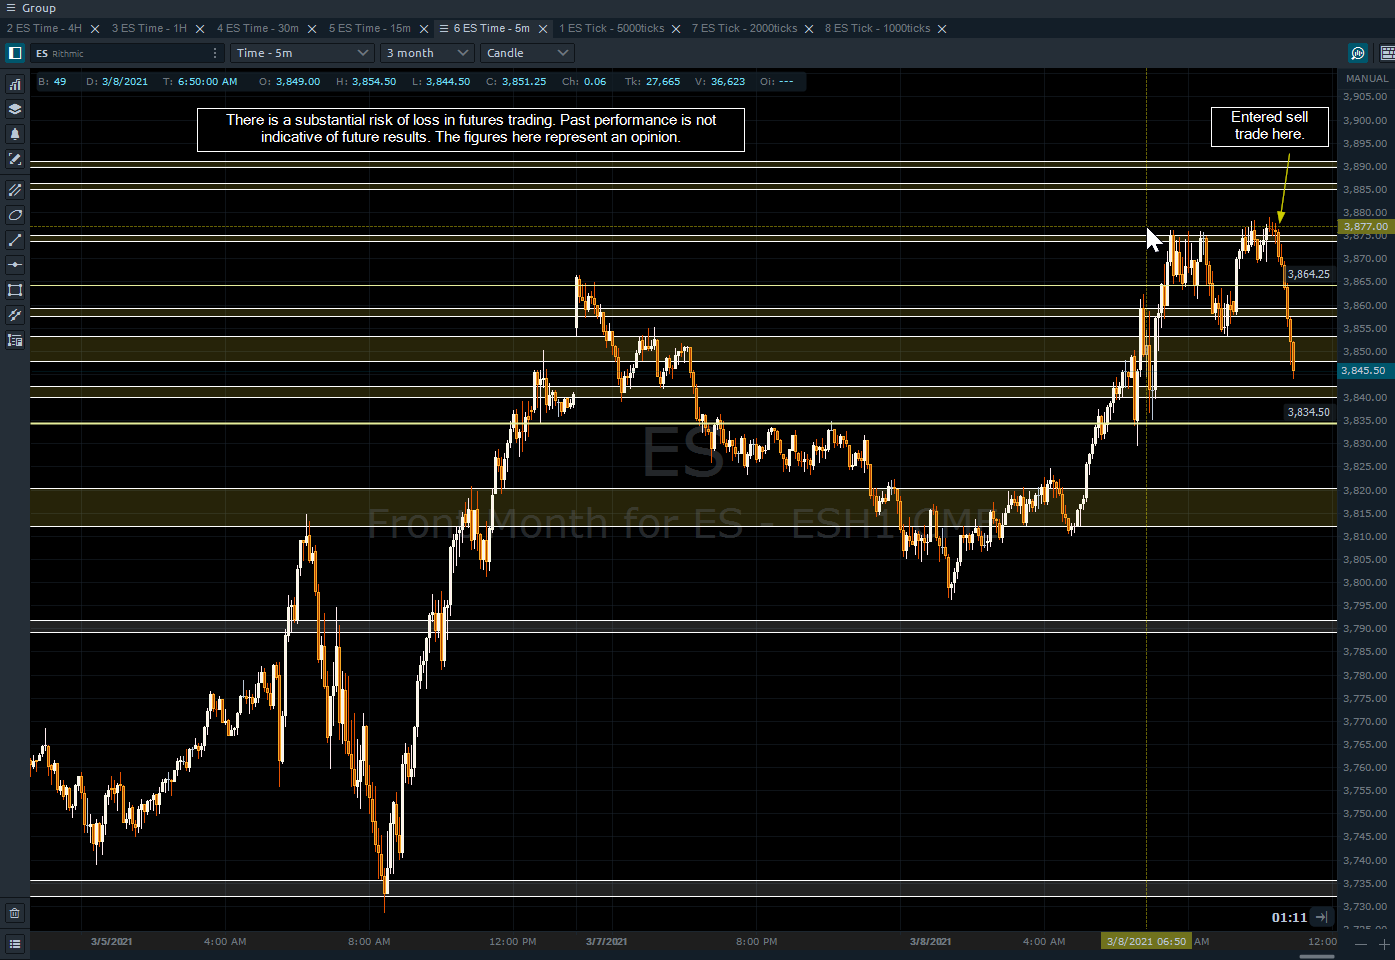
In this scenario I got long when I saw a swarm of buyers come in, I verified this with the Footprint chart with the strong shades of blue at the top of the range.

What would a buyer want to see in order to confirm his idea? What would a seller want to see?

As mentioned, we cannot predict what will happen, however, we can use the information to validate or disprove our position.

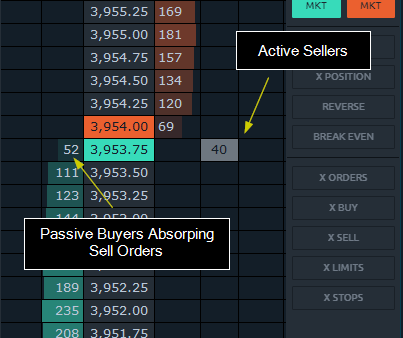
Since the market moves based on what the majority are doing (assuming that outweighs what the minority are doing), and they succeed, it’s hard to fade that move. In this case, I liked what I saw and the order flow confirmed there were more aggressive buyers than sellers. Furthermore, it was trading near the top of the range so previous tension in the market had the potential to force sellers to puke if price exceeded their risk.

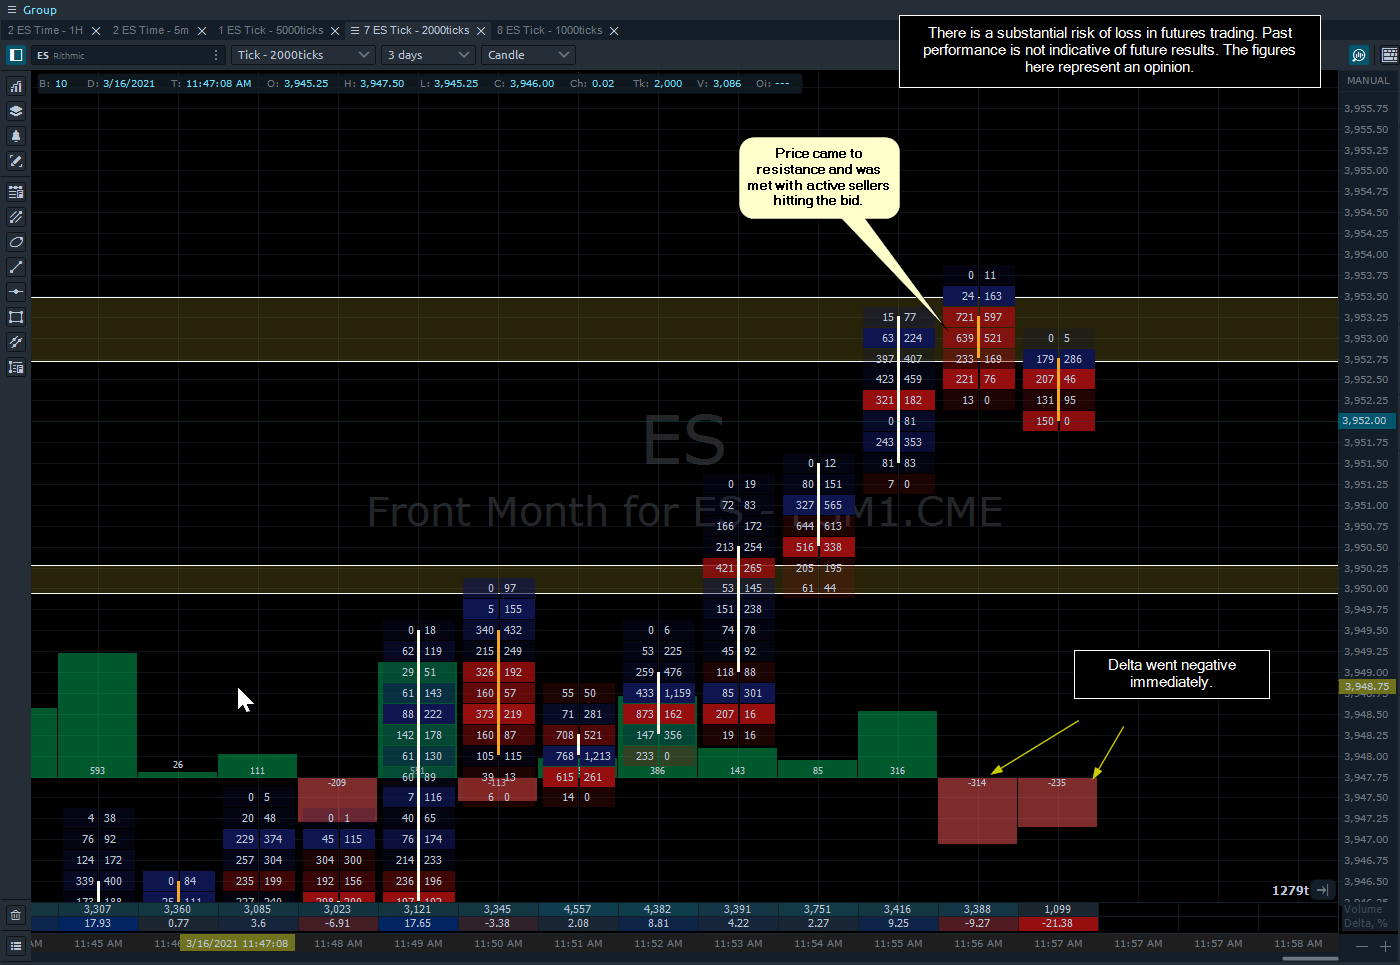
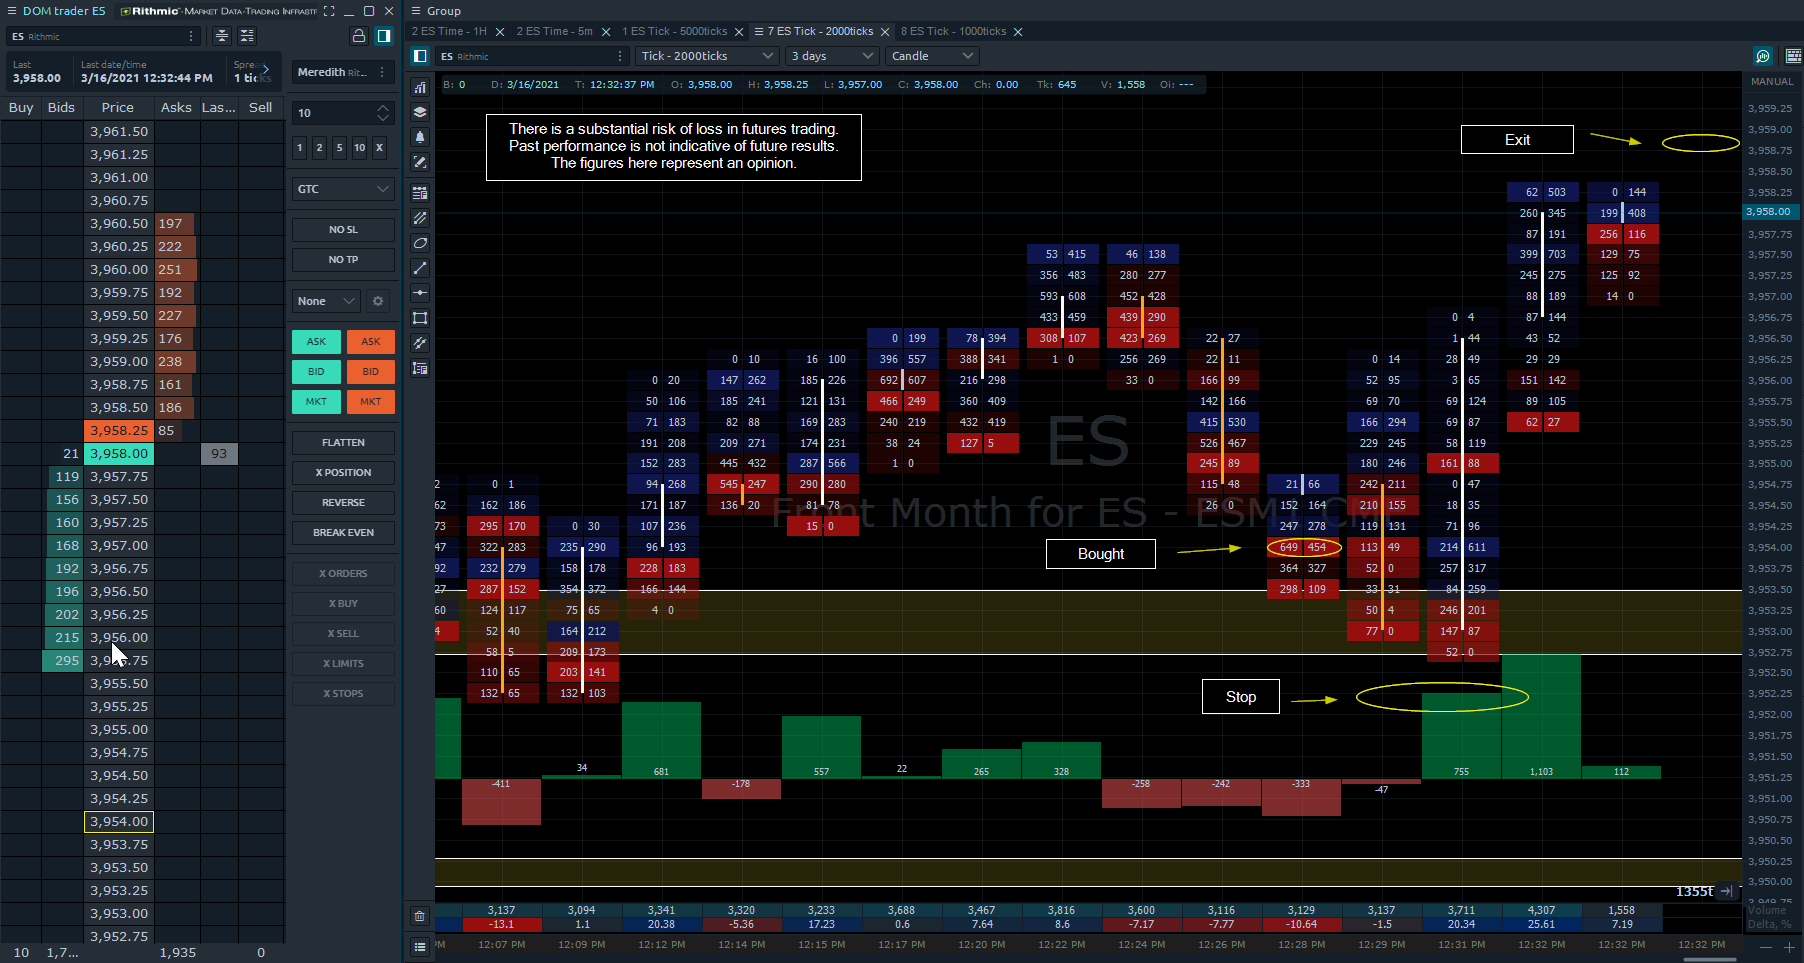
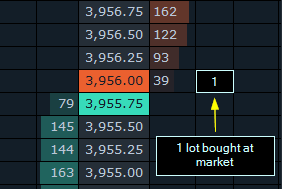
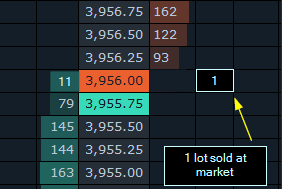
This is the next picture:

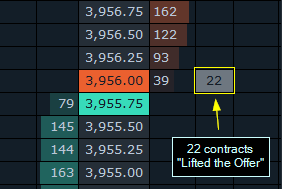
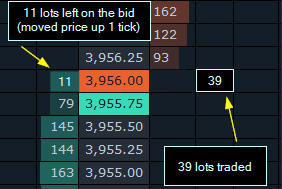
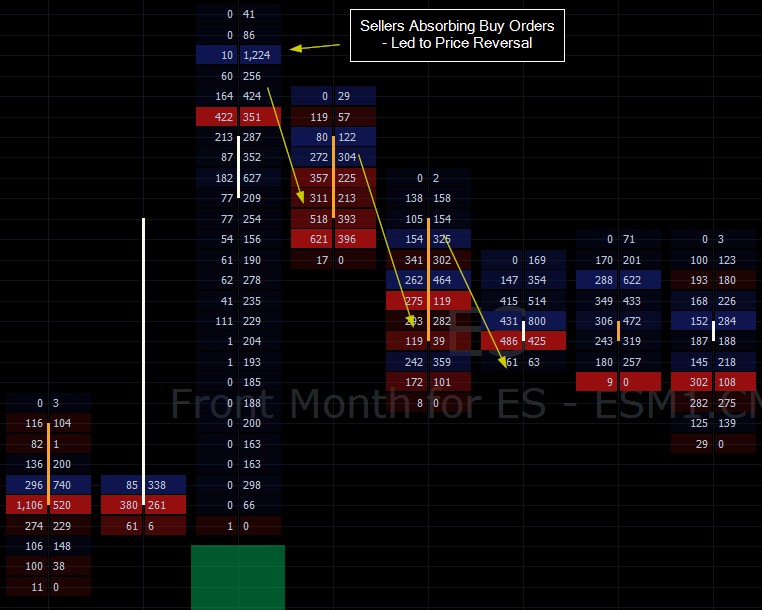
I included trapped sellers again, the reason being that assuming a portion of those contracts may be holding with their stop set above the range. They are trapped if price continues to move against them.

The big thing that changed is aggressive sellers came into the market turning the strong blue to neutral and even darker red in some areas. This bar also created a negative delta.

Not what I want to see as a buyer. What do you do?

So, what do we do as a buyer? The answer to that is it depends.

It depends on your strategy, your intention, and your original idea.

There is no right answer.

This has more importance than face value. For me, I had to exit. My idea was THIS was the breakout and I’m hopping on.

NOT that it would retest support. Only I know that. I could easily justify holding the trade by using strong support, or say there were still a lot of aggressive buyers.

But that isn’t true to my idea and that trade. If you don’t see happen what you thought would, it may not be the best trade if you hold it. For me, that’s when I get rolled over and it’s not fun.

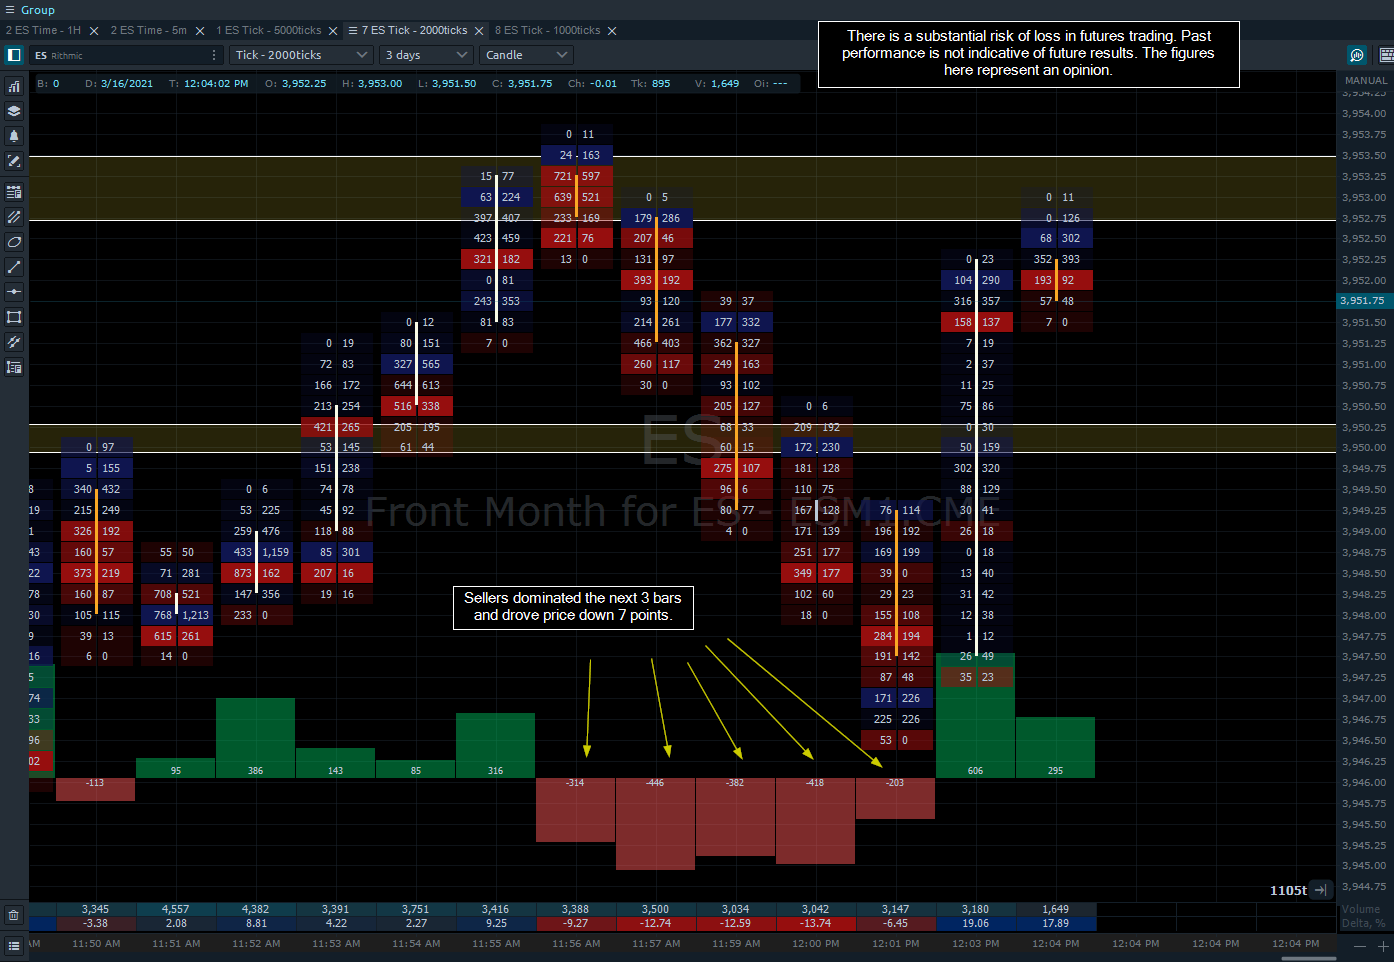
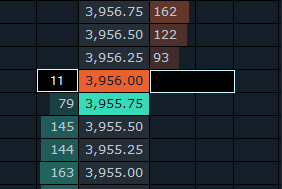
So, I exited and bought 96 evens.

Then, it didn’t develop and I partially exited and entered to move my average position to 94 three quarters.

After this, the market bounced a tad, then sold off and I scratched the trade.

There are two points to this:

1. The Footrpint chart shows us what most traders don’t see, live and historical order flow.

2. Your idea may very well be right, but it might only be “right” for a few seconds. The markets are ever-changing, and not adapting can create larger losses.

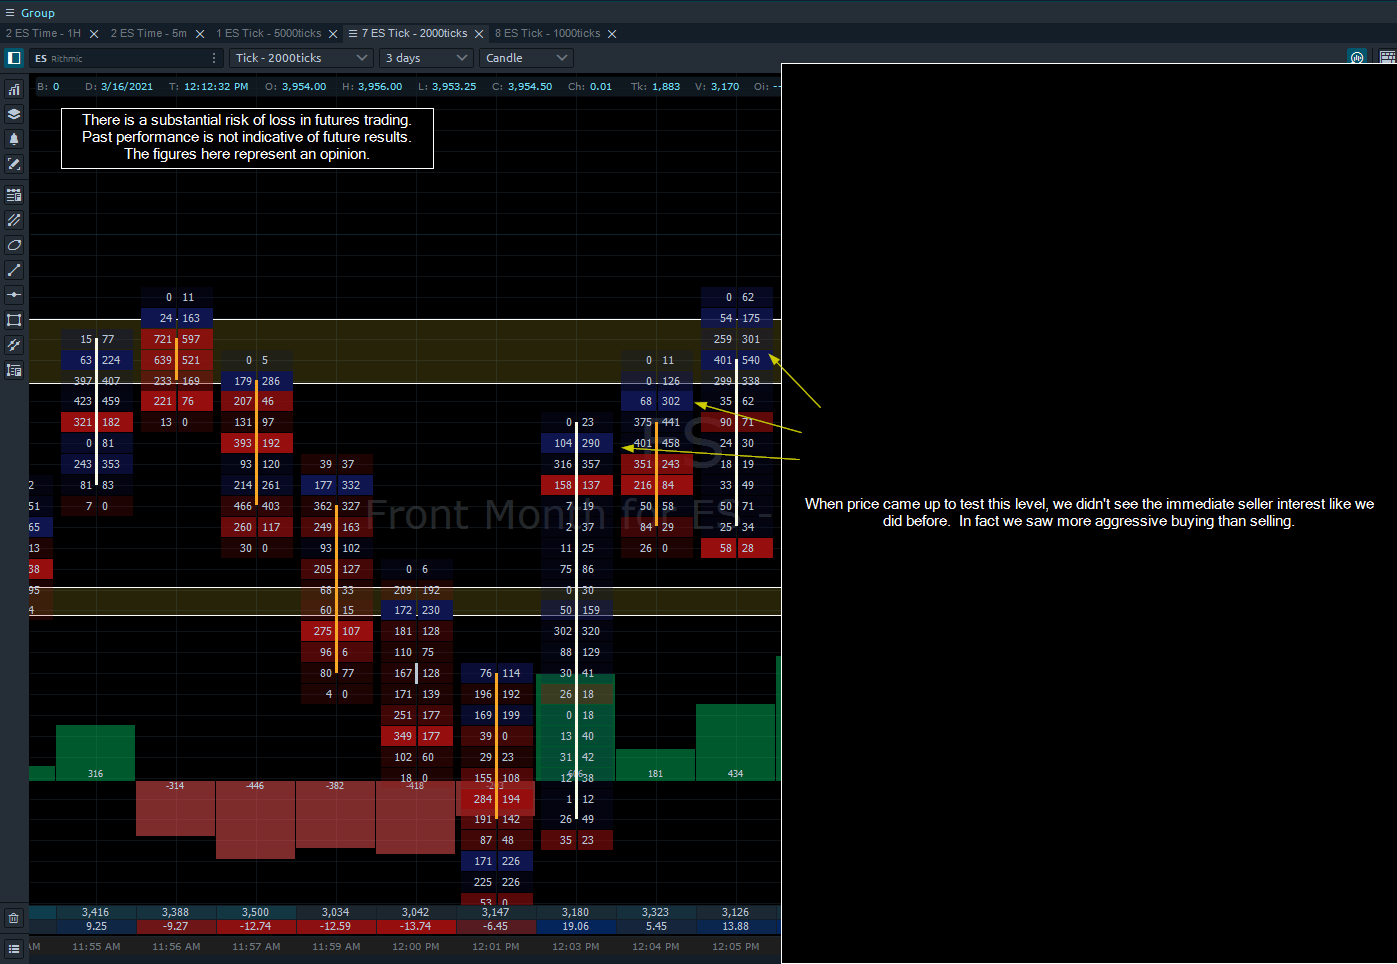
If you think about it, the Footprint chart is like a microscope into the market. No other chart can show us what the majority are doing. Not to mention, if that sentiment changes we can also identify that.

Let me know if you have any questions or any good additions to the Footprint chart that you typically watch!

There is a substantial risk of loss in futures trading. Past performance is not indicative of future results. The figures here represent an opinion. The placement of contingent orders by you or broker, or trading advisor, such as a “stop-loss” or “stop-limit” order, will not necessarily limit your losses to the intended amounts, since market conditions may make it impossible to execute such orders. Please conduct your own due diligence if Futures are an appropriate instrument for you.

2 Likes

Here’s a trade that was taken Monday, 3/8/2021 at 10:27 AM Pacific.

The chart shows resistance at equal highs.

Looking at the Footprint chart we can see that aggressive selling was happening at lower prices that continued through the range:

When price came up to the top of the range, the market didn’t entice buyers to lift offers at a higher prices. The interest was sellers despite the delta being relatively neutral.

There is a substantial risk of loss in futures trading. Past performance is not indicative of future results. The figures here represent an opinion. The placement of contingent orders by you or broker, or trading advisor, such as a “stop-loss” or “stop-limit” order, will not necessarily limit your losses to the intended amounts, since market conditions may make it impossible to execute such orders. Please conduct your own due diligence if Futures are an appropriate instrument for you.

Terms

Absorption - When aggressive market participants “Hit the Bid” or “Lift the Offer”, and are met with participants who “Absorb” those orders. The result is that price moves very little or not at all.

Absorption can often lead to short-term reversals when the original aggressive participants give up and close their positions.

image

Absorption Reversal - A long “Absorption Reversal” occurs when heavy selling occurs with market participants who “Hit the Bid” to try and move price below a key level. However, the sellers are met with “Passive Buyers” who “Absorb” all the selling pressure.

When the shorts give up and need to cover their position, a price move-up may occur.

A short “Absorption Reversal” occurs when the market experiences aggressive buying who “Lift the Offer” only to be met with passive sellers who “Absorb” the buying pressure.

When the long traders give up and cover their position, this may lead to a decrease in price.

Crossing the Market - For the market to move in any direction, traders must do what is known as “Crossing the Market”.

This means that buyers must take the “Best Offer” and be “Active Buyers” rather than waiting for the sellers to fill the buyer’s “Bid”.

image t

In order for price to move lower, sellers must “Cross the Market” and “Hit the Bid” as opposed to waiting for buyers to lift the seller’s “Offer”.

image

2 Likes

Market Reversal - Absorption and Aggressive Sellers

This is a live example with a short trade in real-time. When the market comes to certain levels or trendlines, we want to be open to what the market participants are doing and find any information we can use to validate our idea.

Sometimes that verification happens quickly, sometimes it happens over a long period of time requiring lots of patience and observing.

In the below example, we see price rising on the 5,000 tick chart:

As price came to the 3,953 area, we saw aggressive selling enter the market. This only says that there is heavy interest in selling that area, what price and participants do after that is unknown. But we are trying to tilt the odds in our favor.

Here’s what happened next:

If you were to take a short trade when you saw sellers stop price, it’s up to your style of trade and risk parameters to determine your target and time in the trade. Let’s assume you took 3 points out of that move, not bad!

We used relevant information (sellers interested in selling that area) to go with the herd and it worked. Price retraced as we can see back up to that exact level.

So, do we sell again? Would we buy this time? Well, let’s take a look at what the participants are doing now on this second retest.

This scenario isn’t as clear as the previous time price sold off from this area. It looks like there are more buyers now and they are willing to lift the higher offers.

Next bar:

Quite the contrast between the two moves. Sellers made an effort on this second retest but were overpowered by the buyers.

If we were short on this second move, we would have puked. However, by looking at the order flow we could have shifted our thinking and actually reversed to get on board with the buyers.

A reasonable idea would be to say the sellers are wrong, and let’s buy on a retest of this resistance turned support area:

During the webinar on Support & Resistance, we discussed the idea of price testing levels multiple times and asked if that makes that area stronger or weaker.

The answer is no, the only thing that makes an area strong or weak is the number of participants in the market at that time and whether they are buying or selling more than their counterparts.

There is a substantial risk of loss in futures trading. Past performance is not indicative of future results. The figures here represent an opinion. The placement of contingent orders by you or broker, or trading advisor, such as a “stop-loss” or “stop-limit” order, will not necessarily limit your losses to the intended amounts, since market conditions may make it impossible to execute such orders. Please conduct your own due diligence if Futures are an appropriate instrument for you.

Same Pattern

Right after the last post the same thing came up in the form of price testing support then sellers losing their position:

The only difference is that in this scenario sellers were actually dominating but could not push price down further.

Taking my own advice I bought on a retest, set my stop below the last low and exited 4.75 points up.

Finding one or two moves like this in a day is all you need, by using order flow to get on the right side of the market it tilted the odds in my favor.

Buyers and Sellers - What Really Moves the Market

Let’s start with what price is. When most traders get prices of a particular instrument, it is typically the “Last Traded Price”. This tells us the price that the last contract was bought or sold at.

When we look at the order book, there are actually two prices. The “Bid” and the “Offer”. As we have discussed, the bids are buyers who are willing to buy at specified prices and the offers are where sellers are willing to sell at specified prices.

image

The best bid (highest bid) and the best offer (lowest offer) is what make up the price of a market.

It is easy to say that when there are more buyers in the market than sellers, price will move up and vice versa. However, if the market has all buyers and no sellers, price won’t move since you cannot buy something that isn’t for sale.

Here is a picture of the Depth of Market (DOM) for the S&P e-mini futures contract. We can see that there are bids on the left side and offers on the right side. All the bids are “Buy Limit Orders” and the offers are “Sell Limit Orders”. The price is in the center and we can see that the best bid is 3955.75 for 67 contracts while the best offer is 3956.00 with 69 contracts.

image

These two prices are also known as the “Inside Market”.

All of the resting orders on this DOM are known as “Limit Orders”. They are passive buyers and sellers expressing their intent to buy and sell at certain prices.

These passive players in the market want to get involved at the best price they can. If the buyers think price will go up to 3960 overtime, they want to get a slightly better price than executing a market order.

If the sellers think price will go down to 3950, they want to also get the best price they can and not execute a market order, giving up a tick in the process.

The best best and offer are also known as the “Inside Market”.

image

All the limit orders we see here are placed by people who are willing to wait until the market reaches them to execute their order. If the price of the given instrument does not reach their price they will not trade.

A market order is considered to be aggressive, meaning that a participant is coming to the market and accepting the price buyers are willing to buy at and sellers willing to sell at.

In the same example, we see that 4 contracts were sold at 3955.75. This is known as “Hitting the Bid”.

image

Below is an example of a trade that “Lifts the Offer”, in this case 22 contracts were purchased at 3956.00.

image

In both cases, hitting the bid and lifting the offer, the orders are referred to “Market Orders”.

The last diagram has 39 contracts offered at 3956.00. If a buyer were to come in and purchase 50 contracts at 3956.00, they would have 39 contracts filled and be left with 11 contracts as a limit order bid.

image

Now, referring back to the idea that there are two prices in the market. This 50 contract order would move the market up one tick, the bid is now 3956.00 and the offer is 3956.25. The last traded price would be 3956.00.

The market moved as a result of the aggressive buyer taking all the contracts at 3956.00. Even though there were the same amount of buyers and sellers, the market moved up.

This is what we will dive deeper into when referring to Order Flow and also Footprint charts, the buying and selling imbalance that moves the market.

There is a substantial risk of loss in futures trading. Past performance is not indicative of future results. The figures here represent an opinion. The placement of contingent orders by you or broker, or trading advisor, such as a “stop-loss” or “stop-limit” order, will not necessarily limit your losses to the intended amounts, since market conditions may make it impossible to execute such orders. Please conduct your own due diligence if Futures are an appropriate instrument for you.

1 Like

How do we implement order flow with our strategy to:

  1. Validate our trading plan for the day.
  2. Perfect our entries.
  3. Perfect our exits.
  4. Be flexible and trade with the market rather than against it.

Get Your Mind Right

Whatever your strategy is, mental preparation determines how you perceive everything in the market. A small win can turn into bigger wins while a small loss can be devastating.

Meta-awareness - The ability to observe your thoughts, feelings, sensations and impulses as they are happening. The process of waking up to what’s going on with us, with our thoughts, feelings, body sensations and impulses.

The biggest factors in our decision making

  1. Bias or opinion.

  2. Personal needs or desires - why do we trade?

  3. Freedom - Time and financial.

  4. Rewarding.

What is the emotional response to a winning trade or a losing trade?

Our emotional response only affects us and our ability to make decisions. Those internal responses do not change the outcome of the market.

When we trade we have to be observant of our internal dialogue. What are we telling ourselves on a regular basis?

According to the National Science Foundation, an average person has about 12,000 to 60,000 thoughts per day. Of those, 80% are negative and 95% are repetitive thoughts.

If we repeat those negative thoughts, we think negatively way more than we think positive thoughts.

Develop Your Plan

Preparation is just as important as execution.

Pricing Inefficiencies

Individual participants can affect the short-term price movement, but the overall direction of the market will always be what it is.

Big players in the market can move prices in the direction they desire or hold prices with big size. However, they have risk parameters and emotions just like everyone else.

Pricing inefficiencies happen all the time in the market, whether it’s micro or macro. The question is how do we trade our strategy while taking advantage of these price movements.

My trading strategy is very short term, this means that if I see price move in a direction without trading back and forth and it feels very one-sided, I start asking if the market is overextended or if people will start covering.

The trade I make has to be within my overall strategy though.

Here’s an example from a trade today.

Why did I enter:

My plan was to look for dips to buy. Saw a double bottom:

Order flow supported my idea that sellers were drying up, however they gave one last push without being able to push price down.

This is not a clear-cut formula, there typically isn’t, and a lot of very intuitive and also a guess.

I believe that the smallest things in life can affect when a trade is made and for what reason.

A very important point here is identifying why I entered a trade, but furthermore, what I felt and thought when I made the trade and also during the trade.

  1. It’s easy to think that when a trade immediately goes in your favor and is also in line with your plan that you picked the bottom or the top.
  2. If I’m not aware of my internal dialogue or personal desires it can ruin a trade very quickly.

I would be lying if I didn’t, for just a brief moment, think that price could rally off this level and see a big move. But the market is always changing and adapting to that and saying “I’m wrong” is hard.

In this case I was actually wrong, price did not violate the downtrend and I had to exit. But because I focused on my execution and observed the information the market was giving me.

The feeling I had when sitting with this trade was not liking the idea that the highs were still falling. Therefore, I got out then sold the lows.

At that point I started to fear that it was forming a wedge and price would break out to the upside.

I observed that feeling then watched the market to allow it to tell ME what it was doing.

3 Likes

Thanks for going over the terms and showing how it is applied in real life.

Matt Z
Optimus Futures

1 Like

My Footprint Chart Setup

Here are the steps to perform in order to see the Footprint chart with Buy and Sell volume:

  1. Open any chart in Optimus Flow, for this example, I’ll be using the S&P ES Mini Futures.
  2. Click on “Time” and select “Tick”.

image

  1. We can start with 2,000. This simply means a new bar will form when 2,000 trades have occurred.

image

  1. Click on the Volume Analysis icon.

  1. In the bottom left click on “Cluster”.

  1. Click on “Double” for Data Type.

image

  1. I set mine to Buy Volume, Sell Volume and colored by Delta.

image

  1. After that you’ll be able to see each bar with the Buy and Sell Volume data.

You can further edit the settings by clicking on the gear icon:

image

Change the buy and sell data color to one of your choosing. (The opacity is set to 20% and I like to increase that to 100% to see it better).

That’s it! Let me know if you have any questions.

There is a substantial risk of loss in futures trading. Past performance is not indicative of future results. The figures here represent an opinion. The placement of contingent orders by you or broker, or trading advisor, such as a “stop-loss” or “stop-limit” order, will not necessarily limit your losses to the intended amounts, since market conditions may make it impossible to execute such orders. Please conduct your own due diligence if Futures are an appropriate instrument for you.

2 Likes

Why it’s Harder for me to Trade Overnight Session

This one may seem counterintuitive but I cannot personally trade (effectively that is) the overnight session very well.

This is because although the same ideas apply with order flow, it goes much slower and it is hard to see.

Think about riding a bike, if you go to slow it becomes very difficult. But when you start coasting you can balance easier and have a good handle on what is going on.

Orderflow is the same, you have to get in the rhythm of it and really feel it.

There is a substantial risk of loss in futures trading. Past performance is not indicative of future results. The figures here represent an opinion. The placement of contingent orders by you or broker, or trading advisor, such as a “stop-loss” or “stop-limit” order, will not necessarily limit your losses to the intended amounts, since market conditions may make it impossible to execute such orders. Please conduct your own due diligence if Futures are an appropriate instrument for you.

1 Like

What data can we see on the Cluster Chart?

On my Footprint chart (i.e. cluster chart), I have the data set to two types and I use the following parameters:

Data type 1 - Buy Volume
Data type 2 - Sell Volume

This is going to show the Market Orders that hit the bid or lift the offer.

The last thing I change is the coloring by Delta. I change the buy color to blue and the sell color to red.

This helps me better visualize the imbalance between buyers and sellers. The bars that are blue show that there were more active buyers than sellers at that price. Again, this is only market orders not the liquidity of what was on the bid or the offer (we will go over that soon referring to the Surface DOM).

There is a substantial risk of loss in futures trading. Past performance is not indicative of future results. The figures here represent an opinion. The placement of contingent orders by you or broker, or trading advisor, such as a “stop-loss” or “stop-limit” order, will not necessarily limit your losses to the intended amounts, since market conditions may make it impossible to execute such orders. Please conduct your own due diligence if Futures are an appropriate instrument for you.

1 Like

Hi Ben,

I specialise in writing algos based on order flow. From a technical perspective, I read this opposite to you.

Assuming each level represents one tick and assuming a one tick spread, I would classify the upper candle in your last picture to be “Sellers out numbered the buyers” within that yellow box.

At the extreme of the candle, 259 orders accepted the offer and 484 orders accepted the bid.
One price level below, 858 orders accepted the offer and 1628 orders accepted the bid.

I think you can enable this alternative way of analysing the market by selecting “Diagonal Bid/Ask Imbalance”.

1 Like

How do orders in the DOM print on the Footprint chart?

At first glance, the Footprint chart can be very confusing. There’s a lot of info there and when we can’t slow it down to understand how it is printing each number and why.

The way I have my Footprint chart set up is using two data types, buy volume and sell volume.

Let’s look at a one lot sold at market then bought at market and how that would print on the Footprint chart for ES Mini contracts.

Here’s the book with a 1 lot being bought at the market:

image

The Footprint would show this:

image

Now a 1 lot is sold at the market:

image

Then the Footprint chart would update and record 1 contract sold at the bid:

image

(disregard the color, they can be edited to your liking. I use blue as buy imbalance and red as sell imbalance.)

To speed this up, now we will buy a 50 lot at 3,956. There are 39 left (really should be 38 because we bought 1 from the 39 two pictures up) on the offer so when the 50 lot executes the book will now look like this:

image

The 50 lot buy took all of the 39 contracts for sale at 3,956.00 and there are 11 remaining.

The new data on the Footprint chart would look like this.

image

Remember it recorded 1 contract before, now the 39 traded at the offer so 39 + 1 = 40.

Next trade let’s buy a 1 lot at the market. Since the bid moved up one 1, now our trade will execute at the best offer available:

image

The new Footprint chart:

image

Now we have a new data point 1 tick higher showing the 1 lot that traded at 3,956.25.

One more for thoroughness, let’s sell 1 lot at the market:

image

(Again, I’m not changing the bid or offer amounts, just showing the contracts that came to market.

Now the Footprint chart:

image

So you can see the last contract that was sold at the market, this is the same price that the 40 contracts traded at on the buy-side. Again I have my settings as follows:

In this example, let us say that this chart is a 2000 tick chart. There won’t be a new bar formed until there have been 2000 trades.

That also means that price will move up and down while trading in this bar. Therefore, the bar with 40 contracts bought in the middle currently has an imbalance biased toward the buy-side.

40 contracts bought vs 1 contract sold. The delta would be a positive 39 (40-1).

It could very quickly change though. Assume someone came in to bid 100 contracts and that was immediately taken by an aggressive seller with 100 contracts sold:

image

Remember the 100 lot bid would be added on top of the 11 contracts already there, making it 111. When the 100 market sell shows up on the right (this column is also “Last Traded Size”), to be accurate it would reduce the bid by 100 leaving only 11 contracts again on the bid.

The new Footprint chart would look like this:

image

Now the middle bar would have a negative delta of 40 - 101 = -61, meaning that 61 more contracts hit the bid at that price than contracts lifting the offer.

Rather than start to think about strategy, just observe the information the market is giving you. It’s like watching the order flow on the DOM and seeing all the orders come in and noticing lots of frantic buying with some larger orders in there, this gives you the ability to confirm or deny what you may be seeing and then formulate a plan from it.

There is a substantial risk of loss in futures trading. Past performance is not indicative of future results. The figures here represent an opinion. The placement of contingent orders by you or broker, or trading advisor, such as a “stop-loss” or “stop-limit” order, will not necessarily limit your losses to the intended amounts, since market conditions may make it impossible to execute such orders. Please conduct your own due diligence if Futures are an appropriate instrument for you.

1 Like

Hi @autobahn that is pretty cool, I’m currently loading my charts to check for that feature.

I like that perspective though and I’m curious to know if that is how you develop your algorithmic trading strategies?

Also, by looking at it like that does it significantly change your bias towards imbalance in the es mini or micro es mini, nasdaq, etc?

For algo trading, I’ve always been very intrigued by this. When I traded in Chicago black box trading was coming onto the scene as the new edge. The firms that grasped this quickly crushed it, literally dwarfing the old prop shops that relied on spread and the market trading back and forth as their edge.

How and where do you code your algos? What kind of strategies are you testing and using, obviously the ones that you can share.

2 Likes

How do the Micro es mini, nasdaq and russel trade?

When I used to trade full time there were no micro futures contracts.

I’m curious to know how everyone likes trading those markets and if there is any “edge” per say in terms of latency between the two contracts, volume, scaling, etc?

It seems that if you are able to trade a 10 lot in es mini that you could trade 100 lot in the micros?

1 Like