Market Profile, Volume Analysis, and Volume Profile AMA (Ask Me Anything)

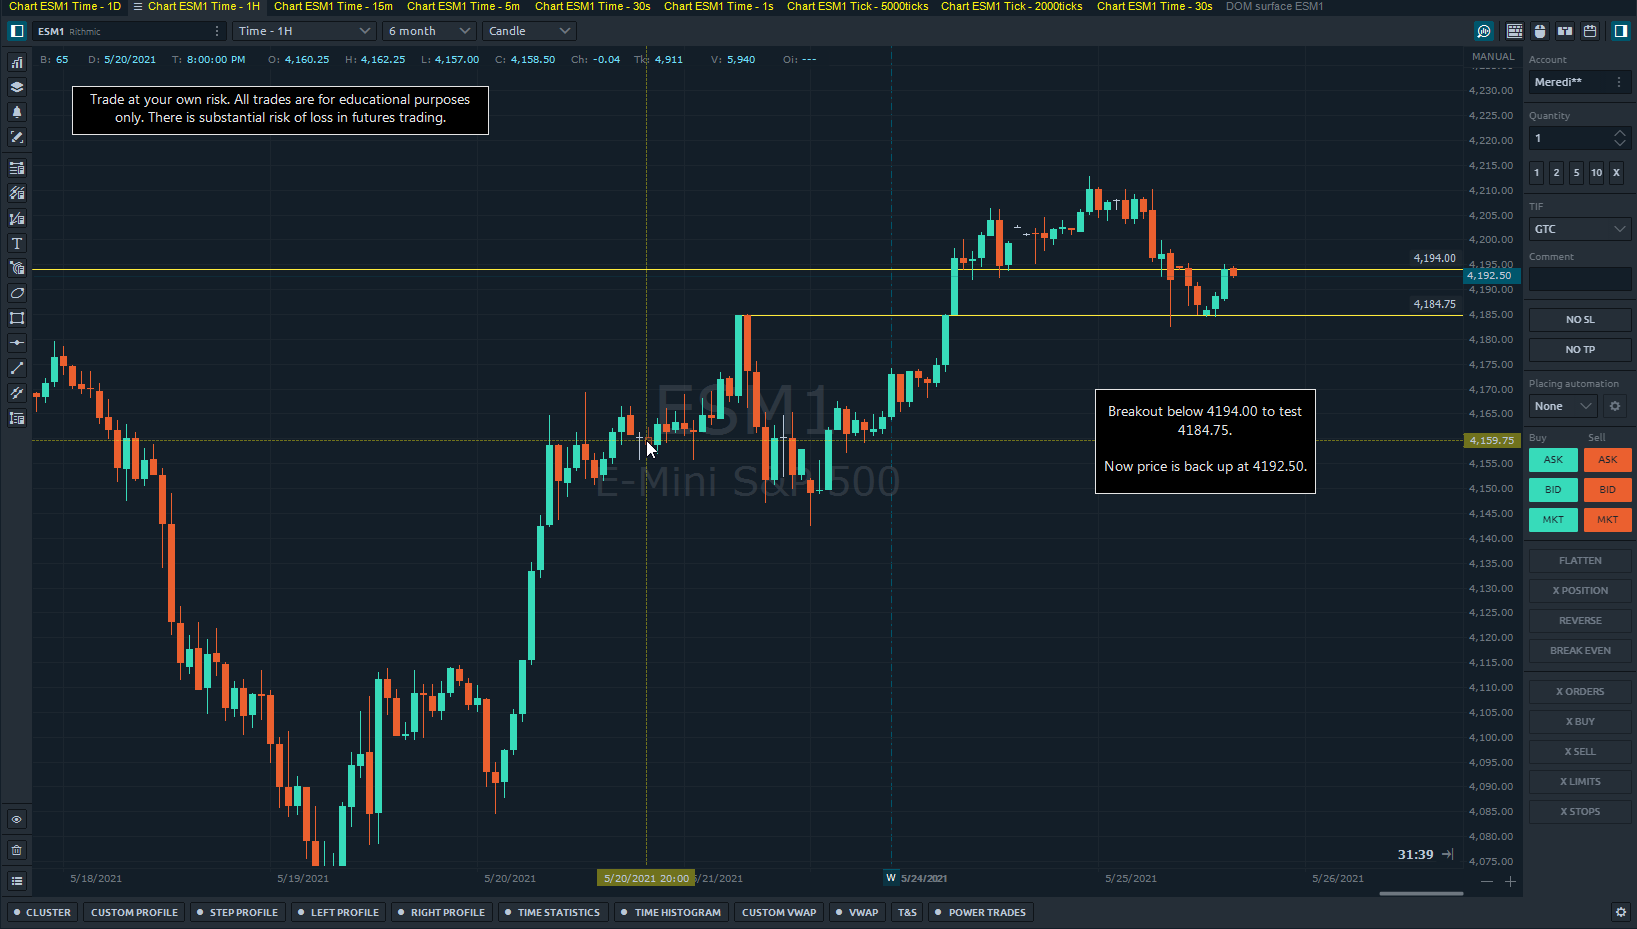
Fakeout leading to buyers puking.

It’s hard to determine when a level will break or when participants will puke their positions. It’s a lot of, “if this then that” scenario. With any order flow data, it’s still very important to take into consideration the most likely situation.

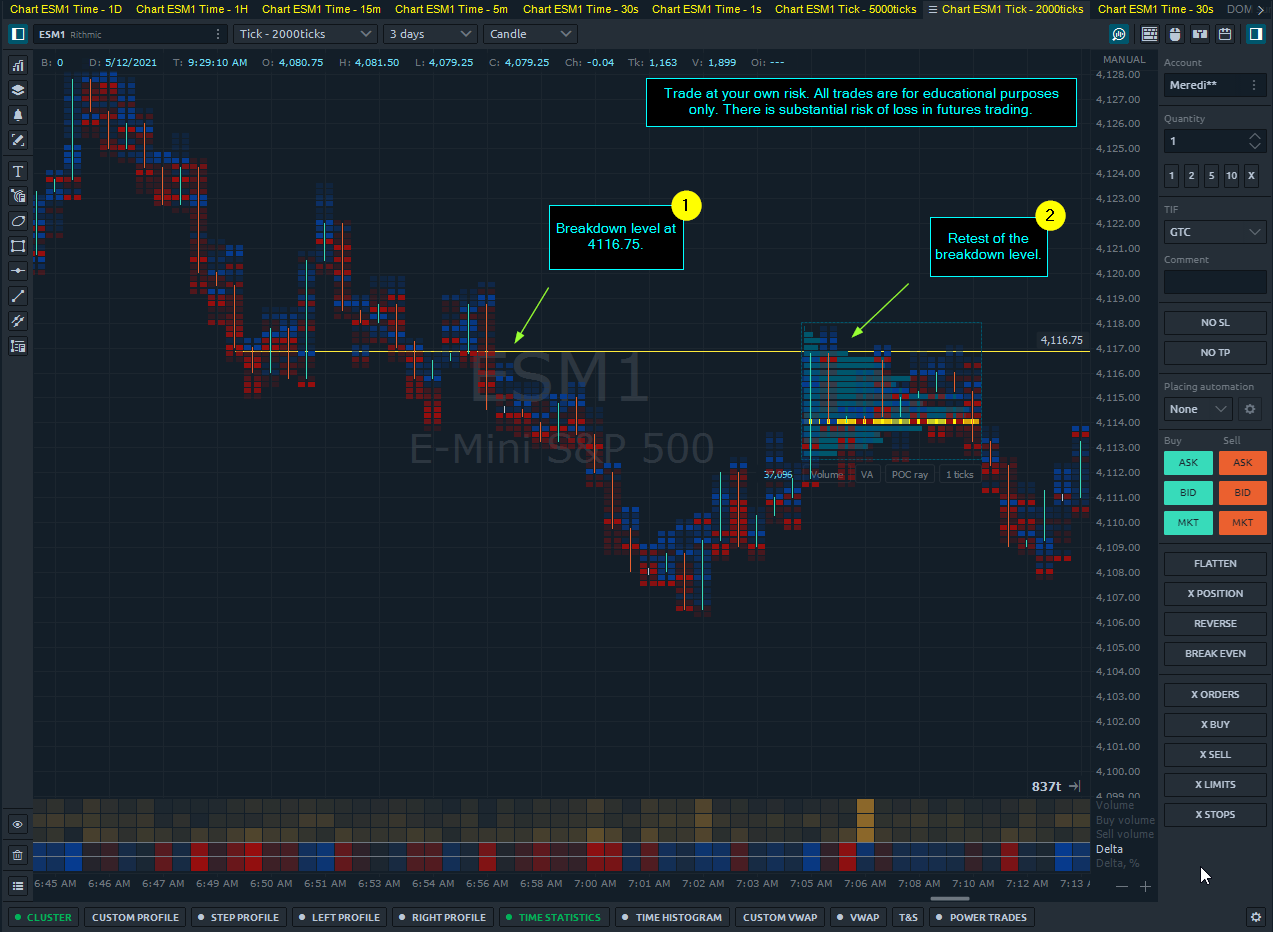
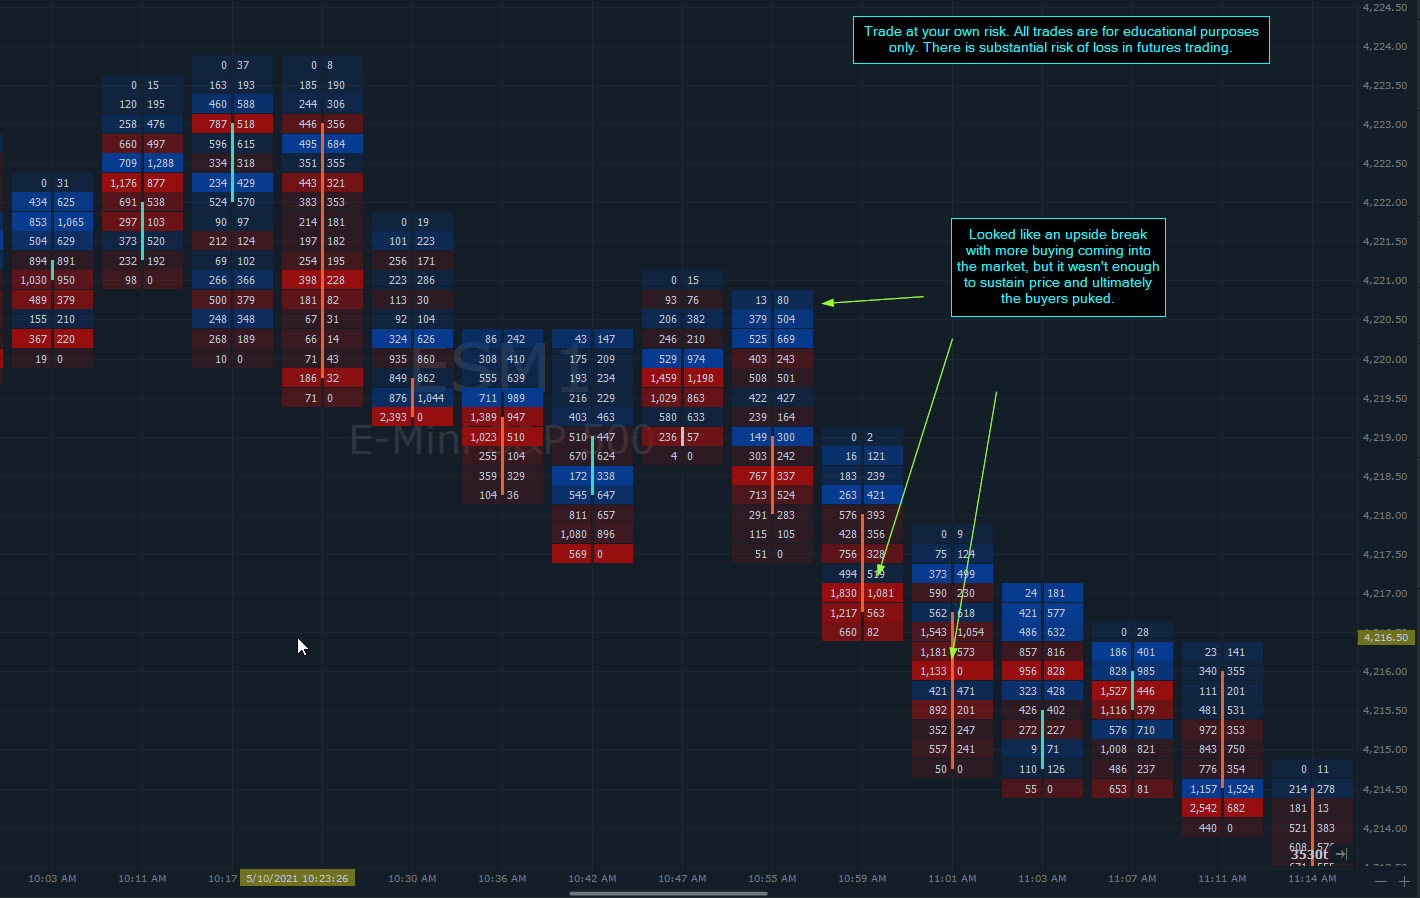
In this case, there was a pattern forming that appeared to be a fake breakout to the downside. Sellers gained momentum below support, yet price held just below support without continuation.

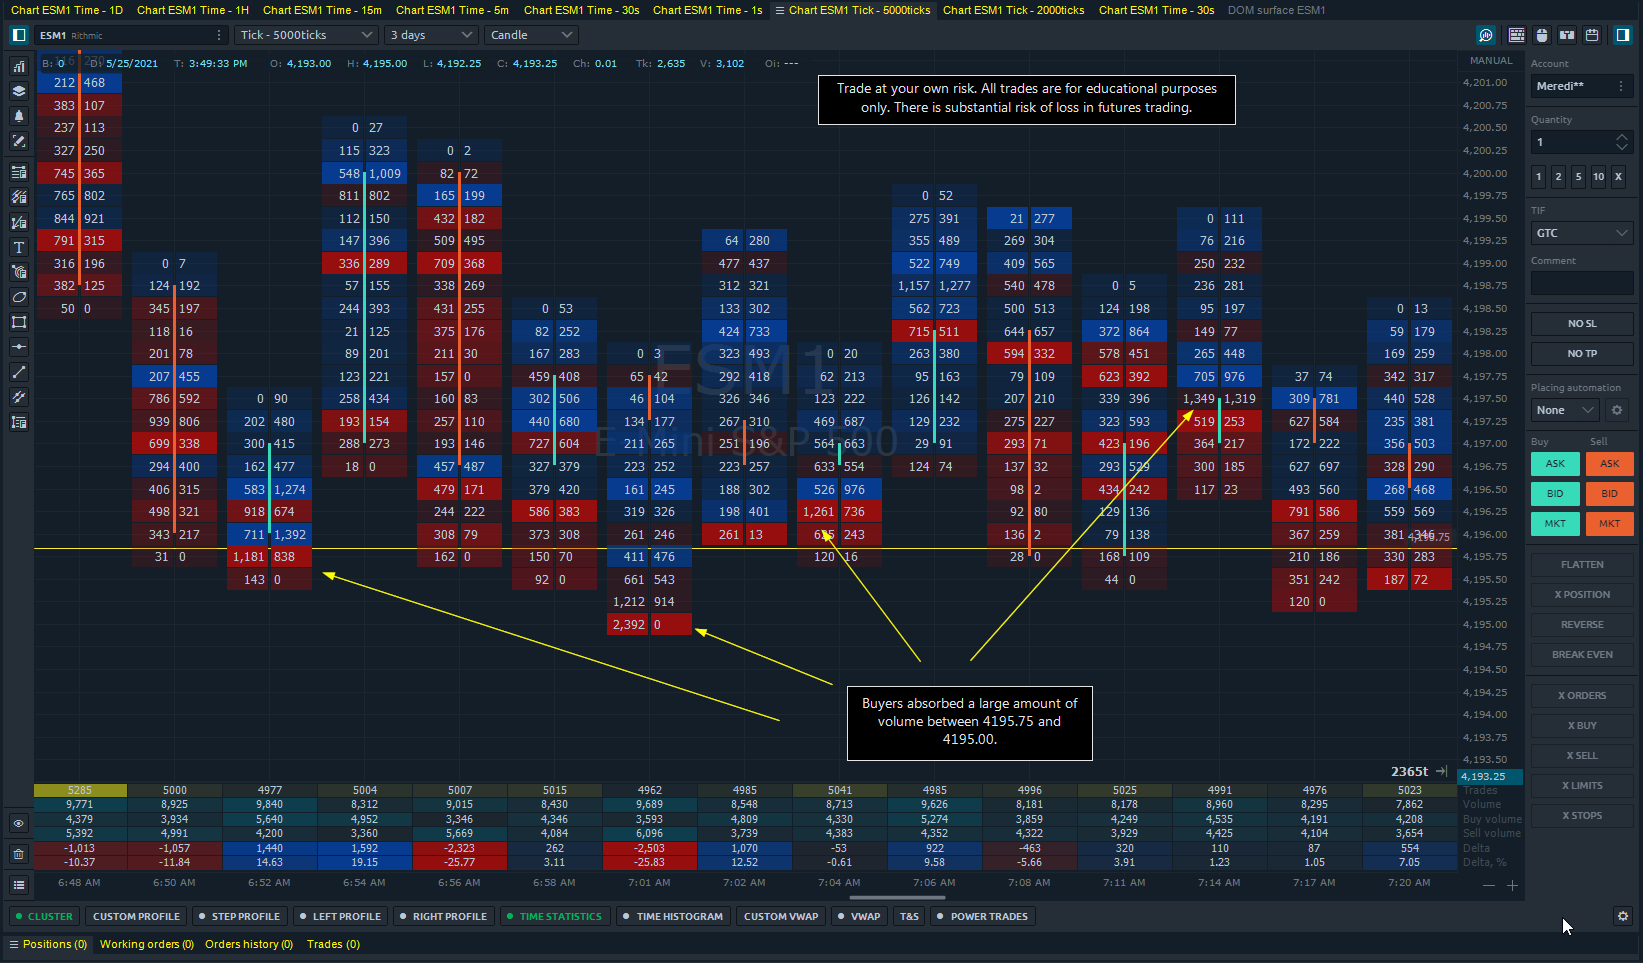
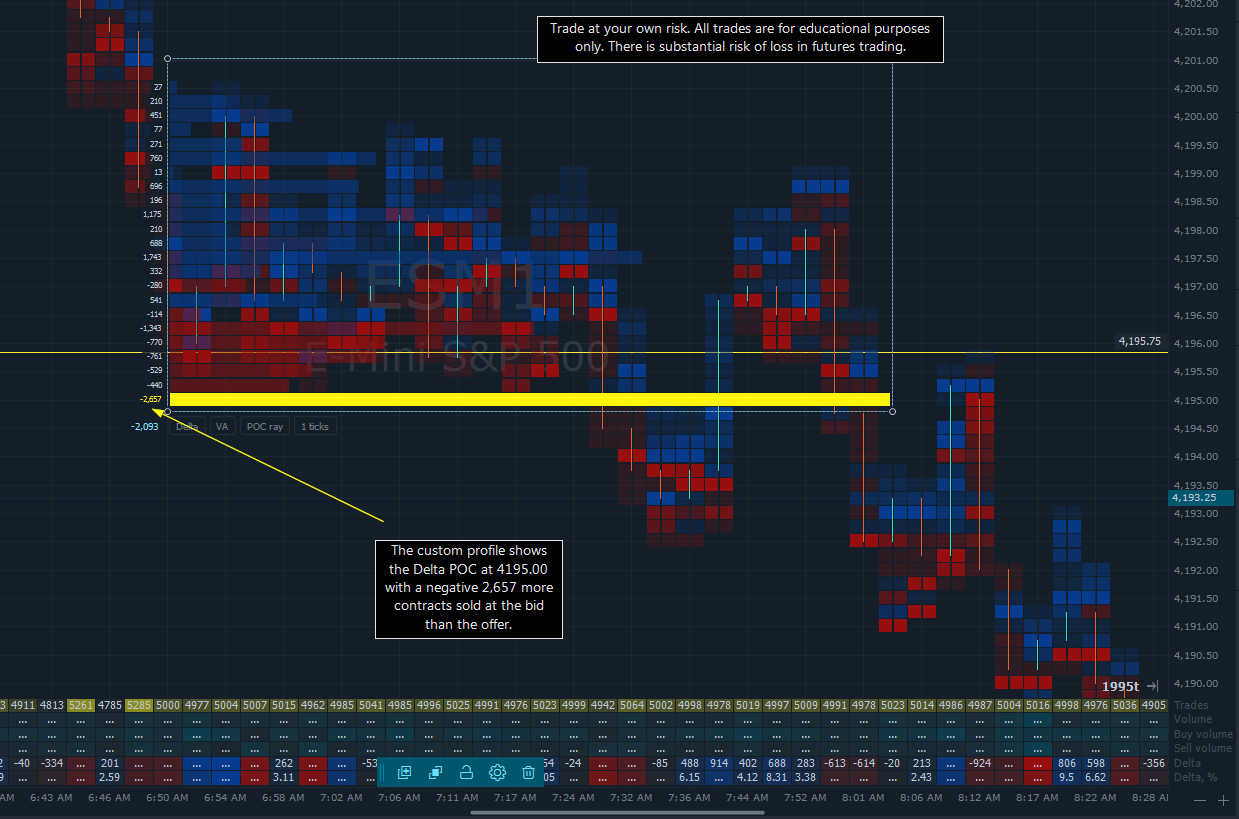
Price started to travel back above support, potentially forcing sellers to buy. The moment buyers started to lift offers, sellers came in and the bids backed off, driving price down.

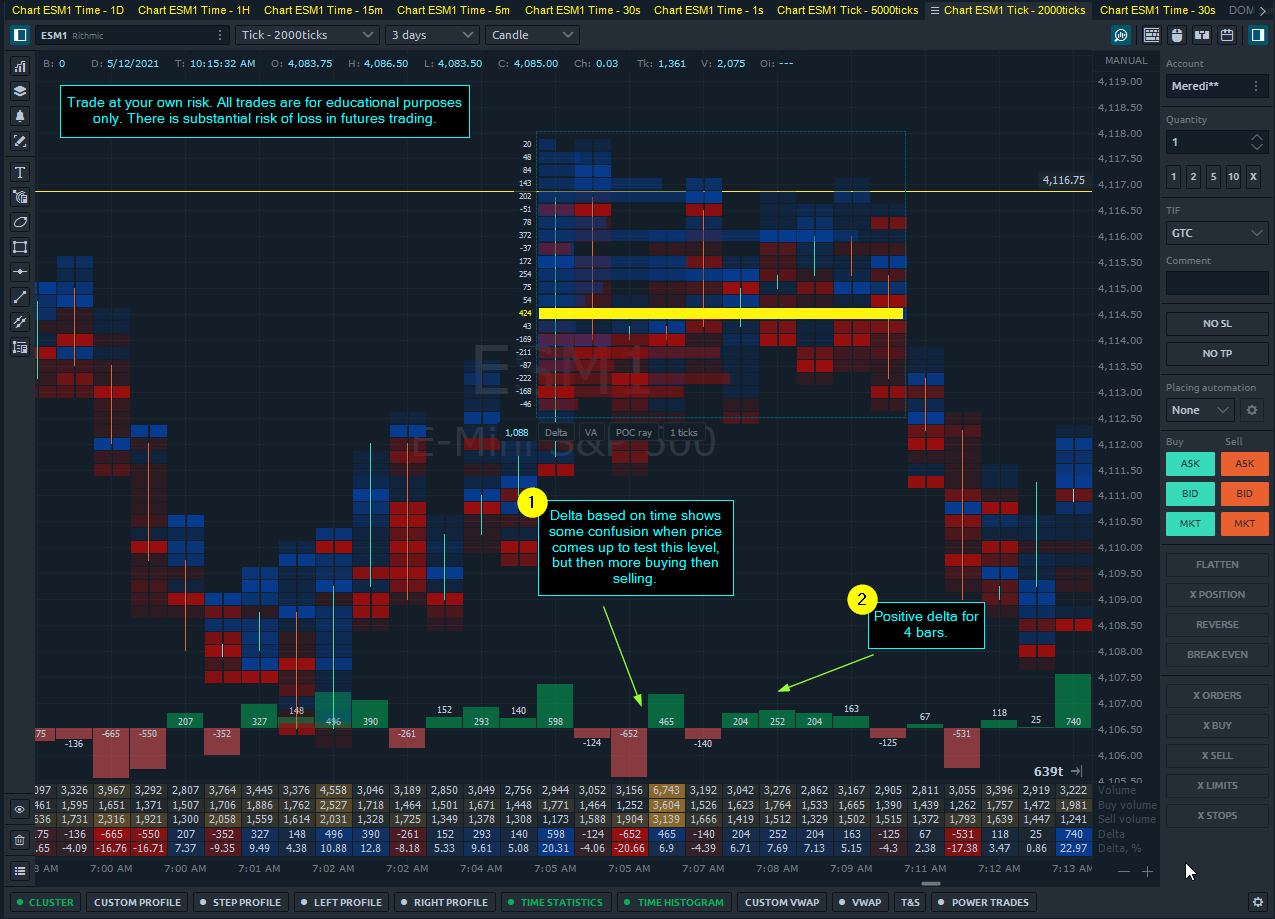
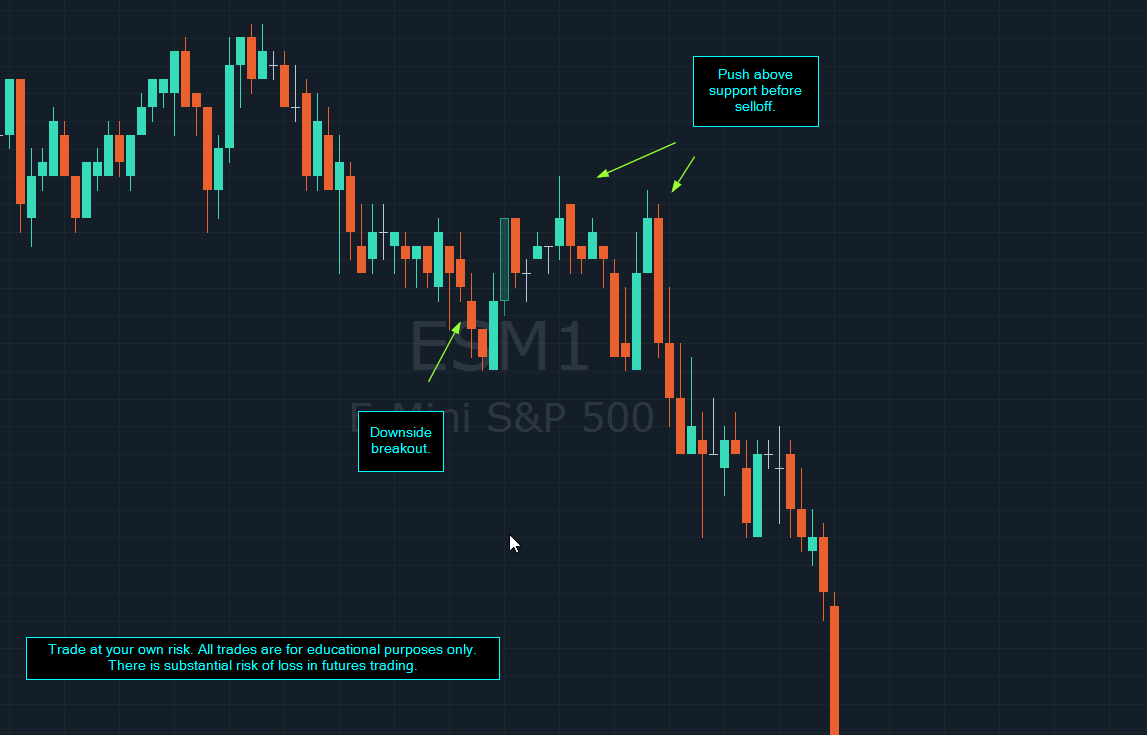
Here it is on a 30 second chart:

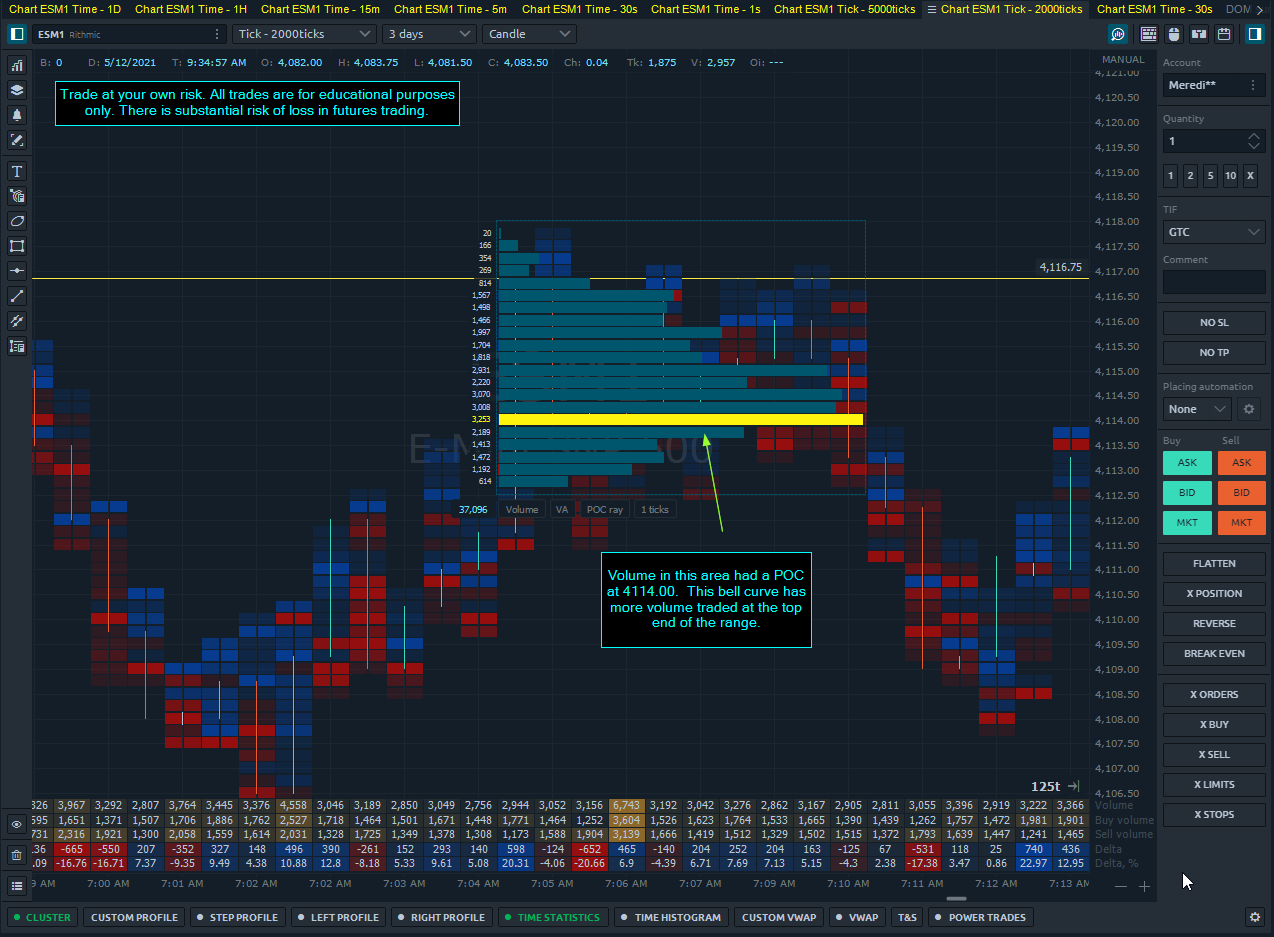
As we all know, there’s no way to tell. I didn’t trade this, but I did think it was a short-trap and it would go back into the range and rally. The market felt strong and it seemed that buyers were dominating early trade.

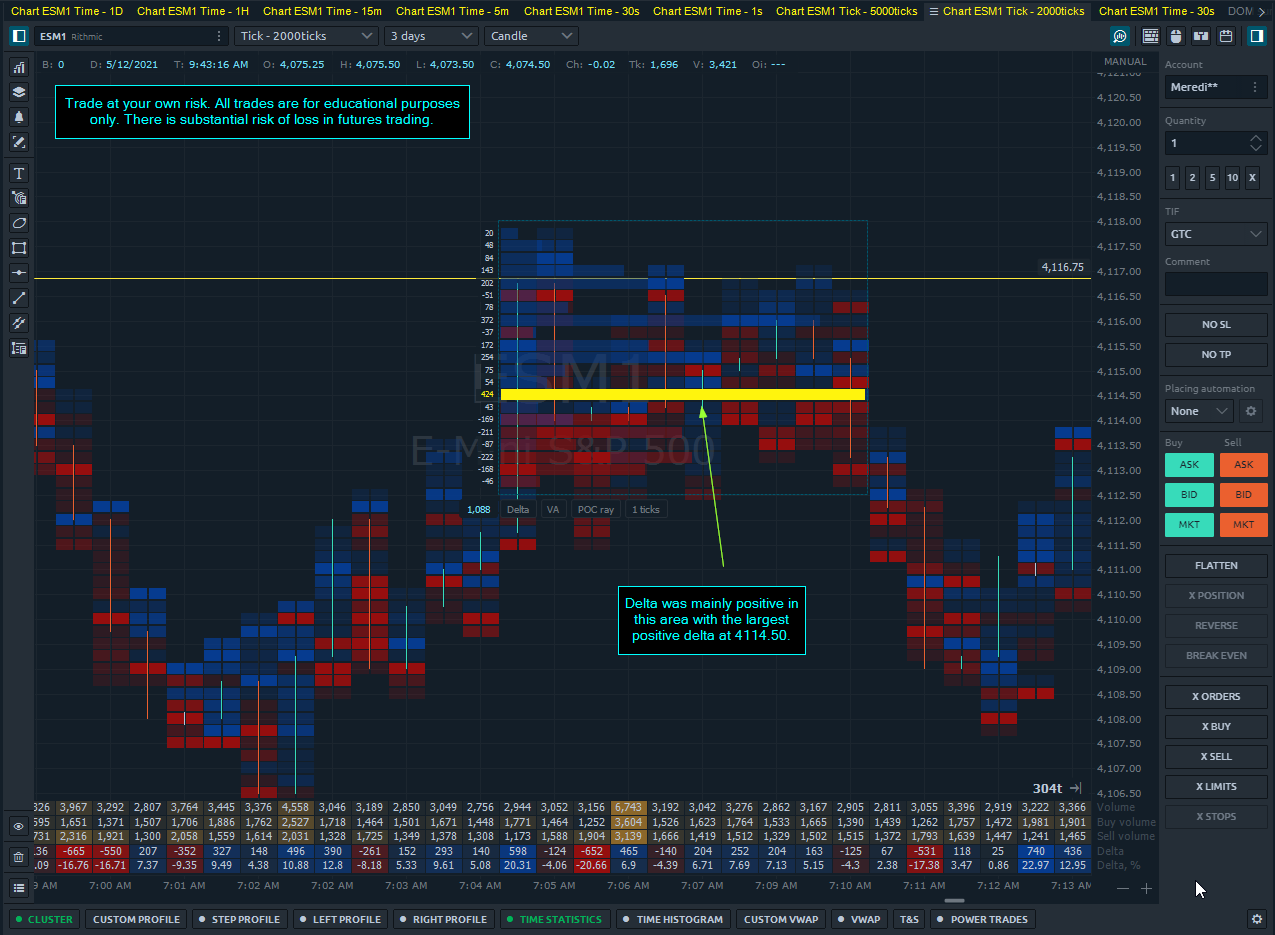
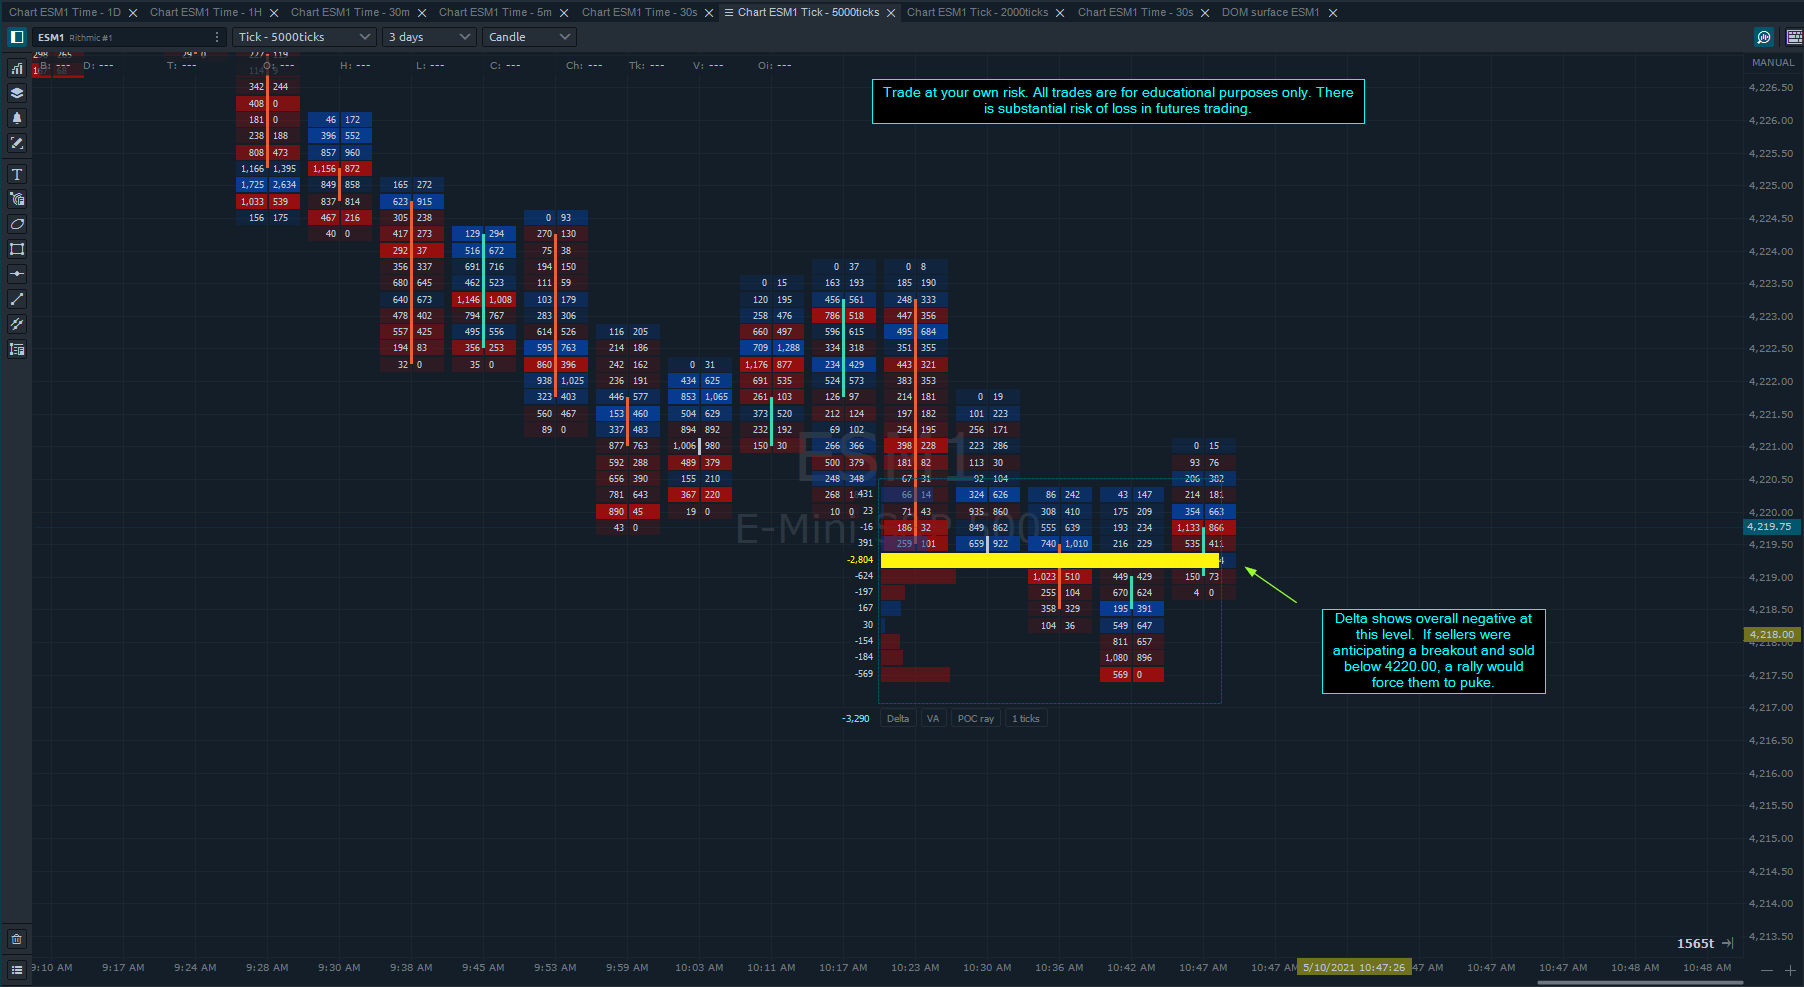
Once the buyers couldn’t push it back into the range, I should have shifted gears and gone to the short side. I also forgot that I spotted this at the open:

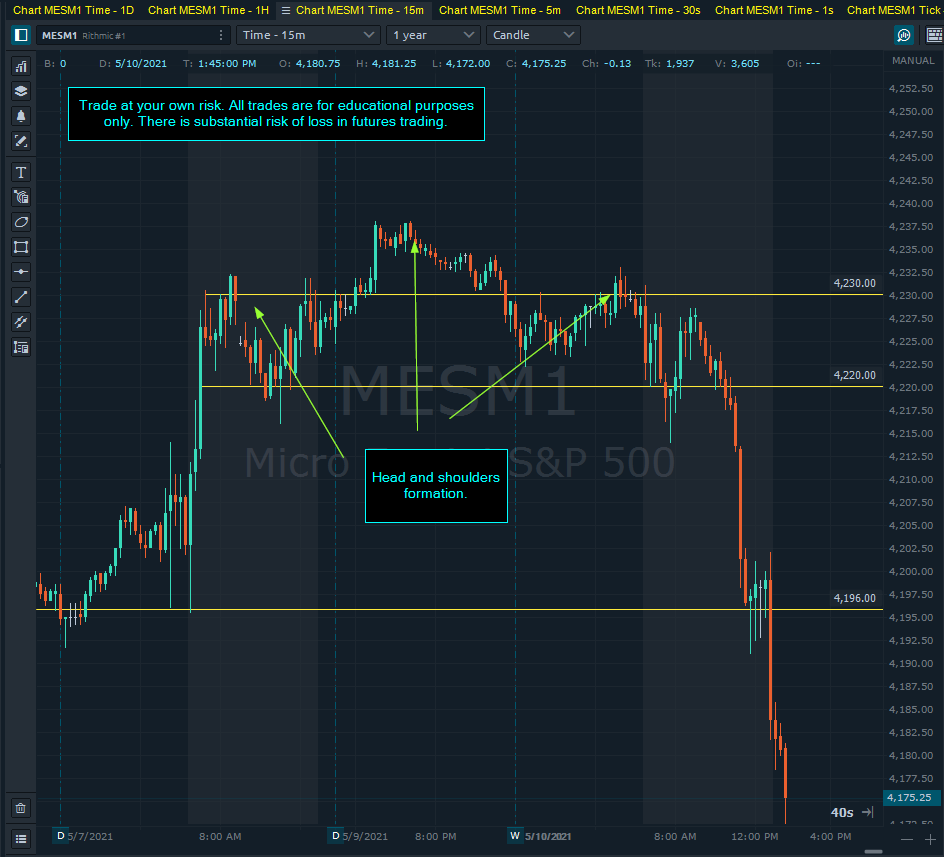
It very well could have gone up from here, but if I was quick to react I could have seen the short potential.

Not only would we have new traders entering the market on the pattern, but there would also have been existing long traders needing to puke their positions. This ignited the sell-off today.

There is a substantial risk of loss in futures trading. Past performance is not indicative of future results. The figures here represent an opinion. The placement of contingent orders by you or broker, or trading advisor, such as a “stop-loss” or “stop-limit” order, will not necessarily limit your losses to the intended amounts, since market conditions may make it impossible to execute such orders. Please conduct your own due diligence if Futures are an appropriate instrument for you.

Breakdown of support and retest - Volume analysis.

Here’s a level from 5/12 that was broken to the downside and then retested about 20 minutes later. I want to look at the volume profile and delta of the buyers coming up to the retest.

Looking more closely at the volume profile we can see that there is a bell curve but it is weighted more to the top of the range.

Here is the delta profile for that same time:

On a time basis, we do see more buying than selling at this level.

The decision becomes:

  • If price doesn’t break this, buyers will have to puke.
  • If price breaks up, it may reach the opposite of the range before falling again.

Now we have a clear point at which we are wrong (if we are short and sold the retest), and if we are wrong we can always enter at higher prices at resistance.

If we are right, we ride the price down as buyers puke and then we cover at next support.

There is a substantial risk of loss in futures trading. Past performance is not indicative of future results. The figures here represent an opinion. The placement of contingent orders by you or broker, or trading advisor, such as a “stop-loss” or “stop-limit” order, will not necessarily limit your losses to the intended amounts, since market conditions may make it impossible to execute such orders. Please conduct your own due diligence if Futures are an appropriate instrument for you.

Huge levels of support being absorbed by buyers. ES Mini Futures May 25th

Today we saw a quick sell-off then ranges being formed. The thing that prompted this post is a few things:

  1. The amount of absorption we saw on the bid.
  2. The clarity of support and resistance.

Here’s the hourly from today.

There are two major levels here at 4194.00 and 4184.75.

Let’s take a look at the time price came down to breakthrough 4194.00.

Correction - Another major level at 4195.75 as well.

Here is the 5,000 tick Footprint chart.

There is a huge amount of absorption at this level and it was very obvious as it was happening.

This was a good place to reassess the market structure and determine if this level would hold or eventually break further.

Here is a custom profile showing Delta based on price.

Initially, I was long when price first tested this area. We saw the absorption and it bounced accordingly.

I was quick to get flat because the market felt heavy. I was saying this throughout the trade here, which we see with the huge negative delta in this range.

Point is, a long trade worked here just as a short trade did if the plan was to sell the top of the range and stop out above it.

The only difference is the perception of that market at a particular time. It’s different to be biased short than it is to observe the market is experiencing aggressive selling and heavy offers, saying that out loud.

Biased would be:

“I think… I want… It should…”

Observant would be:

“I see sellers being absorbed by lots of bids… I see buyers not being able to make higher highs… This retest of support is currently holding…”

Being able to see both sides but still have an idea of where the market is going has been very very very difficult for me. Observing, being objective yet confident (where’s the line drawn between the two?), observing my emotions, etc…

However, that is the time where I feel most in line with the market when I’m unbiasedly watching the market.

There is a substantial risk of loss in futures trading. Past performance is not indicative of future results. The figures here represent an opinion. The placement of contingent orders by you or broker, or trading advisor, such as a “stop-loss” or “stop-limit” order, will not necessarily limit your losses to the intended amounts, since market conditions may make it impossible to execute such orders. Please conduct your own due diligence if Futures are an appropriate instrument for you.