Attention Traders,
Please note that the MarketDelta platform by MarketDelta.com along with FootPrint Charts is no longer available.
For anyone still interested in MarketDelta, you will find the following trading platforms allow you to trade with similar features and data that was available on MarketDelta:
1. Optimus Flow
2. Sierra Chart
3 Inside Edge
4. CQG Desktop
5.MotiveWave
6. Bookmap
7. Jigsaw
Click Here to Learn More about Footprint Charts | A Futures Trader’s Guide to Volume Analysis
Here is a brief synopsis on how MarketDelta’s innovative technology impacted futures trading:
MarketDelta was a professional trading platform that provided market transparency with micro analysis of what was happening at various prices levels between buyers and sellers. Their FootPrint Charts showed this interaction between buyers and sellers and its influence and impact on price direction.
FootPrint Charts is a measure of the net long versus net short in any given price point (difference between buyers and sellers), and that was depicted on MarketDelta’s price chart in the form of a bar representing Buyers X Sellers, i.e. buyers versus sellers, where trades could then be further sorted by lot size and period.
Prior to MarketDelta, many futures traders used a combination of Time & Sales windows and Candle Charts to retrieve similar data. However, it is not easy to use Time & Sales as a reference because it is a numeric format and not a visual representation. And candlestick charts only show open/close and whether the futures contract went up or down. The volume shows the total size but does not distinguish whether that volume came from buyers or sellers. By adding this missing piece of data, many futures traders found MarketDelta extremely useful since traditional charts do not tell you whether a price change was due to aggressive buying or selling.
The FootPrint Charts from MarketDelta showed you the volume for each price levels broken down to Buy Volume and Sell Volume separated by an X. You could see this information over specific periods: Tick, Minute, Volume, and Range Periods. Also, for more advanced users, you could filter by trade size and other preferred settings such as color and shade only, without the actual numbers.
Again, MarketDelta consisted of Price, Volume, Time, and Bid & Ask Quote. It would help if you kept in mind that the MarketDelta Orders were constructed via “aggressive trading” Market Orders matched with “passive trading” Limit Orders. This is what dual auction market means.
If you are interested in learning how to utilize the same functionalities just described for MarketDelta on the trading platforms listed above, please follow the instructions below on how to get started:
1. Optimus Flow
Optimus Flow is our signature trading platform with a groundbreaking trading interface using analytical panels for enhanced visual display, better technical analysis and faster order execution.
-
Our platform covers many features that were found in Market Delta. Things like number bars (cluster charts), liquidity and heat maps (DOM Surface), and Volume Analysis - TPO charts are found throughout the platform.
-
DOM Surface - Track all liquidity changes in the order book as well as trading activity of participants via the Heatmap view
-
Volume Analysis - Tools for deep price analysis: Cluster chart, Volume profiles, Time statistics, Time histogram, Historical Time & Sales, Price statistics, Volume Impact indicator
-
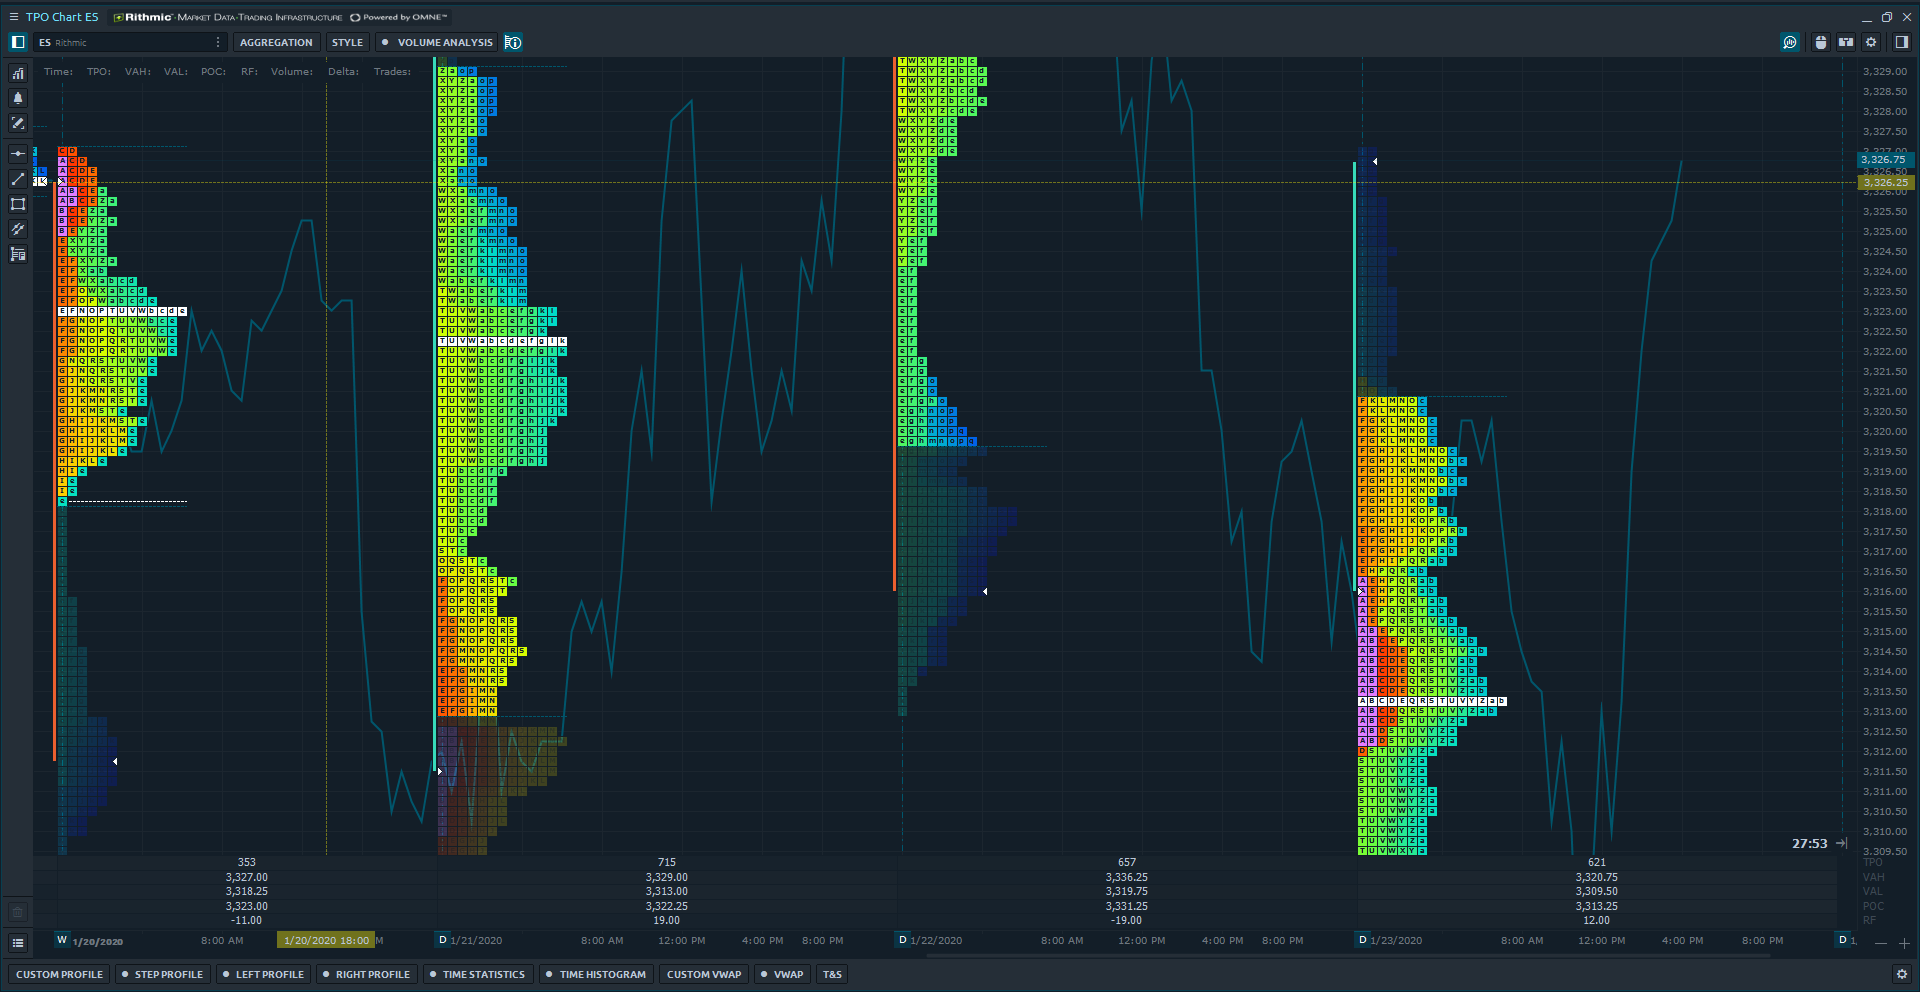
TPO Profile Chart - Shows the price distribution during a specified time to reveal which levels the price has spent the most time
-
Advanced Features - Excel integration, Renko, Kagi, P&F and Heikin-Ashi charts, Unlimited Overlays & Indicators, Multiple synchro-connect, Chart Alerts and more.
Example of Optimus Flow TPO Chart:
Optimus Flow is available for FREE to all our customers.
You Get ALL our Premium Features for FREE > NO Licenses, Packages or Upgrades. Simply Open an Optimus Futures account to get access to all platform features with ZERO limitations.
Customers also get FREE access to our latest tool – A TRADING JOURNAL with platform-sync technology
- Automated Journaling – Upload all your trades seamlessly from Optimus Flow to the Trading Journal with just one-click
- Get in-depth trading analytics and performance metrics on all your trades on Optimus Flow
- Improve Trading Performance – Identify patterns in your trading to find out what’s working so you can focus on your strengths and cut down on your mistakes
- Web-based Journal – Access your trade history anywhere on any device.
Open your account with a minimum of $100 to get your free platform and journal and start trading with LIVE DATA!
2. Sierra Chart
- Sierra Chart continues to be one of the most powerful charting software on the market, albeit a steep learning curve. For those customers that are interested in replicating MarketDelta’s footprint charts on Sierra Chart, you’ll need to focus on two studies: Number Bars and Number Bars Calculated Values.
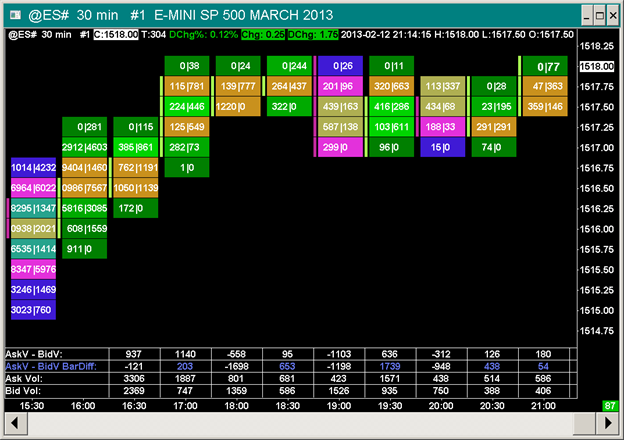
- Sierra Chart’s number bars are a great alternative for traders that are focused on volume. As with MarketDelta, Sierra Charts footprint charts or “number bars” represent the difference between the Ask Volume and Bid volume at each price level and the total volume or number of trades at specific price levels.
- Sierra Chart can be powered by the Rithmic, CQG, TT and OEC data feeds.
- To access number bars on Sierra Chart, users must subscribe to Service Package 5 and must also have a Windows Computer, since the platform will not work on MAC devices. Please note that the number bars must be manually configured by the user.
Optimus Futures customers get discounted pricing for Sierra Chart’s Package 5 for $25 (via AMP Clearing Only)
Sign up here for a Sierra Chart Demo: Sierra Chart Free Demo | Teton Order Routing | Optimus Futures
Example of Sierra Chart Number bars + Number bars calculated value courtesy of Sierrachart.com:
3. Inside Edge
- Inside Edge is another great alternative for traders looking to create Footprint charts. Inside Edge contains sophisticated volume and bid/ask analysis with multiple bar and display styles, including Footprint Charts!
- Inside Edge charts support several years of accurate tick data and are extremely customizable and user friendly.
- Inside Edge can be used with Rithmic or CQG data feeds.
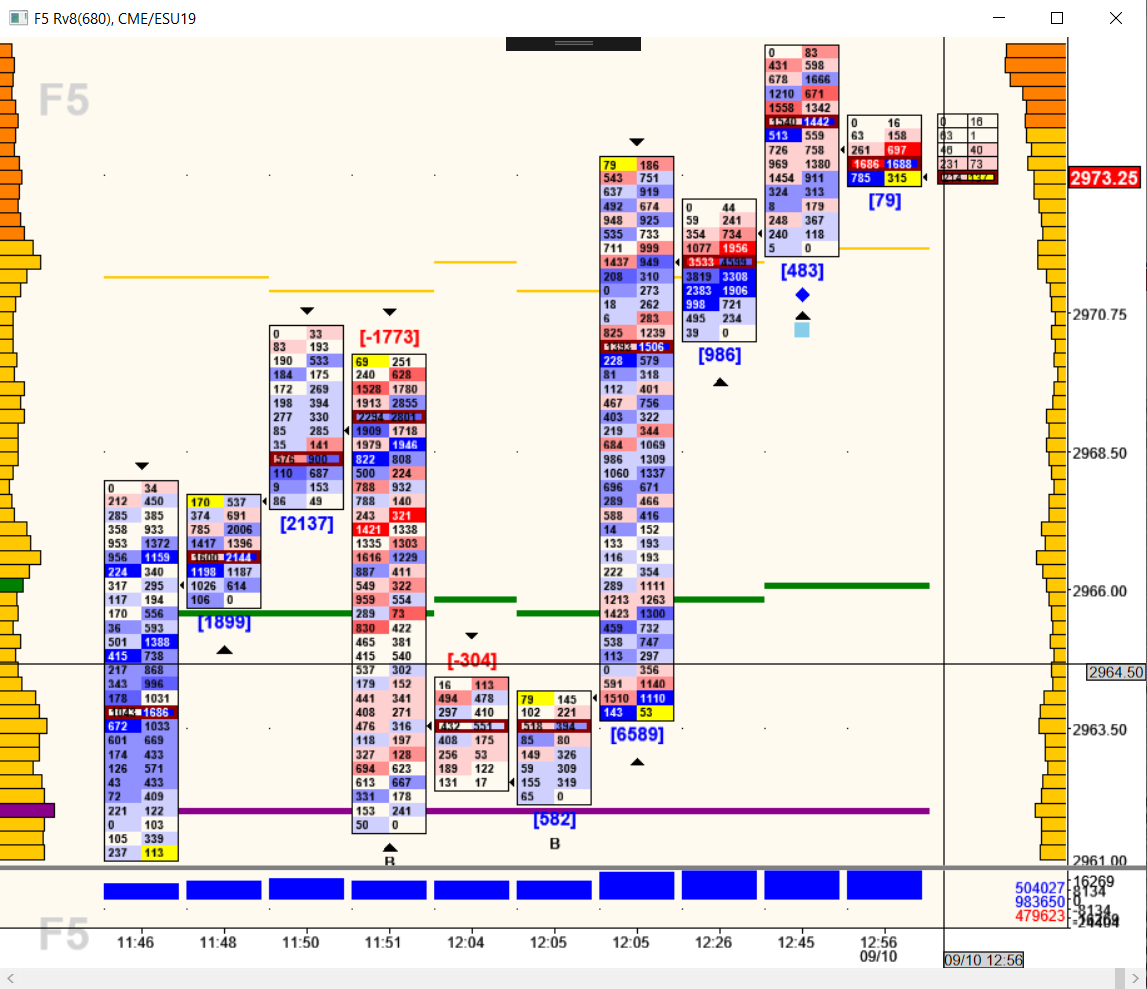
- To access Inside Edge’s Advanced Order Flow Analytics suite, you must subscribe to the Professional Edition. The Professional edition includes Volume Study Indicators with trade size filtering such as cumulative delta, Split Volume and Buy/Sell differentials, Long term Volume Profiling histogram with trade size filtering, and Volume Map charts with trade size filtering.
Sign up here for an Inside Edge Demo: InsideEdge Free Demo | Futures Trading Platform | Optimus Futures
Example of Inside Edge Order Flow Analysis and Footprint Charts:
4. CQG Desktop
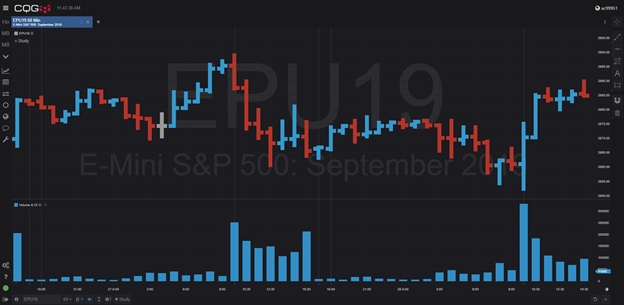
- Although CQG Desktop does not contain footprint charts, the platform can be configured to display volume as well as volume and open interest.
- The platform is extremely customizable and can be used on both MAC and Mobile Devices. The platform is entirely web-based, and all data is stored on the cloud. For those of you looking for a platform similar to MarketDelta Cloud as Mobile Phone solution, CQG Desktop will serve as a great solution and alternative.
- For those traders interested in using footprint charts on a native CQG Platform, feel free to take a look at CQG Integrated Client.
CQG Desktop is FREE for Optimus Futures customers via AMP Clearing Only (Regular $25 / month)
Sign up here for a CQG Desktop Demo: CQG Desktop Free Demo | Futures Trading Platform | Optimus Futures
Example of an CQG Desktop Chart with the Volume & Open Interest Indicator applied:
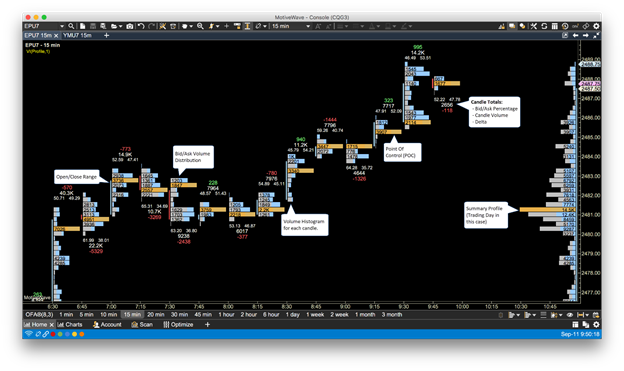
5. MotiveWave
- MotiveWave is a great solution for traders focused on a clean interface, flexible customization and indicators that can replicate MarketDelta’s footprint charts.
- MotiveWave’s Volume Imprint or Volume Footprint studies can be used as a versatile indicator that provides users with various ways to look at volume distribution inside of a price candle. MotiveWave can be used to visually display volume histograms, bid/ask price intervals, price ladders, delta, and of course a numerical view of volume.
- MotiveWave can connect to Rithmic, CQG or OEC data feeds.
- If you are interested in replicating MarketDelta’s footprint charts on MotiveWave, you’ll need to subscribe to the Advanced Charts edition. MotiveWave can be used on both Mac and Windows devices.
Sign up here for a MotiveWave Demo: MotiveWave Free Demo | Futures Trading Platform | Optimus Futures
Example of the Volume Imprint study courtesy of MotiveWave.com:
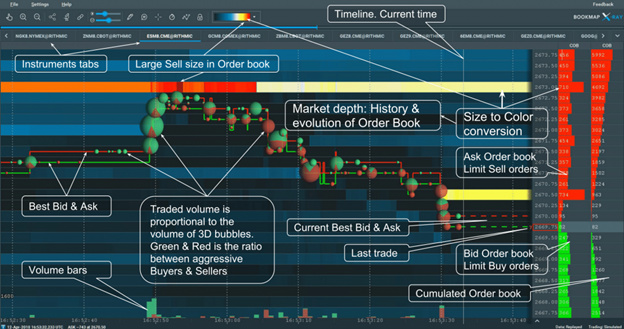
6. Bookmap
- BookMap is an ideal platform for those traders focused on visuals, identifying market trends through patterns, market liquidity and volume.
- BookMap uses a unique combination of footprint charts, volume profile and heatmaps to display support/resistance levels, order flow, liquidity, and volume in the current market.
- Bookmap connects to the Rithmic, CQG, OEC, and TT data feeds.
- BookMap also has a learning curve that traders must adjust to before jumping into the market. Once mastered, the visual cues that BookMap provides proves to be quite powerful in the decision-making process. For those traders interested in trading futures through Bookmap, you will need to subscribe to the Global + edition.
Sign up here for a Bookmap Demo: Bookmap | Futures Trading Platform | Optimus Futures
Example of Bookmap charts courtesy of bookmap.com:
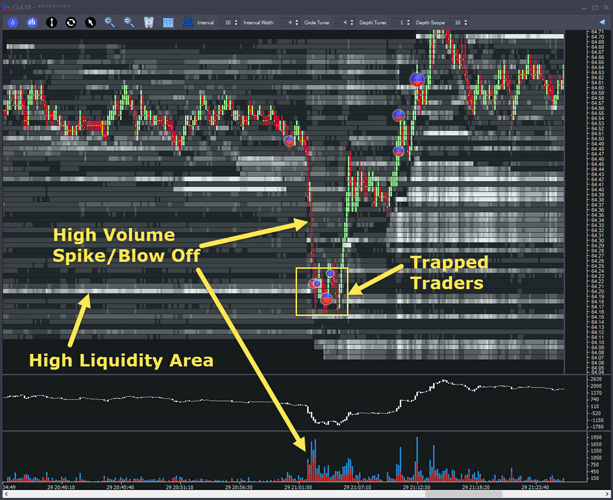
7. Jigsaw
- Jigsaw is also a great solution for those traders that seek clear visuals and market depth visualization.
- Jigsaw provides traders with Price Delta Chart, Cumulative Delta, Volume Delta Bars, Depth Histogram and Flip Charts which can essentially be used to replicate footprint charts seen in other platforms as well as MarketDelta.
- Jigsaw Daytrdr can connect to CQG, Rithmic, OEC, and IQFeed data feeds.
- To obtain the Advanced Order Flow Package , users must subscribe to at least the Professional edition . Users also have the option to subscribe to the Institutional Edition which includes all the features of the Professional edition and more!
Sign up here for a Jigsaw Daytradr demo: Jigsaw daytradr | Futures Trading Platform | Optimus Futures
Example of Jigsaw Daytradr Charts:
Optimus Futures has access to all the trading platforms above, some with exclusive pricing, routing and clearing arrangements not available anywhere else. CLICK HERE to view all our platforms with full pricing and package details.
If you have any questions, please feel free to reach out to us or leave a comment below.
Thanks for your time,
Optimus Futures Support ![]()