In my last post, I laid out my first experience with trading and how actually being in the markets at a top firm completely changed my outlook on what trading was, and more importantly what it wasn’t.
Everyone has access to charts and basic indicators, moving averages, bollinger bands, etc. Many of these do provide relevant information about market conditions and trends. However, the one thing we focused on when we were trading hundreds of times throughout the day was order flow.
90% of my focus was staring at the order ticket, watching the orders come in and out of the market. This also included people bidding and offering contracts at certain prices of the market. Over time, you could start seeing patterns of when things were aggressive, slow, or when someone just bought a 500 lot or puked their position. There’s no indicator that can show that granular detail on what people are doing inside the market.
Here’s a level I was watching the other day. It was trending up and coming down to the 2842.50 level. On the screen shot below the numbers in blue are the bids and offers are shown in red.
The “6” on the right side is where it shows the contracts traded. Before MarketDelta Desktop came out, this is what we looked at and you had to keep track in your head of what price was trading. Eventually you got a sense of seller and buyers, and whether selling was drying up and not able to push it down any further. If you saw, let’s say, 2,000 contracts being sold or “hitting the bid” but price didn’t move, it was safe to assume that if price started moving up those sellers would have to puke their position and turn into buyers which drove the price up even further. This is why you’ll see quick price movement at key levels.

Here’s the 1 min chart of that area. I used Optimus Flow with the Rithmic data connection feed for CME data. You WILL want this to watch order flow and get this Market Delta footprint chart.
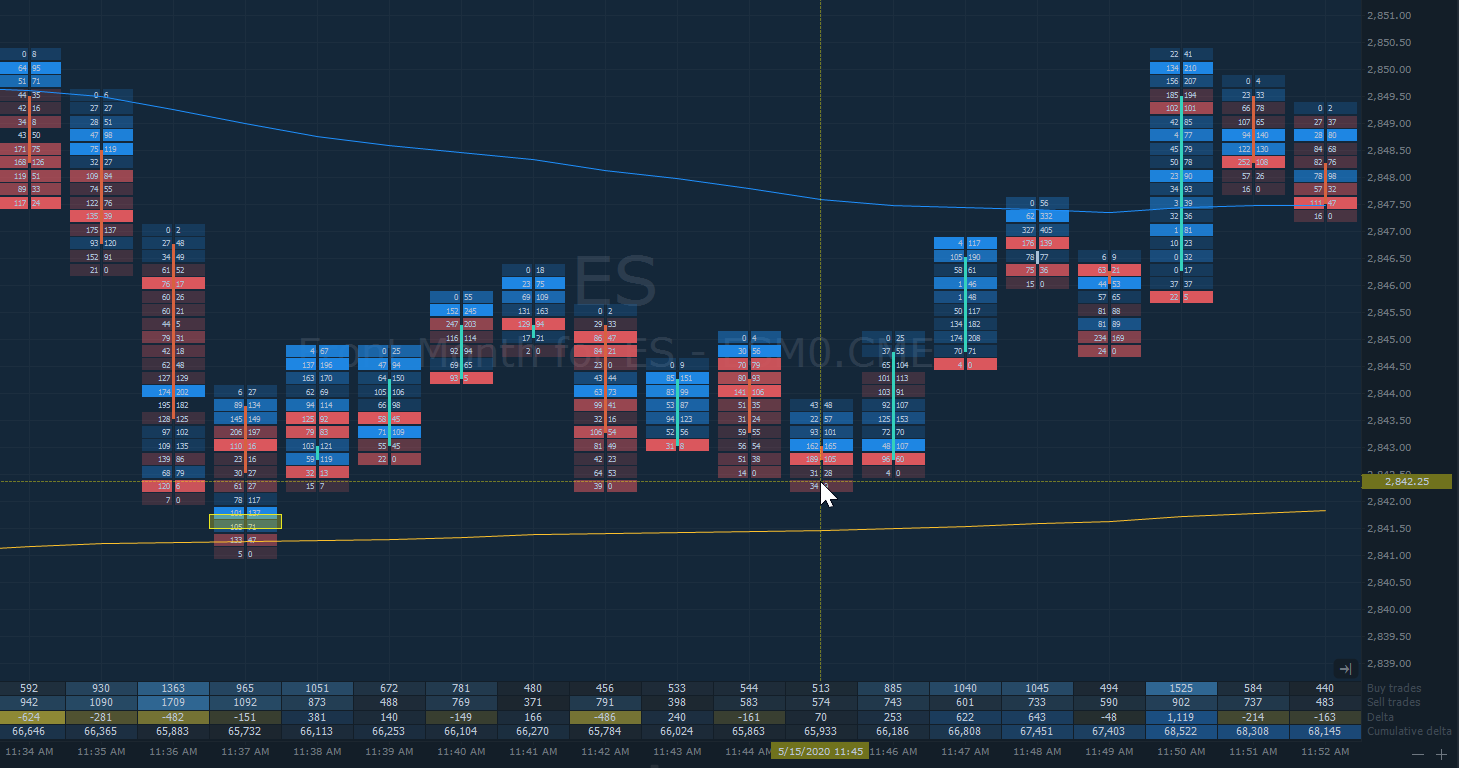
The bar at 11:36 AM had a -482 delta, meaning there were 482 more sell trades than buy trades. I didn’t take this into consideration as much because this was a continuation from a down move. The key 1 min bars happen between 11:37 AM and 11:46 AM.
Traded in a channel during this time and at 11:44 to 11:46, sellers couldn’t push it much further down than 2842.75. At 11:44 is when I knew I wanted to be long. The support was 2842.75 so I bid there.
The huge difference here is that with order flow you can see sellers drying up and not being able to push it further down. Because of this, my entry was on the low end of the channel compared to traders who trade breakouts. They may have had a long outlook on the move but waited for PRICE confirmation with a breakout, whereas I just needed to see the ORDER FLOW confirmation.
The difference of entering at the bottom of the channel vs the top is a whole 2 points. With a 10 lot that’s $1,000. Better yet, if the breakout doesn’t happen and I don’t see buyers come in, I can exit the trade and still be profitable. The breakout trader without order flow data could buy and put their stop just below the bottom of the channel, which still panned out, but they are risking 2 points when the order flow trader who enters at the bottom of the channel is only risking 2 ticks.
Over the next 4 minutes it went to 2850.00 for a nice 7 point move. All the shorts turned into buyers moving the price up.
The best strategy is to look for key levels and trends, then dial into the cluster chart in Optimus Flow to see real time data of orders hitting the market.
Here’s the links for the products and data feeds I use:
