New to Optimus Furures, and hope to learn a lot from the futures markets. Traded Equities and ETFs on a fundamental basis and some technical. My question is whether you guys use chart formations in shot term trading or the technical analysis tools that come on the platforms? Is there a “fundamental” difference between technical analysis and price action? Do they work hand in hand or they should be kept separate? Please shed some light on the subject if you can. I trade ES and NQ, just as an FYI.
2 Likes
Thanks @LikeTudorJonesButNot for your questions on price action. I’d be happy to provide one view on this matter.
I’ll begin with the simple answer and then proceed to a more nuanced explanation.
You asked: Is there a “fundamental” difference between technical analysis and price action?
Yes. Price action is one subset within the wider technical analysis universe, one “technical” approach among many others, and one regime of thinking that places it in opposition to other perspectives.
What differentiates price action from other technical analysis approaches?
More so than most technical approaches, price action places its strongest emphasis on the interpretation of direct and immediate price movements. What does this mean?
- For one, this more or less shuts out lagging indicators (e.g. moving averages) as a “primary” tool for interpretation.
- It can sometimes (emphasis on “sometimes”) bypass certain oscillator readings and some leading indicators that tie current movement to past movement and base future forecasts on past movements.
- It uses a simple and flexible interpretive model to distinguish trends vs non-trending movements (Uptrend = consecutive higher highs and lows, Downtrend = consecutive lower lows and highs, and anything between may signal a potential consolidation, range, or reversal).
Since trends are generally confirmed in retrospect, its trend model is not necessarily intended to define a definitive state of things as price unfolds but a workable interpretation that may help identify potential breakout and target opportunities. This can also mean distinguishing smaller to larger trends viewable within a given chart time frame.
Why might it be incompatible with other TA approaches?
TA is a “heterogenous” discipline. Not everything fits within a single unifying logic. The reason for this is that many approaches (some of which may work harmoniously together) have their own distinct logics, rules defining their own field of relations, transformations, and most importantly…differences.
You trade the NQ. Do you remember this ugly moment from January to June 2018?

For the purpose of example, we have four indicators: 10 EMA, 50 EMA, Parabolic SAR (though rarely used, I included it for the sake of example), and a trendline based on the longer-term Weekly charts.
-
If you used a simple price to EMA crossover in relation to either the 10 or 50, you would have been whipsawed quite badly. Note that some crossover systems base trend on the position of price above or below a given trendline. Ultimately, this may not be the clearest indication of potential trend.
-
If you used an EMA crossover interpretation (10 over or under 50 EMA), the crossover would have continued signaling an uptrend until the crossover on March 23 (see rectangle). This is problematic, not only because of the whipsaw but because it fails to recognize a critical signal–that although a breakout from the current high failed to materialize, and although price action would have assessed the current price moves as a short-term downtrend, there was no indication YET that the Feb 9 swing low at 6164.00 was about to be violated, making the prospect of a trend reversal toward the downside too soon to call.
-
The Parabolic SAR might have signalled early on in April that a potential uptrend was underway, but this reading contradicts itself once the indicator changes course later in April appears on the screen.
-
The weekly downtrend line ended up being more consistent and sound. But the thing is, as a long-term indicator, how would you have made a shorter-term tactical outlook, either to help you stay in the trade, re-enter the trade, or make short-term trades?
This is where price action might have come in handy.
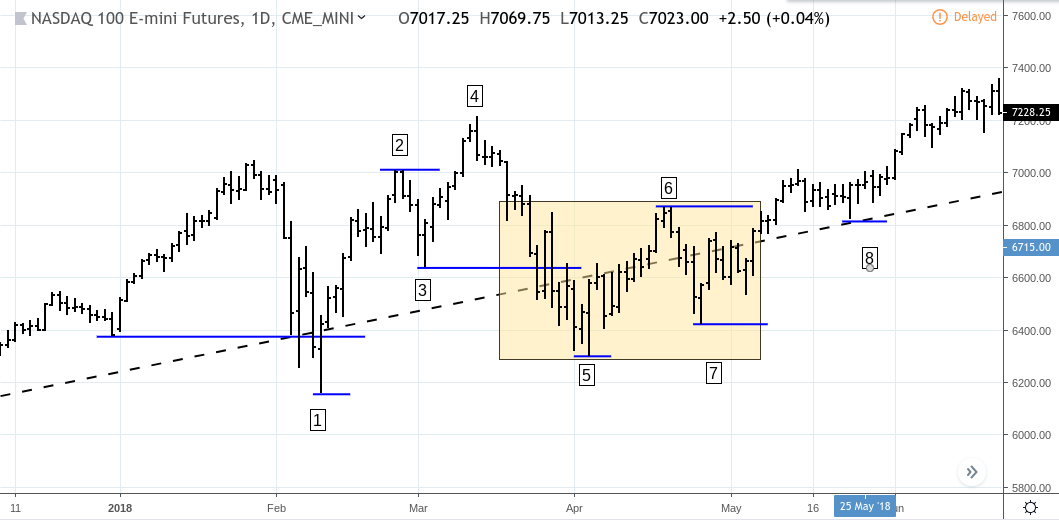
The downside trend break at (1) establishes a new low as it fell below the previous swing low. Does this mean a change or reversal? Well, it depends on whether it can break above the last swing high or whether it continues downward (indicating a potential downtrend).
Price fails to establish a higher swing high at (2). But it then fails to violate (1) as it establishes a swing low at (3). At this point we ask, is this a trading range, or will it continue moving upward? Price breaks above (2) but then falls below (3).
This is a critical moment that requires a flexible outlook The move from (1) to (4) looks like a smaller uptrend within the larger trend in focus. Although the bulls have failed to push price beyond this range, the major swing low at (1) remains untouched and in fact, looks like it is beginning to establish a sequence of higher lows after (5).
A longer-term or more conservative trader might have waited for price to break above (4) to confirm an uptrend bias or break below (1) to confirm a downtrend bias. A swing trader might have seen (6) and (7) as potential resistance and support from which a quick trade might have been attempted with an upside target at (2) or (4), or a downside target at (5) or (1). Otherwise, the break above (6) could have signaled a continuing uptrend, confirming this bias with the new higher low at (8), the subsequent break above (4), and also the relation of price movement to the weekly trendline.
A Kagi chart would have confirmed the upward bias sooner…

…particularly after the third higher swing low (see third arrow to the right) and the breakout (green line) that ended up establishing the swing high at (6).
There is much more to price action than what I can cover in this post. But hopefully at this point you can understand the value of immediacy and direct price observations that in some difficult situations may simplify rather than complicate interpretations.
3 Likes
@8Moons many thanks for this information. I was looking for some context, and this would be a good start for me. The charts illustrations are nice because I am a visual perosn so thank you again for adding that.
2 Likes
I use the heat map chart formation on Bookmap which gives me a clear view of the historical DOM, and support the chart with technical tools like EMA.
1 Like
@Jossef Welcome to the Optimus Community. We have a full discussion about Bookmap here: Bookmap | Futures Trading Platform | Optimus Futures
You are welcome to participate and ask questions.
Thanks,
Matt Z
Optimus Futures
thanks Matt. you have a great community
1 Like