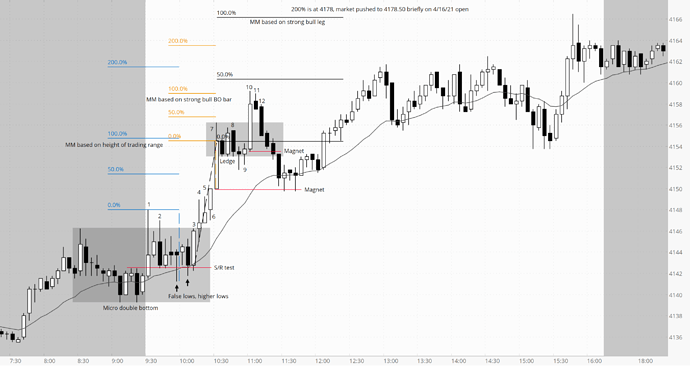
I meant to post this response that I wrote at the time to @Bhupinderjhajj’s original question earlier but forgot about it:
Many contextual factors came into play. Understanding how traders take trades in trading ranges, breakouts (and the varying quality of BO opportunities), and channels was important. Measured move targets were very important. Seeing trapped traders was also very important. As was understanding how markets tend to respond to climaxes and the magnetic effect that the start of a climax can have. Knowledge of how traders use market, limit, and stop entries to get into the market is vital. Other details include gaps and micro gaps, pullback entries, and buying versus selling pressure. Clearly this is a large list, but these are a number of contextual factors that are important and aspiring traders have to learn to recognize these concepts and others playing out.
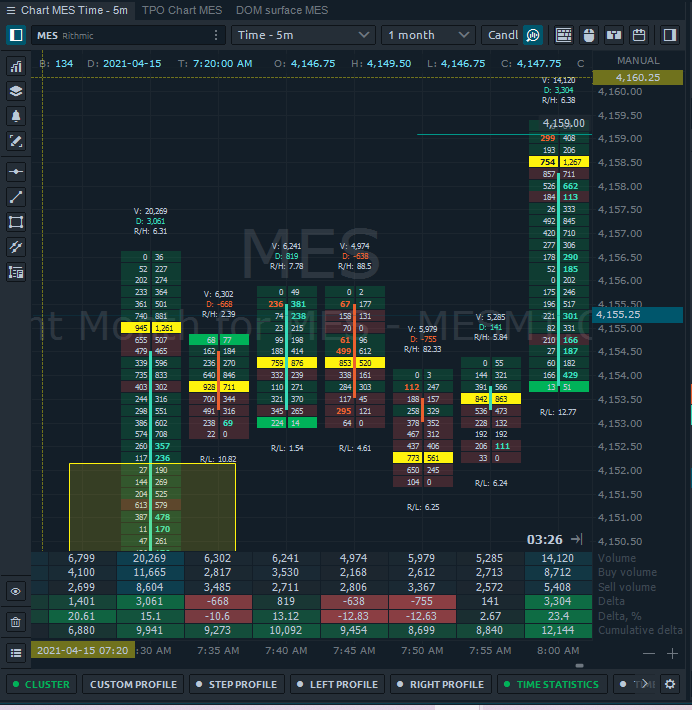
Let’s start with the first area where you saw an opportunity for a short. It was not an opportunity for a short (definitely not for an independent trader, maybe well-capitalized firms saw a reasonable short since they could scale in higher but probably not many of them given the relatively low volume). Markets can rise or fall on increasing or decreasing volume. You’re perceiving the lower volume in that area as a reduction in buying interest, but it was much more likely that strong bears were pulling their orders reducing the liquidity at those levels rather than buyers losing interest. Why am I quite confident about this? Because of what came before the market got to this point.
Now comes the very interesting stuff: Bears could have sold the high of the bear bar right before bar 3 on a limit order. If they then scaled in at the high of bar 3, they could have just barely gotten out with a 1 point scalp on their second entry and breakeven on the first since the market fell 5 ticks from the high of bar 3 on bar 4 and below the prior bear bar’s high. Based on the tails on top of bar 4 and 5, it is likely that bulls were scalping out and bears were entering on limit orders at and above the bar 1 high. The issue for the bears though was that the market was starting to successfully break out instead of being drawn back into the range. This means that the limit order short scalps that were working earlier in the session were no longer working. As a result, there were trapped bears. Notice also that the bar 5 low had a micro gap above the bar 3 high and didn’t have a lower tail, indicating that buyers were willing to buy near the highs of the range enthusiastically and bears were looking to cover their shorts potentially sooner than they would have wanted. Bears were no longer aggressively shorting the highs of the range (if they were, supply would have overwhelmed demand and prices would have fallen back into the range). Another tell-tale sign of trouble for the bears was the fact that the bar 6 open was a tick above the bar 5 close (another micro gap), indicating that bulls were willing to aggressively lift the offer. Likewise, bears who were disappointed by seeing a 3 bar bull micro channel were feeling the pain of their short positions and likely were also willing to aggressively cover their positions.
We’re not looking at the Market Profile here, it’s not necessary to do so, but if we were this open was an “open drive” at the upper edge of the prior session’s highs, which is potentially strong context for the bulls. Also consider the fact that bears couldn’t use bar 2 as a reversal on the open to drive the market back into the prior session’s value area or create a weaker open type. Many times what didn’t happen that reasonably could have is as important to understand as what did. Other time frame buyers were likely present from the open of the day and it is better to align with them.
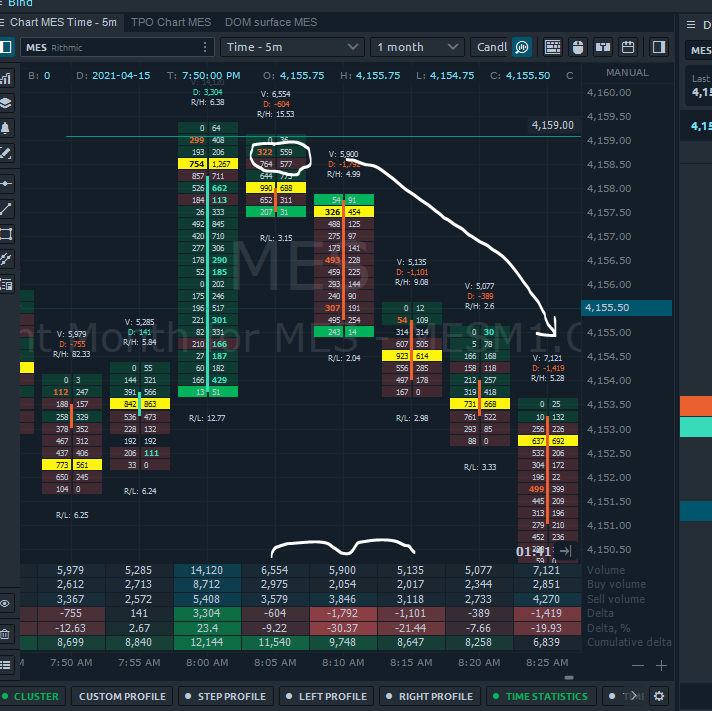
The nail in the coffin for the remaining trapped bears was seeing bar 6 close on its high (of course not all traders are trading off price action, but the market is the market, experienced traders - even if that’s programmed computers - get what’s likely going on regardless of the lens through which they’re viewing it). Bulls would already want to be buying that close, above that bar, below that bar, at the market, and now remaining trapped bears would also have to buy to cover which increases the buying pressure significantly. Remember how I said that the volume was potentially lower (I’d have to look at more of the footprint chart to see if it was actually lower or not, the volume on that bar in general was quite a bit higher than bars before it but the volumes in the yellow box do look relatively low)? Well, as I mentioned before, experienced bears would recognize the fact that the market was successfully breaking out to the upside, that bulls and bears would be buying and so there was very little reason to take a limit order short above bar 6 as bar 7 was forming. Where would they potentially look to get in instead? Potentially at a measured move up based on the height of the trading range, which contributes to the market reaching that point since bulls will keep buying and many bears will be waiting until the market gets to that point. Notice the tail on top of bar 7, this indicates possible profit taking and shorts being entered.
Between bars 7 and 9 the market mainly just paused, going sideways in a trading range (pullbacks are small trading ranges) rather than having any appreciable sell off. The market often does form a trading range for at least a few bars at measured move targets so this was unsurprising. Bar 8 formed a strong bear bar, but given the strength of the breakout that came before it and the ledge (3 bars with equal lows), it was a low probability short. The market would likely have another push up since the market cycle is breakout —> pullback —> channel —> trading range. It was higher probability to buy below that bear bar betting on a reversal to fail to get very far rather than shorting below it. After such a strong bull leg up, the best the bears would be likely to get is a bear leg in a trading range, so even if bulls did buy up there and the market went down, they could use a wide stop, trade small, and scale in lower thinking that the market would be likely to retest the highs of the trading range. Scaling in increases risk and shouldn’t be used by novices (practice extensively in SIM first!), but it can be a good management technique if applied correctly.
In this case, the second entry sell setup below bar 8 did trigger but it was a 5 tick trap. A bear that entered on a stop order below bar 8’s low of 4153.00 at 4152.75 looking for a 1 point scalp may not have been filled since the market only went down to 4151.75. Without actually dropping to 4151.50, this means that bulls were buying on limit orders at the same price where bears would be looking to get out of their 1 point scalp and not everyone would be filled there. The close of that entry bar was very weak, closing above the midpoint. Since it was still a bear bar some bears may have kept their stop above bar 8, hoping that the next bar would go down and fill their 1 point profit taking limit order. Seeing the next bar close with a bull body (bar 9, second entry buy setup) though was enough for buyers and sellers to buy. Trapped bears were squeezed out and sideline bulls had a good opportunity to jump in. In this case, the market had another buy vacuum test and climax to a measured move target based on the open to close of bar 7 (that would have been a reasonable stop area for bears who shorted the bar 7 close looking for a move to below the open of the bar which contributed to it being a potential target).
A large part of what drove the market up in that leg too was trapped sellers and bulls both buying. The break above the bar 7 high was a poor way to break out. Consecutive buy climaxes so far away from the average price also made it a relatively poor location to initiate a long position. These were also new all time highs which also made it riskier to buy there. The fact that the market was using trapped bears to push the market higher also calls into question how far the market can continue to go - who is left to buy? Aggressive bears could sell the bar 10 close and target the bar 10 open. More conservative bears would’ve been happy to see the small bear inside bar at 11. In this case, the bulls who entered high were the ones who were trapped too long and bar 12 was a give up bar as bulls sold out and bears piled on to that. Any bulls who were long from lower down would’ve also wanted to get out below bar 11 since the bar 10 low was a magnet which increased the selling pressure. The market wound up testing down to the start of the bar 10 buy climax as well as the bar 7 buy climax. Since retests of the start of a climax is a common behavior, it is unlikely that bulls would be particularly willing to buy on limit orders until that test occurred so the relative lack of buy side liquidity would contribute to the progression of the move down. Aggressive bulls may have bought below the bar 10 low using a wide stop and scaling in lower, but given the fact that the market continued down further to the bar 7 low and below the 20 EMA, most bulls were waiting for even lower prices and some stabilization of activity in order to resume buying. Once those tests did occur the market formed a small micro double bottom before forming another bull leg up, pushing all the way to a new high that was 2x the height of the trading range that formed during the open (it went 1 tick above that MM target).
So there you have it, the market pushed to numerous all time highs very likely using trapped bears as the fuel to get there.

