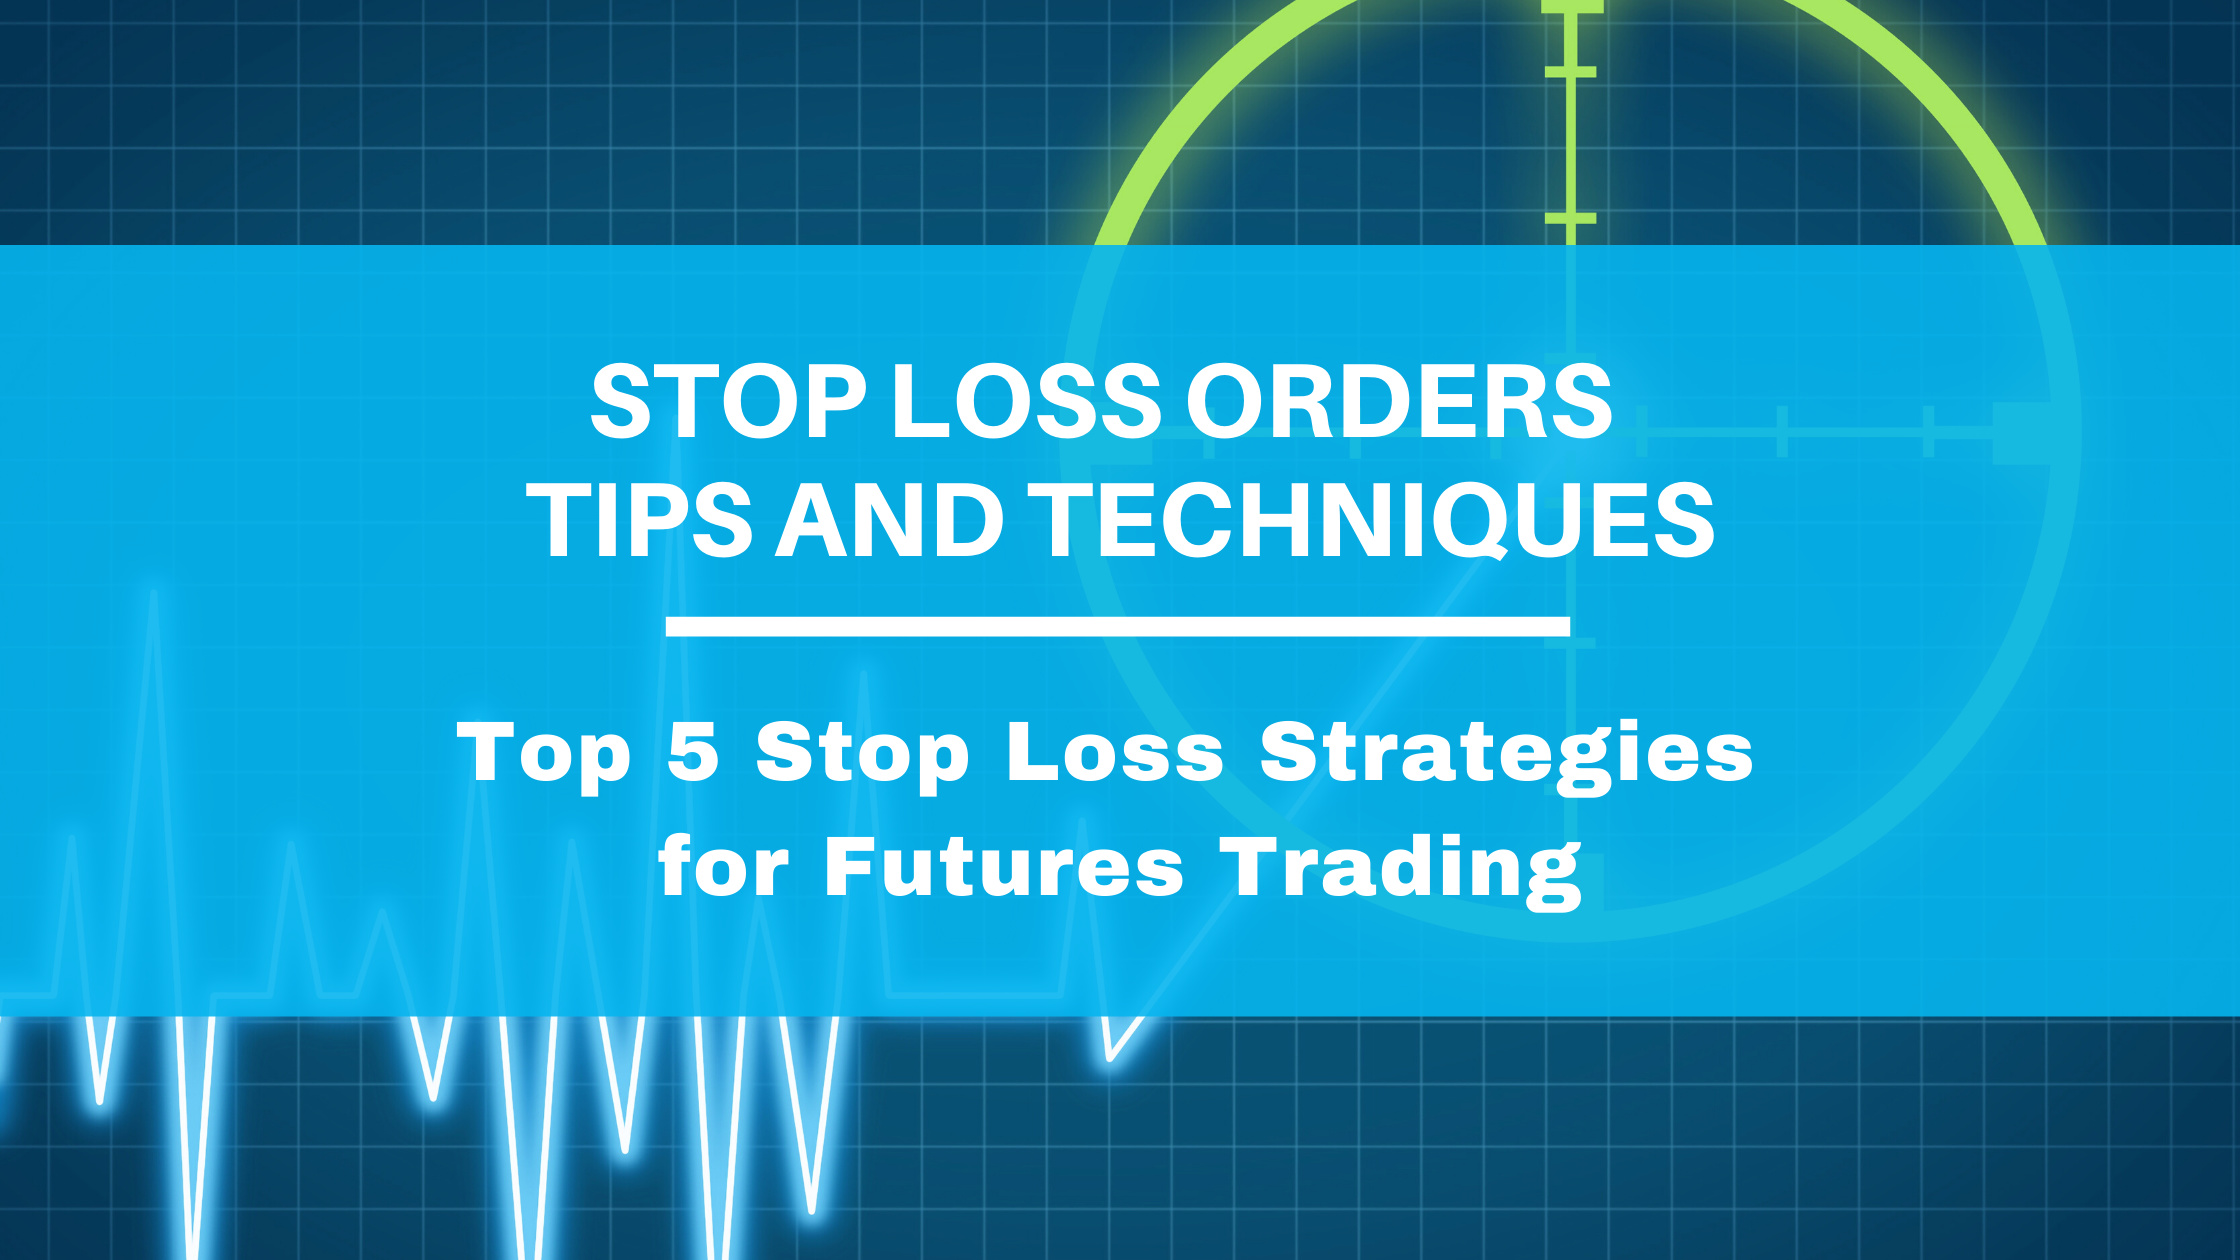
Originally published at: Top 5 Stop Loss Orders Strategies for Futures Trading | Tips & Techniques
This article on Stop Loss Orders is the opinion of Optimus Futures.
Takeaways:
- Stop-loss placement is a critical component of a sound trading strategy.
- Failure to understand the full context surrounding stop losses can place you at a significant disadvantage.
- There are many indicators that can help you evaluate stop loss choices, some may be better for specific time frames, and some may be more objective/subjective than others.
One of the first things we traders learn is how to place a stop loss. An effective stop loss strategy helps stop the proverbial bleeding when market direction turns against you, cutting into your account balance.The idea of placing a stop loss is pretty simple but choosing the right place to set a stop loss can get challenging. On one hand, it is a matter of picking a price level beyond which a trade bias is no longer valid.On the other hand, depending on the complexity of your trading approach, you may need to integrate it into your trades from a more strategic level (especially if you are unloading partial positions or if you are trading multiple markets at once).That’s what we’ll discuss in this piece: so-called “best practices”; tips on what you can do to potentially improve your stop-loss strategy, and things to avoid when placing stops (and why). Disclaimer: The placement of contingent orders by you or broker, or trading advisor, such as a “stop-loss” or “stop-limit” order, will not necessarily limit your losses to the intended amounts, since market conditions may make it impossible to execute such orders .
How to Use Stop Loss in Futures Trading
Some of the rules to follow may seem commonsensical and perhaps too basic for some of you. But successful trades often depend on not violating basic rules and principles. With that said, no rule is too basic to avoid revisiting every now and then.
Place Your Stop Loss Before You Place Your Profit Target
If you open a trade, say, at the market, that trade can only do one of two things: go up or down. If it goes up(and you are long), then the position–a winning position–can “take care of itself” until you set your “take profit” level. If it goes down, then you have to make sure it doesn’t sink below your risk limit.
For that very reason–the one that argues that profits can take care of themselves, while losses need to be managed more carefully–it makes sense to, perhaps, place your stop loss first before setting your profit target (wouldn’t you say?).
In most trading scenarios, your profit target is further away than your stop loss level(risk:reward ratio). It may take longer for the price to reach your target, while triggering your stop loss may come sooner if your trade does not work out.
So, place your exits in order, with your stop loss first. In cases where you have ultra-small profit targets (say, a tick or two) and equally small stop-loss levels, use a bracket order and do not place your stops manually.
The Number One Rule in Selecting Your Stop Loss Level
Later in this article, we are going to cover many indicators you can use to select your stop loss (and profit target) levels. Regardless of what these indicators say, there is one overriding rule that should define where to place your stops: your stop loss should be placed at a level beyond which your trade market bias is no longer valid .
Nothing should override this basic principle. This is our opinion.
For example, you are trading the ES contract, where one point is equivalent to $50 per contract. You enter a long position 10 points above support. Your bias is upward (hence, you have a long position), and the only movement that might make you change your bias is that price falls below support which is 10 points below your entry price.
Well, that would cost you $500 if you are wrong. Problem is, you have a small account and can only afford a $400 loss (8 points away). Do not do it. Do not take the trade. If you do, there is a chance that you might get stopped out, only to see the ES move back up once it reaches support.
In this example, you violated the #1 rule in placing a stop loss: you set your stop based on your own money versus the actual market level. Your stop had nothing to do with your trading thesis, and everything to do with your lack of funds. In a case like this, just don’t take the trade, or wait for the price to reach a more “affordable” level (if it doesn’t, move on to the next trade).
The same rule applies to placing your profit target (your limit order to take profits). We understand that some traders base their profits on a percentage or dollar gains. This is more acceptable than taking a dollar-based stop over a market-based stop level.
But if you truly have a sound trading thesis, one that sees a profit target based on an objective level–be it a technical level, a fundamental condition, or an economically-driven event (e.g. an economic report)–then such levels would be less “fuzzy” than a dollar or percentage gain. Ultimately, this is up to you and your trading goals.
In general, the market is uncertain enough that adding more “fuzzy” to the mix often doesn’t help. So, get rid of it wherever you can, especially when stemming losses and taking profits.
You Cannot Predict Market Outcomes, But You Can Manage Your Downside
It goes without saying, one critical aspect of making money is not losing money. A similar saying from the domain of military strategy (and even sports) is that you can’t always force a win, but you can maintain a solid defense while you await an opportunity to launch a strong offense.
Trading isn’t that much different when it comes to balancing risk and opportunity. When placing a trade, don’t be overtaken by either optimistic or pessimistic sentiment. Be objective and focus on managing your downside. It is the only thing that you can control. Let time and the market take care of your profits. Do not let an over-focus on profits be your undoing.
Using Fixed Stop or Profit Points is Very “Cookie Cutter” …But There’s No Such Thing as a Cookie Cutter Market
Similar to the Number One Rule mentioned above, using a fixed point value (say, 10 points on the YM, or 4 points on the ES, whether for taking profit or stopping losses) is a dangerous and, to be frank, “lazy” practice. Different markets have unique characteristics and volatility and momentum can vary significantly.
Depending on the overall liquidity of a given instrument, or the focus on a given market (say, the E-mini Russell over the Nasdaq), each contract will have its own unique volatility characteristics. Of course, before trading a given instrument you might already know that, assuming you did your research.
With that being said, it makes sense why such a “cookie cutter” approach won’t work–no market has cookie cutter characteristics.
You Can’t Size Your Position Without a Stop Level
Here’s a pop quiz: You have $20,000 in your account and you want to risk only 2% ($1,000) on any given trade. If you’re trading the YM (which ticks $5 each point), how large would your position size be if you were to trade any one of the scenarios?
- 50 point stop loss: 8 contracts
- 100 point stop loss: 4 contracts
- 5 point stop loss: 80 contracts
How did I figure that out? Risk ? (Stop Loss Points x Dollar Per Tick Value) = Position Size. So if you were risking $2,000, and if your stop loss is 5 points, then 5 points x $5 = $25. 2,000/25 = 80 contracts.
Now, you can’t perform this type of calculation if you don’t know how many stop-loss points you’re working with. Perhaps this is one of the most important reasons to always have a stop loss in mind.
Without a stop loss, adequate and precise position sizing would be nearly impossible. The position size is always based on the distance of your stop-loss order and the number of futures contracts you hold. Without knowing the stop distance, you have no control over your position size .
And even using a “mental” stop loss is not good enough because executing your mental stop just a few moments too late can eventually reshape (or deform) your original risk management strategy.
Plus, being able to calculate your position size can potentially help protect you against larger losses and damages to your “emotional capital.”
Your Risk-to-Reward Should Reflect Market-Based Stops and Profit Targets…Not the Other Way Around
You see a trade in which a profit target at resistance is only 20 ticks away, but whose stop loss at support is 40 ticks away. That’s 2 units of risk for 1 unit of potential reward. Suppose your trading strategy calls for 2 units of reward for every 1 unit of risk. Your situation is reversed, and you’re risking more than you can potentially win.
So, you decided to move your stop loss up to only 10 points. Now your reward-to-risk is 2 to 1. It doesn’t work that way. Just because you moved up your stop to create a better risk/reward scenario doesn’t mean that the market isn’t going to trade all the way down to support.
You increased your probability of getting stopped out at a loss. You’re now potentially at greater risk despite making your risk/reward ratio more favorable.
Remember: the market defines your risk/reward, not the other way around.
In other words, a bad trade does not suddenly become a good one by manipulating the reward to risk ratio. Professional trading is all about developing good habits and adhering to your trading rules and knowing when not to trade is a key attribute of professional trading.
Trailing Stop Loss Strategy – Pros and Cons
There’s a benefit to automation, no doubt. When you’re busy managing several trades, or several aspects of a single trade, automating your stop-loss via trailing stop can help take the decision making process out of your hands.
This is also called a floating profit-taking strategy. When you’re in a profitable position, instead of placing a hard limit order to take profits, you instead let your trade run while trailing the stop behind the current price, eventually closing your position at a profit. This works well when the market is trending, but it can also cap your trade’s profit potential.
This can be a good thing, especially if you have a winning trade. But what if your trailing stop is only 5 ticks away and support is 7 ticks away? What if those extra 2 ticks might have allowed you to see the market go up further? On the floating profit side, what if actual resistance was higher than your floating profit target?
Don’t Make Yourself a Target for the Pros
Have you seen the 1986 documentary on currency trading titled Billion Dollar Day ? If not, you can watch it on YouTube by clicking here. ( We do not endorse or recommend the use of any product that is external to Optimus Futures. Please conduct your own due diligence).
If there’s anything you can learn from this documentary, it’s that professional traders do a lot of “stop-loss hunting,” and in this case, they target other professionals (as currency trading in the 1980s happened in the interbank market only; no retail trading access was available then).
So, what might that tell you? If you place your stops like an amateur–making your stops “too obvious” –you’re likely to get stopped out by other retail traders or even pros who go stop “hunting” for your position. This could potentially be done with large quantities during illiquid periods, and/or with algorithmic/HFT based strategies.
Placing a stop loss just below and above a very obvious support/resistance level, choosing a round number, using common moving averages, or basing your stops around obvious candlestick patterns are favorite hunting grounds for these types of predatory traders (come to think of it, what trader isn’t, to some degree, “predatory”?).
Professionals are very good at spotting price levels where the majority of traders place their stops and squeezing amateurs out of their positions.
So, what might you do? Don’t be so obvious. Get 2 or 3 barriers (support/resistance levels, other technical concepts, or price action) between your entry and your stop loss AND add a bit of padding. Often, this means that your stop will be further away, but it also means that it is potentially harder to target by short-term stop squeezes.
Five Stop Loss Strategies for Trading (Intraday or Swing)
Now, let’s cover the tactical end of the stop-loss placement. Here are five techniques you can use to place stop losses. How you use them and how you mix them up is entirely up to you.
Please note that it does not matter how we define the trade entry in the examples below. They are just meant to provide context for setting stop-loss orders. In other words, make sure that any of the following techniques you decide to use is in line with your trading approach and risk tolerance.
Disclaimer: The placement of contingent orders by you or your broker, or trading advisor, such as a “stop-loss” or “stop-limit” order, will not necessarily limit your losses to the intended amounts, since market conditions may make it impossible to execute such orders.
One – Moving Averages
Applications: Intraday, swing, and position trading.
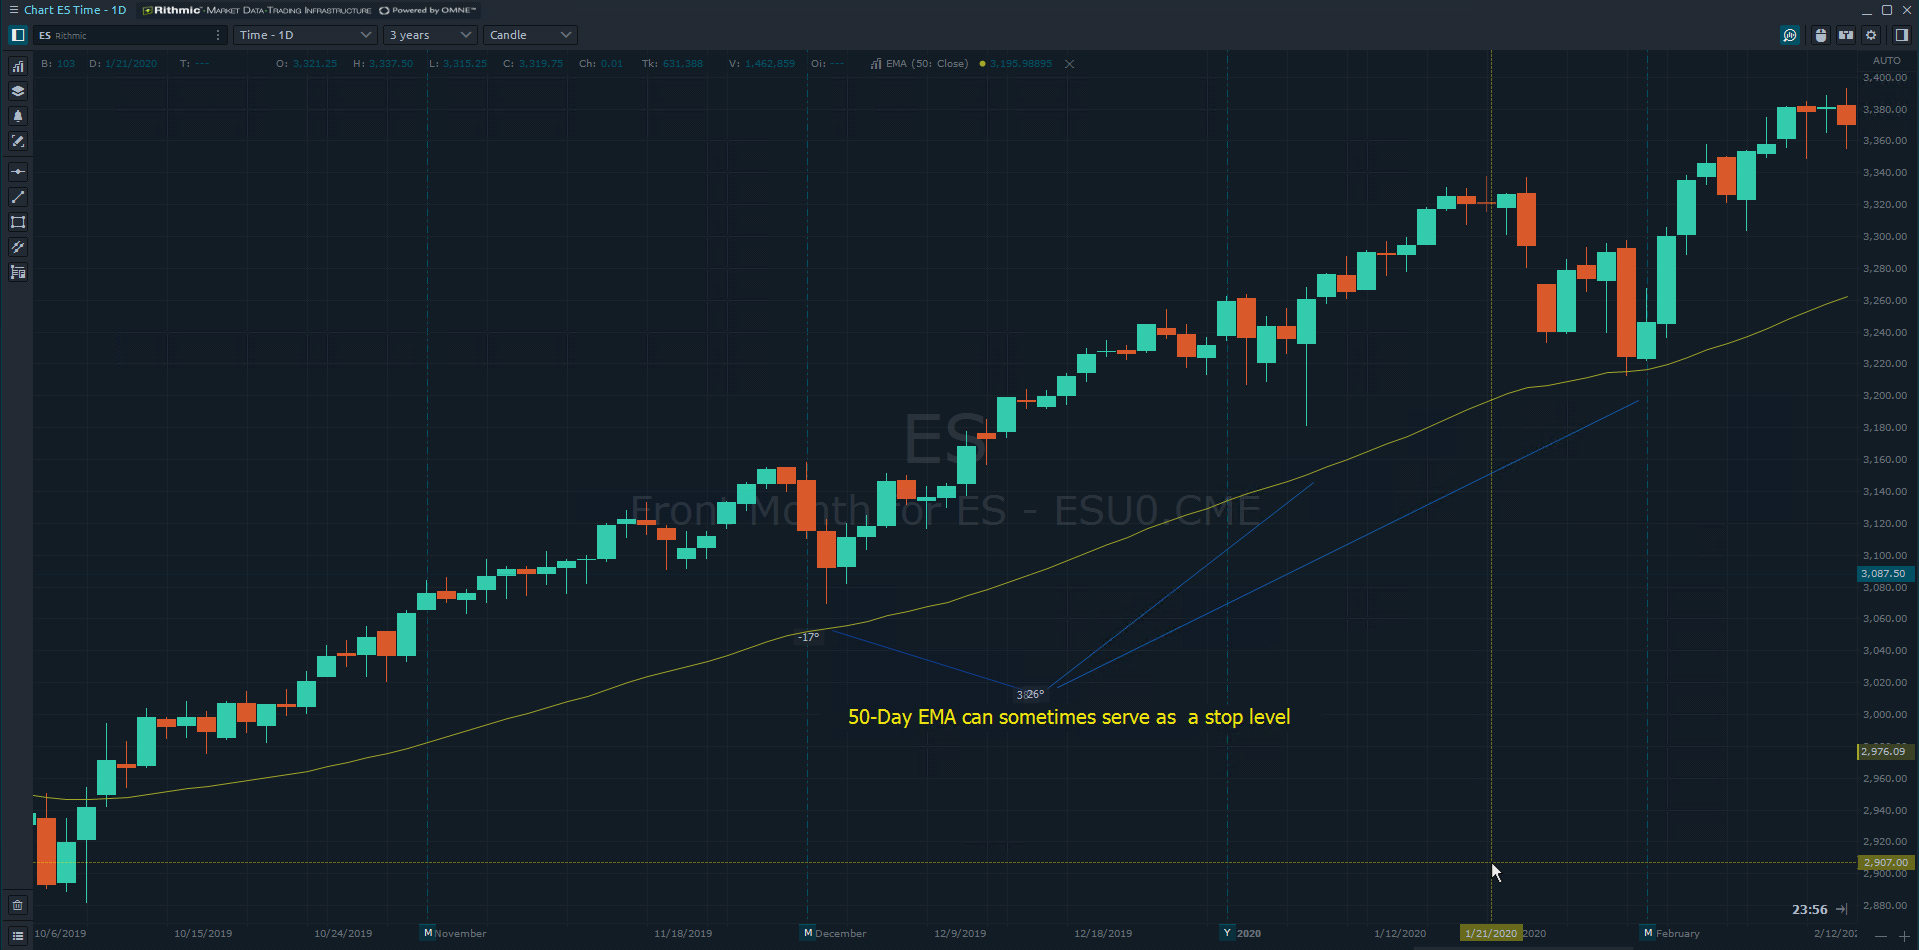
Moving averages are a popular technical analysis tool to measure the strength of a trend over different time periods. Trend traders sometimes use up to three moving averages to measure the short-term, intermediate-term, and long-term trends. For example, a trader may choose to use a 10-day moving average for the short-term trend, a 50-day moving average for the intermediate-term trend, and a 200-day moving average for the long-term trend.
In the example above, a trader is using the 50-day exponential moving average to trigger potential trade exits by placing a stop loss below the average. Using the 50-day EMA is a popular technique that helps traders “trail” their stop losses. But like all technical indicators, it’s not a fail-safe method as the price can sometimes violate a given average and continue moving in the original direction. So analyze the wider context of the market when using moving averages to aid in entering and exiting positions.
Two – Natural Swing Points
Applications: Intraday, swing, and position trading.
Every trend travels in a series of pullbacks and breakouts. For instance, an uptrend can be defined as a series of higher highs and higher lows. A downtrend, in contrast, is a series of lower lows and lower highs. The highs and lows are what we call “swing points,” and they often act as support (swing low) and resistance (swing high), making them ideal for trade entries, stop losses, and profit targets.
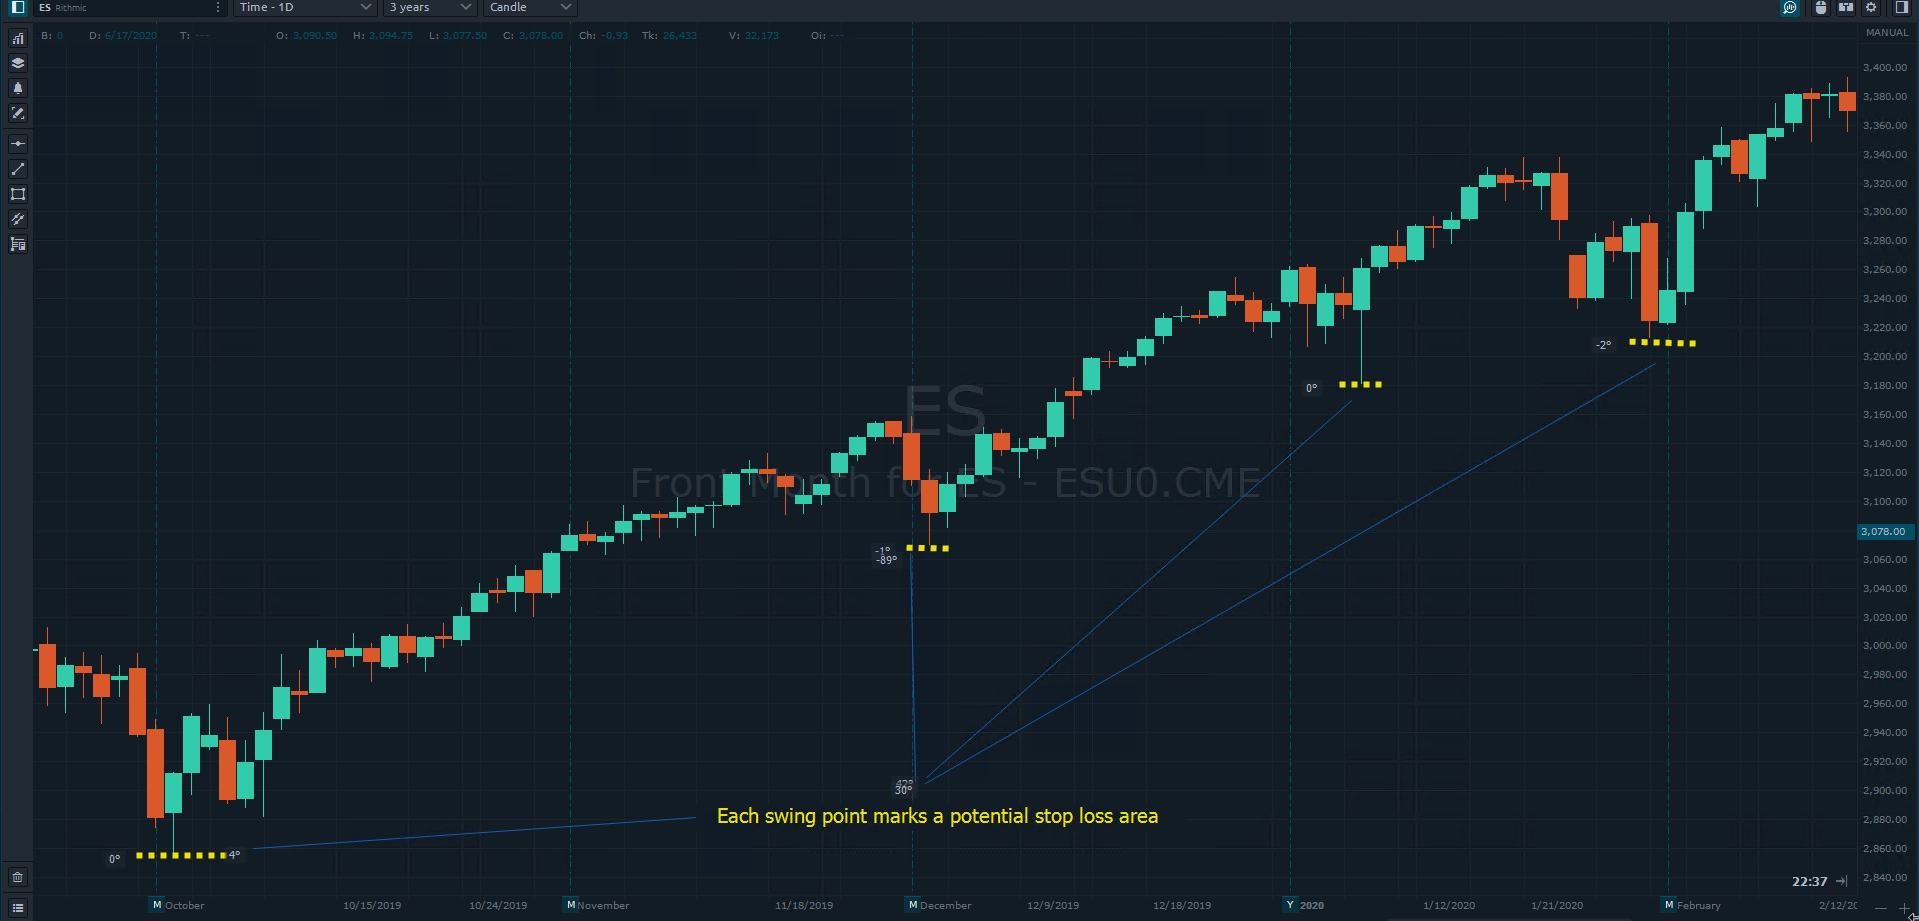
In the example above, I highlighted the swing low points that can serve as natural stop-loss points. The logic behind this is simple, if the price fails to make a new high and falls below the previous swing low, then we may no longer have an uptrend. In other words, the “long” trade thesis is no longer valid. The reverse is true for a down-trending market. Hence, swing points make for effective stop losses and trade entries.
Three – Fibonacci Levels
Applications: More effective for swing and position trading.
Using the Fibonacci stop-loss approach is especially interesting because it offers a more objective way of placing stops. Whereas a trader has to make a number of subjective decisions, such as when to move a stop based on the moving average or swing strategy, Fibonacci levels don’t have this component.
[
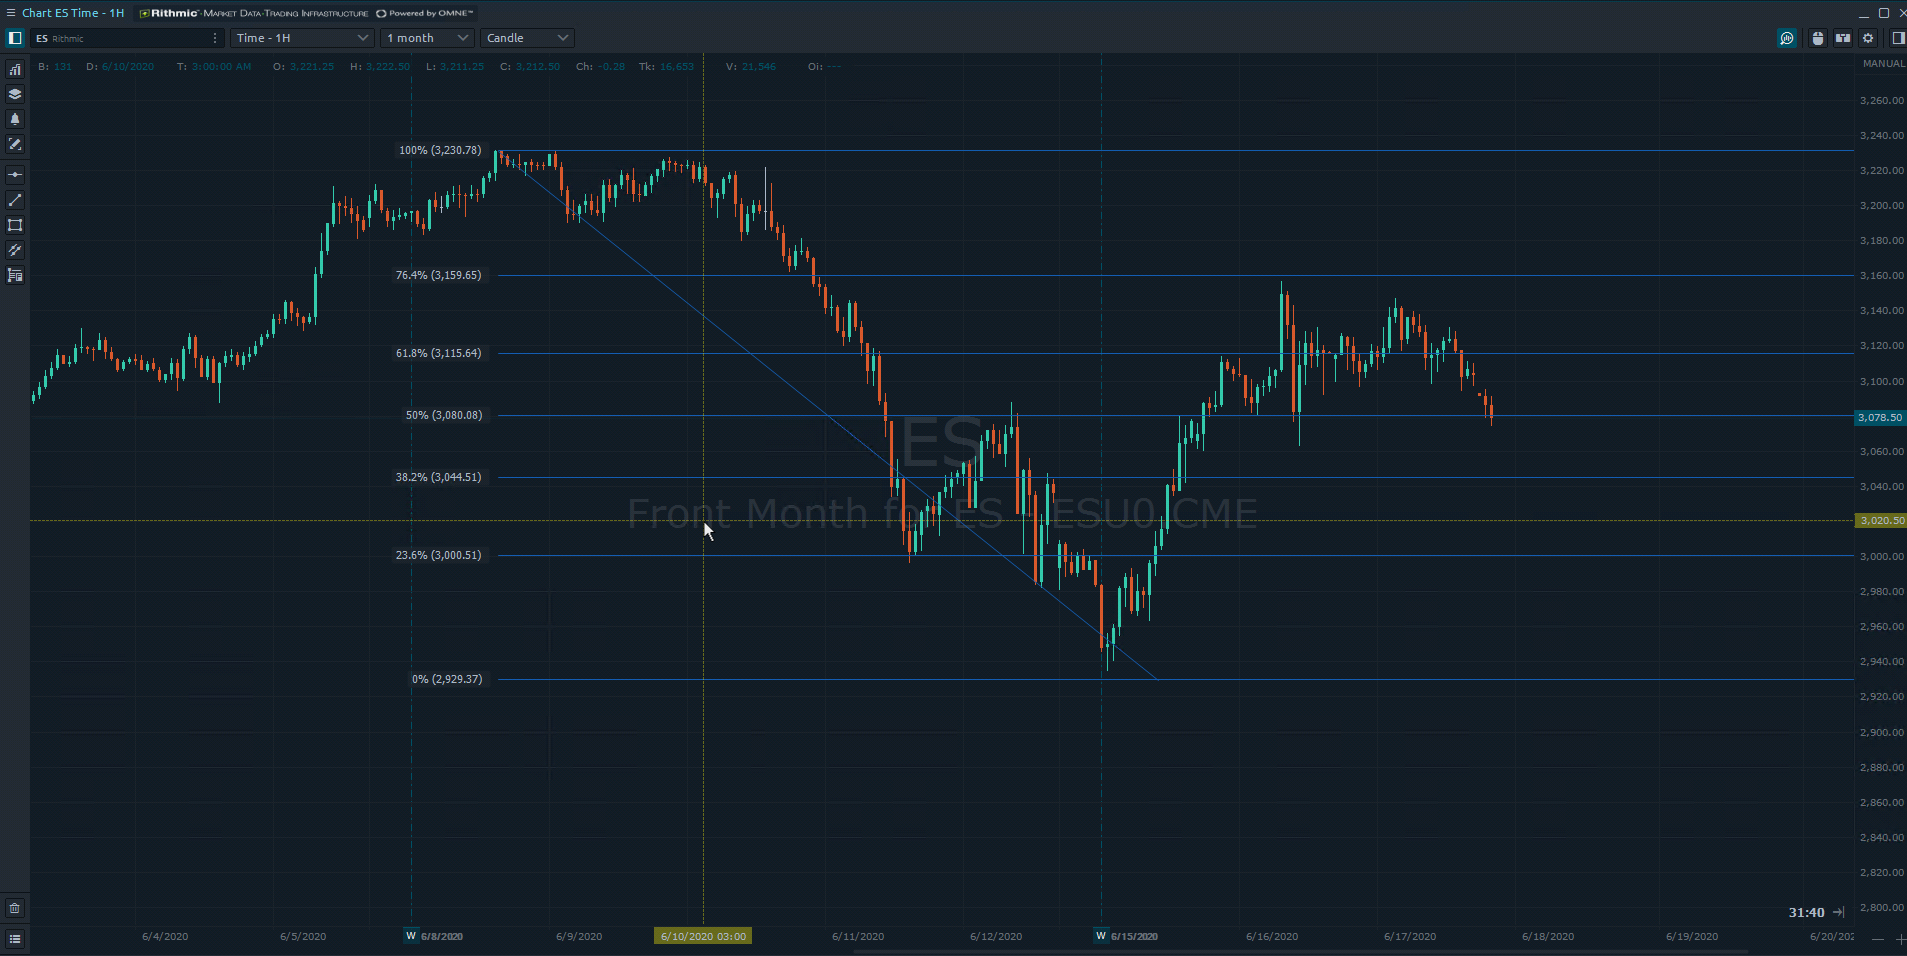
Once a trader has drawn his Fibonacci levels, they don’t move, making potential stop-loss levels more well defined. When price retraces (has a pullback) it can mean several things based on three commonly observed numbers: 38.2%, 50%, and 61.8%.
- A pullback to the first level (38.2%) is considered pretty light, meaning the price falling below it is common, often anticipated. It’s not a great place for a stop loss, but a good place to enter a position.
- A pullback to the 50% level is perhaps the first “critical” level, as both “long” and “short” traders may be holding profitable positions. This level makes for a good entry-level and an initial stop level as price often bounces back from this degree of retracement.
- A pullback of 61.8% may be a solid stop loss level (and not so good an entry-level) as the directional bias is now in question.
Four – Pivot Points
Applications: Intraday and swing trading.
Pivot points were developed by floor traders in the years before digital charting. Perhaps they held more significance when most markets still had a “closing” period and were not traded on a 24/5 basis. These points are objectively derived but their theoretical basis is highly subjective.
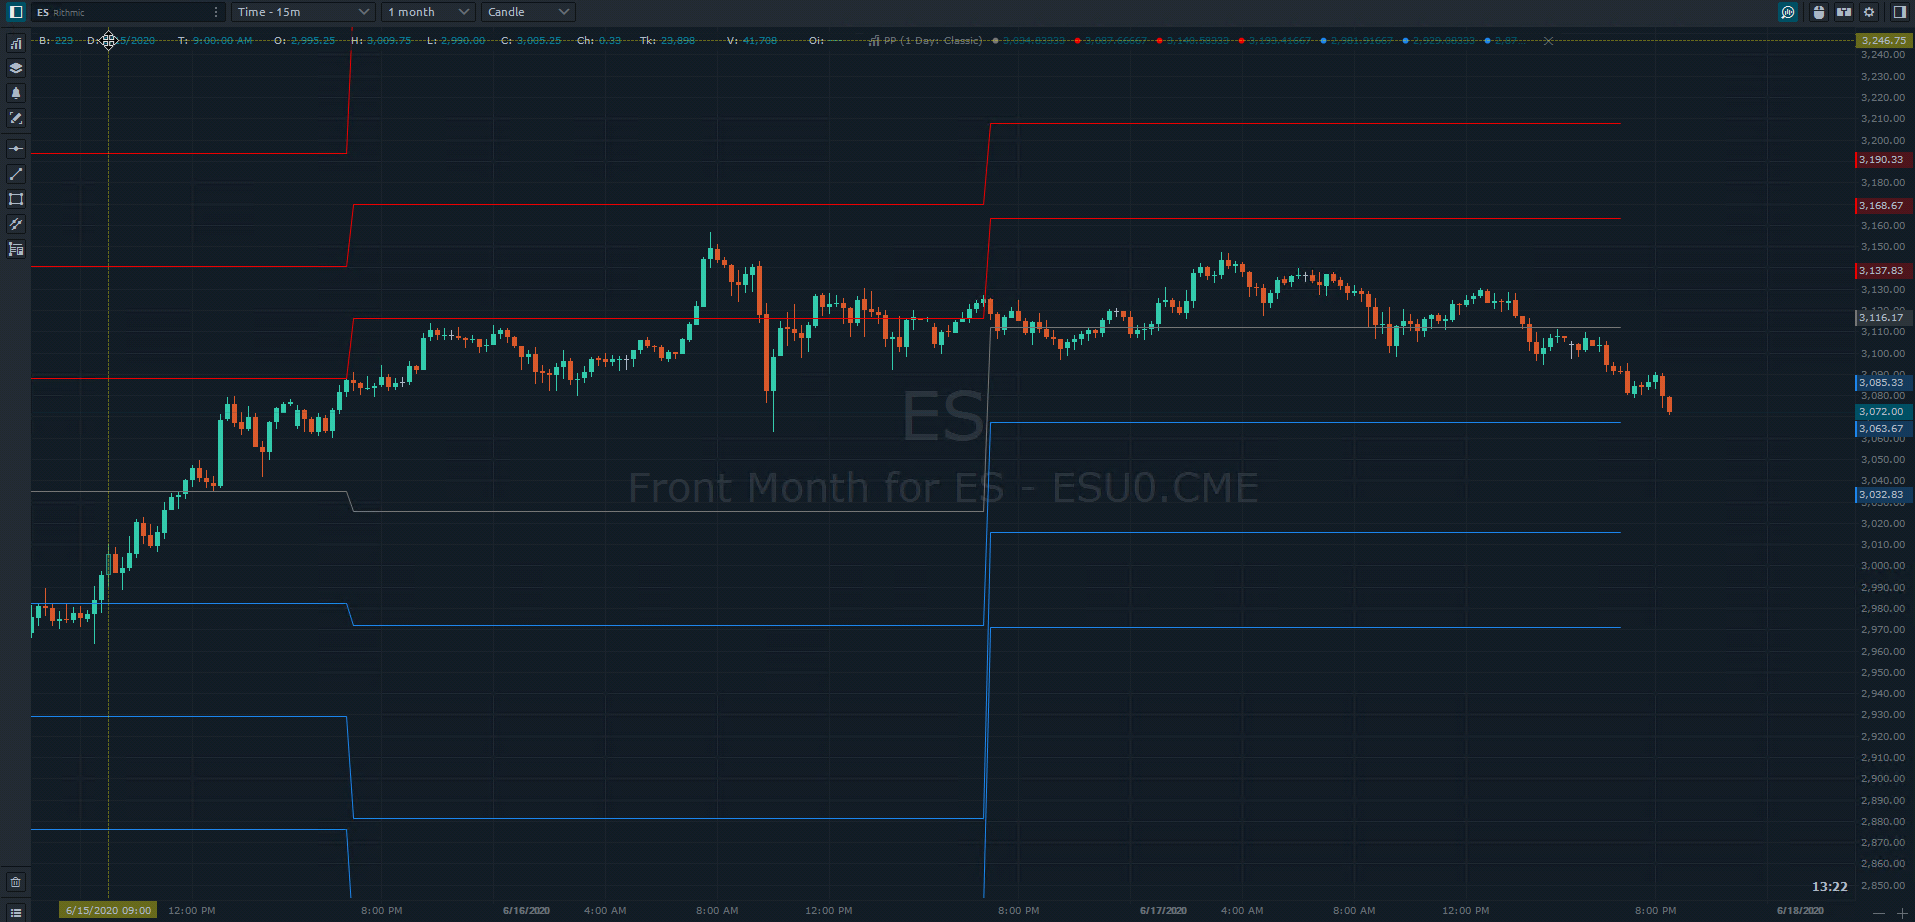
Nevertheless, you can use them to set stops and entries depending on how you choose to interpret pivot points and their use.
Five – Average True Range
Applications: Swing and position trading.
Average True Range, or ATR, measures the average distance of highs and lows in a given time period. Hence, it’s a measure of volatility. When a market is less volatile, the distance between its high and low is probably more narrow than when it experiences high volatility.
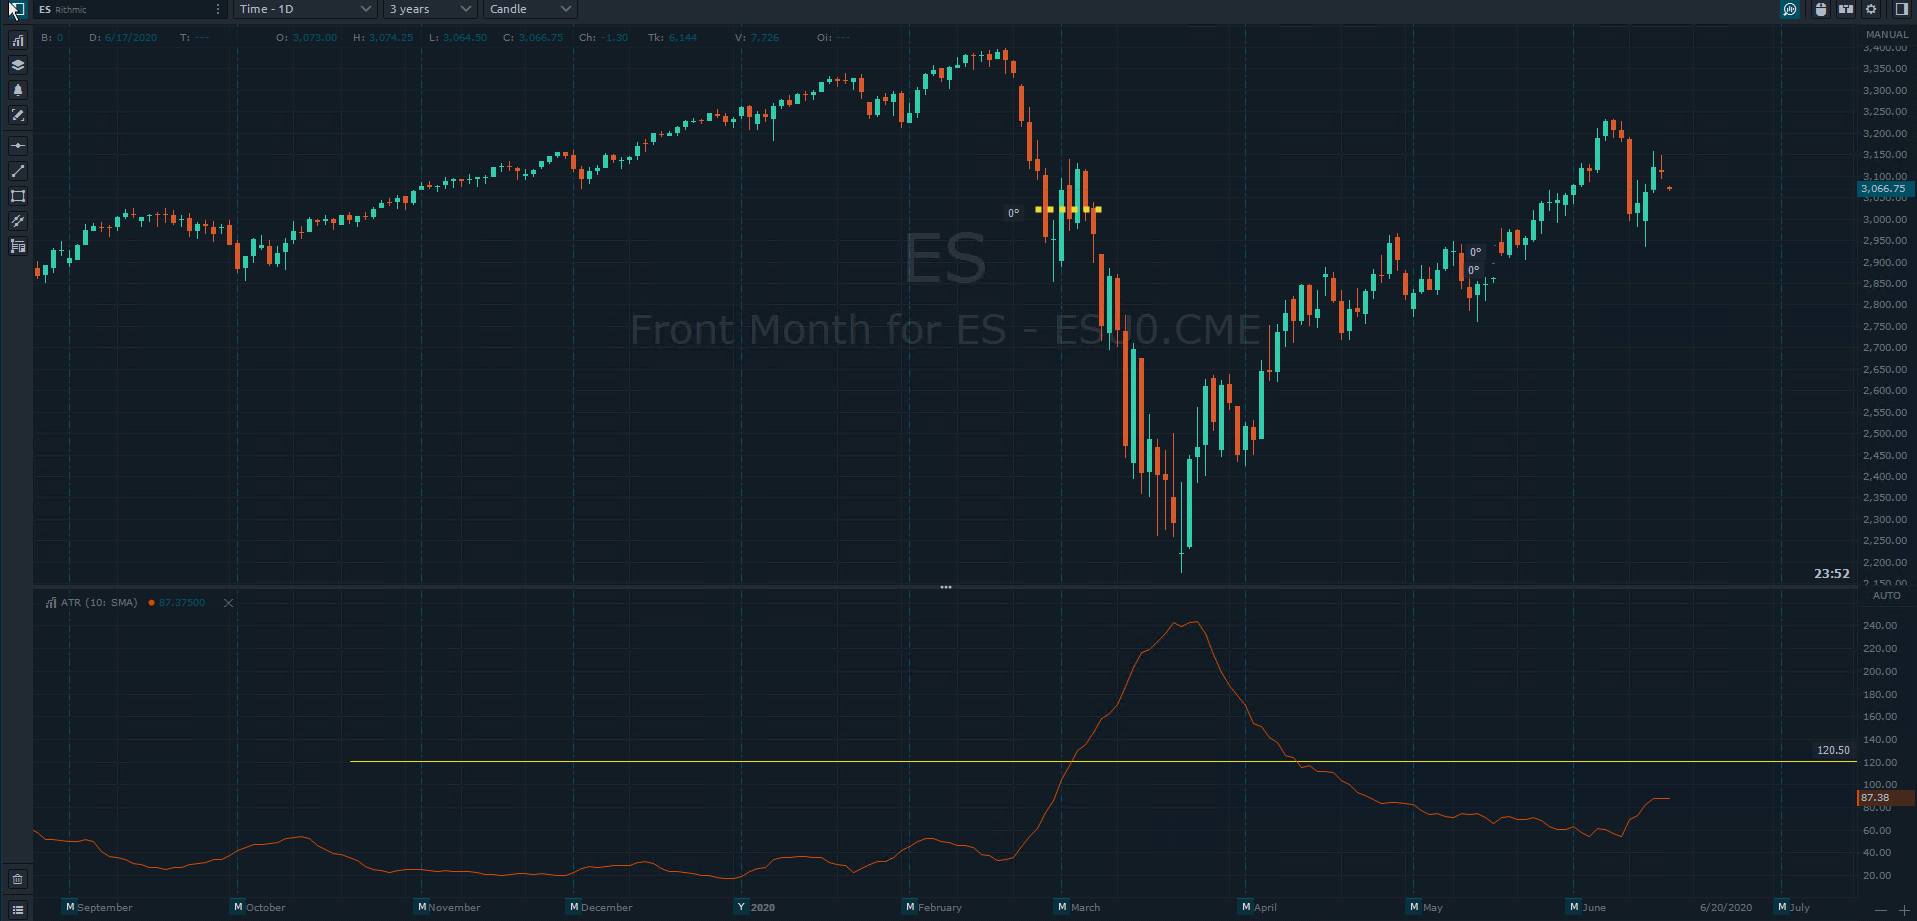
There are many ways to use ATR as a volatility stop. In the example above, the trader has a long position and is following a 2-week ATR. When price reversed, range volatility increased by 100% (from 60 to 120), signaling that it was time to get out.
An increase in ATR readings can signal different things as volatility is driven by different fundamental factors. So choose your volatility-style stop carefully, and know that volatility itself–which can be driven by fundamentals, sentiment, or both–can often give mixed signals.
The Bottom Line
Stop-loss order placement is critical to trading success. As you can see, this rings true for more reasons than just “stopping losses.” There are many ways to go about it, many ways to make stop losses effective or vulnerable (as in the case of stop hunting). However, you decide to proceed, be sure to understand the various ways in which you can place your stops and match the right method to the appropriate context, all of which should be in harmony with your personal trading strategy.
There is a substantial risk of loss in futures trading. Past performance is not indicative of future results.