Originally published at: https://optimusfutures.com/tradeblog/archives/how-to-set-up-your-trading-screen/%20
he following article on Trading Screen Setup is the opinion of Optimus Futures

This may seem like a strange analogy to some, but there are a few key similarities that we can draw between a day trader and a fighter pilot:
- Both operate in risky environments (the trader assuming financial risk; and the pilot, physical risk).
- Both functions rely on the speed and depth of observation, orientation, decision, and action (more famously known as the classic OODA Loop decision cycle); and
- Both operators (i.e. trader or pilot) must handle their “platform” naturally and intuitively as if it were an extension of their own bodies.
The second bullet point above is key, as it tells you which characteristics are more attributable to the operators and which rely heavily on their trader machines:
Observation and Action are platform characteristics: a platform must allow you to see what’s taking place in the “outside” world at a rapid pace and comprehensive scale. Furthermore, its dashboard must allow you to act in as seamless and intuitive a manner as possible; that is, unencumbered by any tools or instruments.
Orientation and Decision are operator characteristics: you must have the capacity to react swiftly and decisively to the changing environment.
Essentially, you and your platform functionally perform as one. Hence, your choice of platform and your ability to master and maneuver your platform are critical components in your performance.
So why draw this analogy? To emphasize not only the importance of speed in decision-making and execution while deliberately engaging with risk, but also to punctuate the critical factor of “merging” with your platform while in action, particularly when seconds (or even microseconds) count. Remember that both areas are often described in accordance with two states of being: the quick and the dead. You’re simply one or the other.
Trading Screen Setup
With that said, what is the best way to accomplish this type of “merge” between your actions as a day trader and the technology you use? Let’s begin with your trading screen. A scalper’s trading screen setup can’t be disrupted by the very platform it relies upon to engage the markets. The same can be said of swing traders, though they typically have more time to observe market opportunities and make decisions (as they hold trading positions longer than the average scalper).
So, what’s in a platform and futures trading chart setup? What significant criteria should we consider when building our trading screen setup? Here are ten things to put on your checklist.
1 – Should I Use a Modular Chart or a Fixed Chart?
First let’s define the difference between a “modular” and “fixed” chart.A modular chart can be reconfigured; you can move different windows–order entry, DOM, price information, market news, etc.–around to suit your needs. A fixed chart dashboard may have some adjustability, but overall, it’s relatively fixed; meaning, you can’t really change it beyond the platform provider’s range of customizability.Modular charts present more choices than fixed charts. But you might want to ask yourself why you’d opt for a modular chart rather than a fixed one. Here are a few reasons why you might consider the flexibility offered by a modular setup:
- You find the default layout to be insufficient in terms of the necessary data.
- You find the default layout to be non-intuitive or unworkable.
- You plan on adding more windows (e.g. charts or data boxes) to your dashboard.
- You have more than one monitor and need additional and customizable data windows to populate the other screen(s).
Although there are more reasons to opt for “modular,” these are just a few of the major reasons why you’d prefer a more customizable day trading setup.
2 – What’s the Best Monitor Size for Trading?
When viewing a chart, you are looking at two forms of visual data: graphic shapes and text. As obvious as this may seem, both visual forms present different challenges, particularly with regard to screen color which we’ll discuss later.
When it comes to monitor size, you have to consider a) how much data you are viewing on separate windows and b) how the number of individual windows (or data boxes) affect your ability to view them.
If you are dealing with lots of numbers such as price, order flow numbers, or any other indicators expressed numerically, then you might consider a larger monitor. Your choice can range from 14 inches to 34 inches. Ultimately, the best monitor size is any size that allows you to view data clearly and quickly (especially if you’re a day trader who must make trading decisions in a rapid and decisive manner).
3 – How Many Monitors Should I Have?

Do you need just one monitor or two? Part of this decision refers back to the last two conditions we just discussed–namely, whether you have a modular or fixed chart, as well as the size of your screen.
If your chart is modular, then you have the capacity to add more windows or boxes to your screen. There’s a point beyond which a single screen may seem inadequate, preventing you from viewing your data or acting on your data by virtue of the small size of graphics or cramped controls on your dashboard. When money is at stake, it would make sense to avoid such inconveniences by simply purchasing a second monitor.
If the size of your screen is greater than the standard 15 inches, then perhaps one screen may suffice. However, traders sometimes opt for modular charts for “additive” purposes. If this describes your situation, then think of the worst thing that can happen: two monitors may add some value, but one monitor may impede your trading capacity. If the potential negative payoff is much greater than the positive payoff, then avoid the situation that can bring about the negative payoff, and purchase a second monitor.
4 – Which Time Frames (and How Many) Should I Display?
First, let’s think about the purpose of watching different time frames. Generally, there are three: to make sure you’re not on the wrong side of a larger trend, to make sure you’re not jumping the gun on a given directional bias when a shorter-term trend is currently going against you, and to trade when two or three trends in different time frames converge .
Take a look at this 15-minute chart on Gold Futures (GC):

But if you look at the daily chart, you get a different picture:

I think you get the point. You look at different time frames to see what’s happening in the big picture, the smaller picture, and to find where the different time frames may be in agreement.
Let’s talk about the last point: supposing you’re a swing trader who trades the hourly chart. If your one-hour chart, 15-minute chart, and daily chart show that the trend is moving upward, then the probability that the market may move upward is much more convincing than, say, if only one chart shows an uptrend while the other two are trending downward.
So which time frames might you want to follow, assuming that such a thing is important for your trading? One standard approach would be to select a lower and higher time frame from the one you are currently trading. If you trade the 5-minute chart for a quick scalp, you might want to view a tick chart or 1-minute chart while also viewing the 15-minute and perhaps even the 1-hour.
This is not rocket science, it’s all pragmatic. The main point is that you don’t want to get sideswiped by something that you should have seen but didn’t. And your time frame preferences really depend on your trading strategy, platform capacity, monitor size (or a number of monitors), and personal ability to digest all of the information that you’re looking at.
5 – What Contracts Should I Use for Benchmarking?
When it comes to benchmarking, you’re thinking of correlations and Intermarket analysis. Here’s something to know: not all correlations are fixed. For instance, gold moves inversely to the dollar, but its correlation varies when compared with the broader market (such as the ES) or even–believe it or not–inflation. Yes, gold prices have been known to rise during periods of low inflation.
So when choosing a benchmark, not only must you have a reason to benchmark a specific market (or markets), you also have to understand something about the fundamentals affecting both markets.
For example, if you’re a precious metals trader, then you might want to follow both gold futures and silver futures–to monitor the Gold-Silver ratio–but also the US Dollar index futures while paying close attention to every Federal Reserve announcement.
If you trade the ES or NQ, then you might need to follow equity index ETFs to see what’s happening with any of the 11 market sectors (particularly the Semiconductors industry and Tech). In certain economic environments signaling a potential recession, you may want to follow the 2-Year and 10-Year Treasury yields.
If you trade agricultural products for which China is the main purchaser, then it might help to follow the Shenzen or Hang Seng index, the USD/CNY (dollar-to-yuan) FX rates, plus any US agricultural and farming news, Chinese central bank decision, and reports on the overall geopolitical climate.
As you can see, there are quite a few possibilities, and they all depend on how comprehensive a scope you want to achieve.
6 – Do I Need a News Feed?
It’s one thing to follow news in the background, it’s another thing to have a news feed running on your screen. As a general principle, you can receive more news than you can possibly digest in one trading day. Many news feeds can provide a stream of endless headlines, most of which may require energy to “ignore” (let alone pay attention to) by virtue of the sheer volume of text running across your screen.Unless you trade multiple markets (or trade multiple stocks) and have lots of time in between trades, then you might have time to actually pay attention to most news items. Otherwise, if your approach is purely technical, or if your trading decisions rely on the bigger picture, then it might suit you better to have financial news on TV running in the background while minding all relevant economic reports scheduled for that day.One solution that we at Optimus Futures are offering clients is Optimus News. It was designed not only to provide a comprehensive scan of the market environment but to help you tactically navigate the sometimes rough and volatile landscape of news-driven events.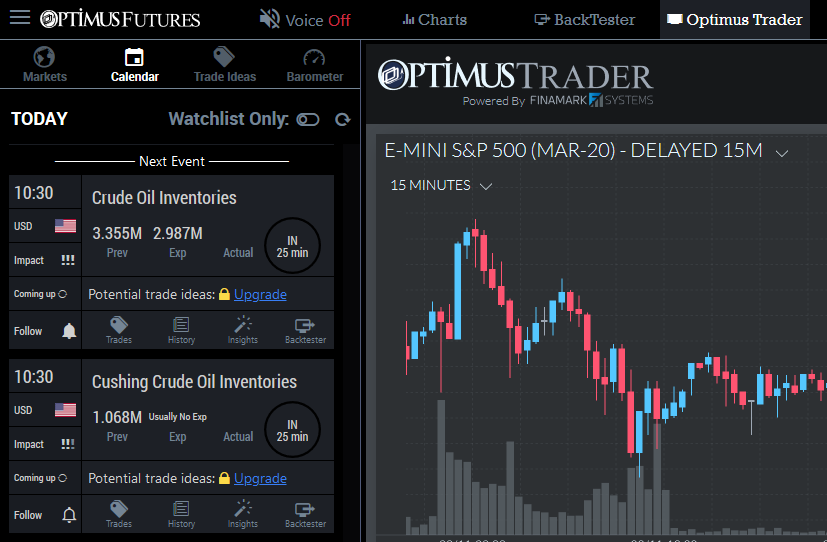
7 – How Many Indicators Should I Have at One Time?
The question really is “how many indicators do you need?”. The more complex your setup, the more time it takes to make a decision, or (the likely outcome), the greater potential for human error in decision-making and execution.Our suggestion would be to have the minimum number of indicators on your screen. IF you need more than a few indicators running simultaneously, then consider a larger monitor or having two monitors to ensure that you can actually read the data in a less-cramped visual space.
8 – Trade Entry and Exit Factors
Generally, these factors have more to do with you than your chart setup. However, as we mentioned above, your dashboard must be arranged so that you can intuitively place trades without having to “fight” with your platform. If you have to click in and out of windows–say, closing out your chart and pulling up your DOM, or closing out your DOM to pull up another order entry window–then you’ve just lost several seconds in entering or exiting your trade. And if you’re a day trader, then you might have lost your time advantage.Be sure your dashboard allows you to operate in a rapid and seamless manner. Otherwise, your platform, which is essentially your way of getting into the market, may end up just getting in your way.
9 – How Can I Monitor Risk?
Most platforms allow you to see your unrealized profit and loss in real-time. So for most retail day traders, this shouldn’t be much of an issue. There are exceptions, however:
- Some of the more archaic day trading platforms will not show you open positions if you reboot your computer the following day. Although this may no longer be an issue (it’s a ridiculous omission), don’t let such a thing catch you by surprise.
- If you are trading multiple contracts on multiple exchanges at once, you may need one platform that can tie in all of the data into one risk management screen. Some of these platforms also allow you to cross-margin your account, though this feature is more common among institutional platforms (which can be costly) than retail platforms.
10 – Should I Use a Dark or Light Background Theme
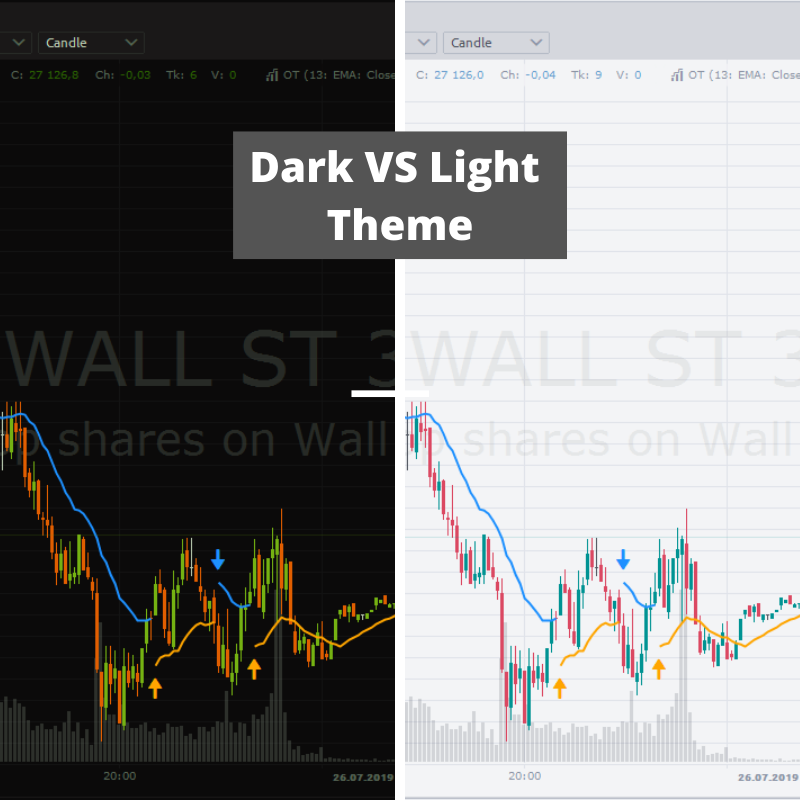
Believe it or not, dark or light screens go beyond aesthetics. They actually do impact functionality.
First, let’s talk about why so many financial platforms have dark screens. When design firm, IDEO designed the Bloomberg terminal, Bloomberg’s platform aesthetic became something of an industry-standard, if not by functionality, then by “brand design.” In this case, aesthetics may have had a lot to do with platforms that provided a default dark-themed background.
But there’s more to it. According to an article on UX Movement, “When it comes to text on websites, users either read or scan. Reading involves focusing on words for a thorough comprehension of the subject. Scanning involves skimming the words for a broader comprehension of the subject. When you should use white text on a dark background depends on whether users are scanning or reading text.” The article continues, “you should avoid using white text on a dark background when displaying paragraph text to make it easier from them to read.”
Getting to the main point:
- Financial charts are made up of graphic symbols and sometimes text.
- When “reading” text, white text on a black background can cause more eye strain than black on white.
- But when “scanning” graphic symbols, white or other bright colors on a black background can make the information more prominent.
As a day trader, you may be using order flow data–some of which is displayed as (small) numerical figures. Based on your short time window for trading, you have to decide whether you are mostly reading or scanning your indicators. But despite the “theories” mentioned above, you still might want to try using both backgrounds to see what works best for you. Ultimately, it depends on your preference in terms of functionality (e.g. making the information prominent while not straining your eyes) and aesthetics.
The Bottom Line
Trading screen setups should be customized to enhance the ease and efficiency of functionality. As a day trader, your “best” trading screen setup is one that allows you to see comprehensively and to respond as quickly as possible to fleeting market opportunities. If your platform default doesn’t work for you, then you might strongly consider modifying it. When it comes to platform modifications, it’s ultimately up to you as the cost is yours alone to absorb. And if you choose not to modify your platform, and if such a choice results in bad trading, then that too is a cost that you alone must absorb.
Please be advised that trading futures and options involves substantial risk of loss and is not suitable for all investors. Past performance is not necessarily indicative of future results. This matter is intended as a solicitation to trade.