Understanding DOM (Depth of Market) in Futures Trading

Hey fellow traders, I’m relatively new to the world of futures trading and have been trying to comprehend the concept of Depth of Market (DOM). I’ve been researching it and watching tutorials, but I still have some questions that I hope you can help me with.

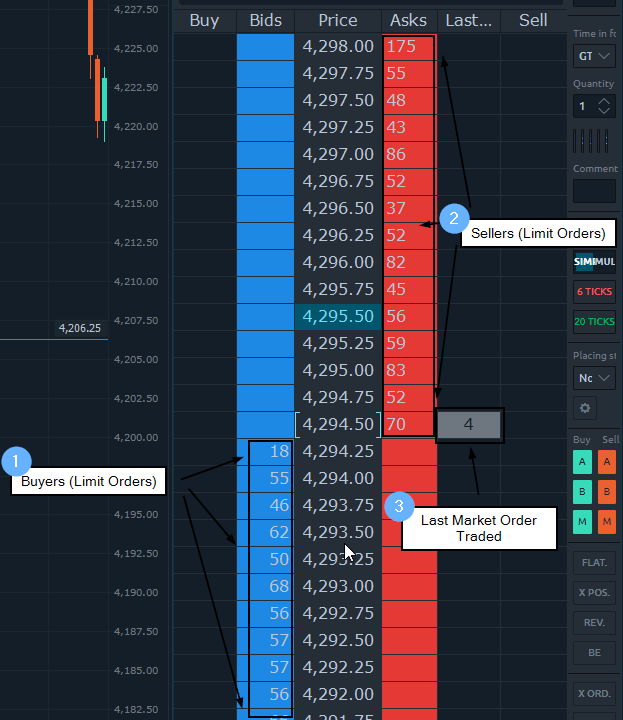
From my understanding, DOM essentially displays the number of buy and sell orders at varying price levels. It’s like a real-time snapshot of market liquidity, which assists traders in assessing the supply and demand dynamics at play. But how exactly do experienced traders utilize this information to make informed trading decisions?

For example, when I observe a significant number of buy orders stacked at a specific price level, does that indicate strong support and the likelihood of the price bouncing off that level? Conversely, if there are more sell orders at a certain price, should I interpret it as resistance, and that the price might struggle to break through?

Also, I’m unsure about which side represents buyers and which side represents sellers in the DOM. Is it the left side for buyers and the right side for sellers, or vice versa? Or does it vary depending on the platform being used?

Moreover, what about the speed at which these orders are being filled? Can I use this data to gauge market sentiment and predict short-term price movements? I’ve heard some traders mention “order flow” and “trade flow” analysis – how do these techniques relate to DOM, and are they worth learning for someone like me?

Lastly, do you have any suggestions on how to incorporate DOM data into my existing trading strategy? I’m currently using technical indicators like moving averages and RSI, but I feel like adding DOM to the mix could give me an additional edge.

I know that’s a lot of questions, but I’m genuinely eager to learn and enhance my trading skills. Any insights, advice, or resources you could share would be immensely appreciated! Thanks in advance!

Hi Tifo,

This is a great topic, but can be lengthy to explain, so bear with me.

Let me summarize the questions so it’s easier to follow:

  1. How do experienced traders use order flow to make decisions?
  2. What does the buying and selling mean at critical levels, i.e. - Does buying mean support, does selling mean resistance and how to decipher.
  3. What side are buyers and what side sellers on the DOM.
  4. Speed and sentiment with order flow, techniques related to DOM and are they worth learning.
  5. Incorporating DOM into existing trading strategy.

Let’s start with the quick ones:
3. The left of the DOM shows buyer’s limit orders. The right side shows seller’s limit orders:

Icon #3 shows the last market order trading.

  1. Here’s the main idea: The market only moves by market orders. These are new orders coming into the market asking to buy or sell at the best price possible. Back during pit trading, you could see, hear and even feel the change in the market. People would start yelling their orders more loudly, or move quicker, pit traders would start bumping into each other, etc.

Since there are no pits anymore, relatively speaking, the DOM is how we can see those orders come into the market. We observe how quickly the orders are coming in, what is the average size of each order, are bids backing down because they are fearful of a selloff, or are they holding strong despite increased selling pressure, absorbing the liquidity.

While every situation is unique, and it needs to be based on an overall sound thesis, it can help show an additional data point and potential market sentiment.

  1. Buying and selling at certain levels are always subjective. It also depends on the setup. If price broke down, then came back up to the retest level you have to first have a thesis for the day. If it’s down and you think the retest will held then continue to selloff, ask “what would I want to see here for a sell entry”

Answer:

  • I would want to see sellers aggressively offer price at the restest level.
  • I would want to see speculative buyers anticipate a break back into the range. They will buy the first time it touches the retest, but I want to see them lose momentum.
  • Then I want to see less and less buyers, more sellers come into the market as they have seen the retest hold as of now.
  • Then I want they speculative buyers to puke their position (turning into sellers) and continue to drive the price down to continue market structure (lower lows in the case).

So then we have that idea in mind, what we want to see, then we watch the DOM to see if it appears that is happening.

  • Are offers getting refilled (more seller limit orders indicated by icon #2)
  • Does it appear that the buying volume has or is declining
  • Are the bidders scared (meaning, do bids seem to slip away and get pulled as price comes down to them)

The DOM is just a way to further validate your trade idea with the more raw data, buyers and sellers, which again is the only thing that moves markets.

  1. Speed and sentiment - Just like the pit example, if people are interested in an area or price to trade, will they go fast or go slow? You can see the market speed up and slow down in the DOM, when you watch it and just that for a full session, you will consciously and subconsciously pick up on patterns. Your brain is wired to do this. Then you add in charts, and observe what order flow is doing around areas you may trade, and create hypotheses.

  2. Same as in #2, but, I would say that when you ask, knowing that all traders see the same information, “if this area is going to hold or break, what would I expect to see in the form of orders?”

What’s obvious, what is most likely to happen here if this or this. Always be asking then you’re open to receiving the information you may be blocking out. Definitely have a strategy and an execution plan, and observe the orders flowing around price.

1 Like

@Ben_M thank you for your efforts! We hope many contribute like you.

Matt Z
Optimus Futures

There is a substantial risk of loss in futures trading. Past performance is not indicative of future results.

1 Like

Thank you Matt! Always enjoy contributing to the community!

Hi Ben, I just watched one of your webinars and am curious about some of your opinions:

  • if i’m trading the micro futures, I’ve heard people say I should be watching the larger e-mini order flow and not the micros. I know any difference will be arb’d away at some point… but in terms of watching and learning “normal” flow movement and patterns would it be e-mini or would you say they should act the same and I can just watch the micros?

  • do you use preset stops/tp’s on your entries or you manually close out or flatten?

thanks!