Hi. Is it possible to calibrate the Y axis price values manually? I’m using R-Trader Pro charts.
Many Thanks,
mes.
Hi. Is it possible to calibrate the Y axis price values manually? I’m using R-Trader Pro charts.
Many Thanks,
mes.
HI @mes,
Thanks for your question!
Would you mind clarifying and elaborating just a bit on what you mean by calibrating the Y-Axis price values manually? What exactly are you trying to calibrate?
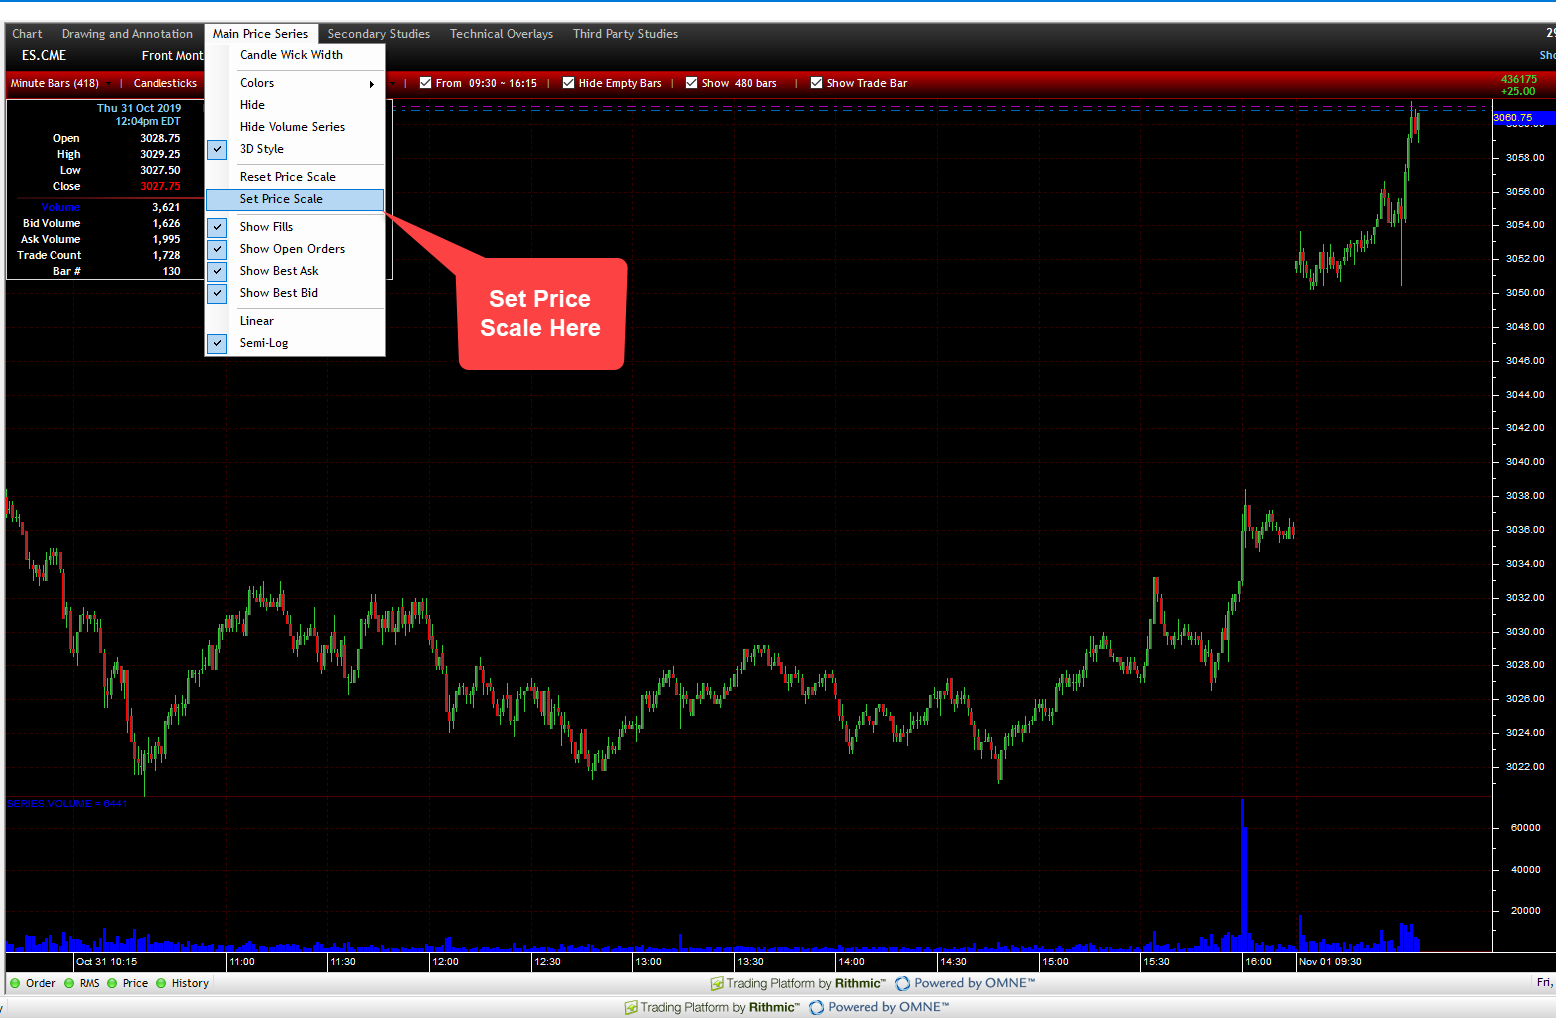
You do have the option of navigating to Main Price Series > Set Price Scale which will essentially allow you to reconfigure the Y Axis and only display the price levels you want to be shown. For example, we can reconfigure the Max Price and Minimum price of our Y Axis to only display the levels we want shown.
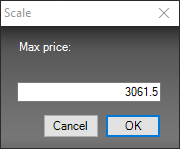
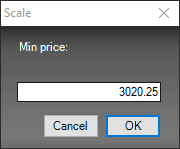
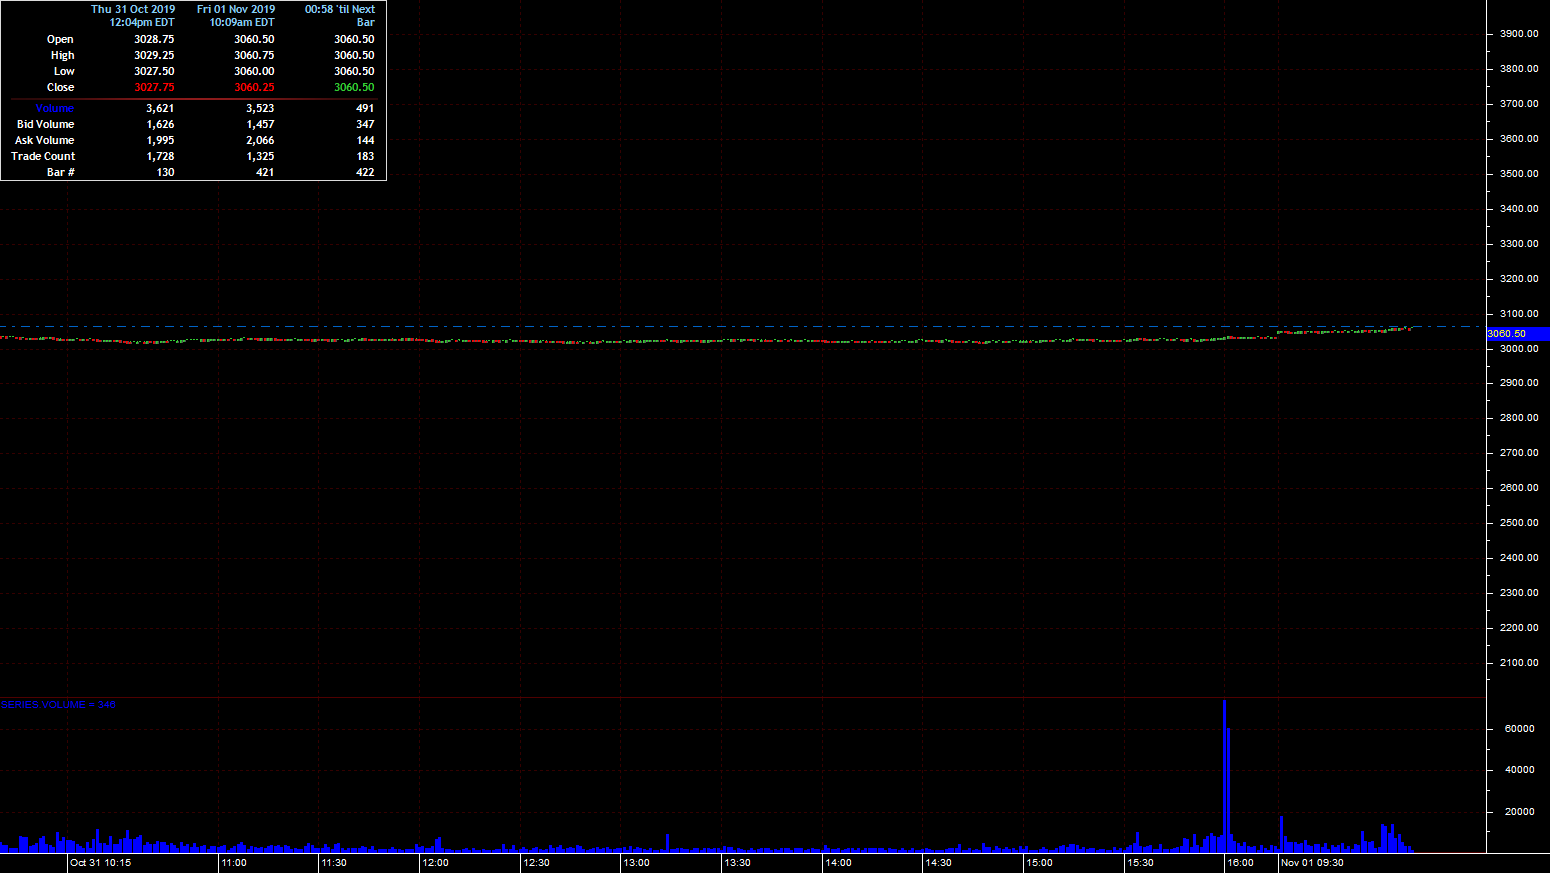
Although the final image in my example above is a bit extreme, I configured my max price of my Y axis to 4000 and the minimum price to be 2000. This isn’t exactly practically and makes the chart virtually unreadable, but I just wanted to demonstrate what this feature does.
Other than indicators, colors, chart style, and session times; there is not too much that can be recalibrated onb R Trader Pro’s charts. I hope this is along the lines of what you were looking for. If not, please specify so we can assist you with this feature further.
Thanks for reaching out,
Jake
Optimus Futures Support 
Hi Jake, thanks for the reply. I want to be able to set the horizontal grids to my preference ie increments of 5 or 7.5 etc, depending on how I view the current market volatility range. At the moment the chart appears to change the horizontal grids at random, which I find frustrating, as I set my trade parameters by this method. Hope this helps.
Regards,
mes.
Hi @mes,
Unfortunately, R Trader Pro does not appear to have such in-depth chart customization available.
The only customization options remotely close to what you are looking for appear to be the one mentioned above, or by adjusting how many bars are displayed on your chart at one time.
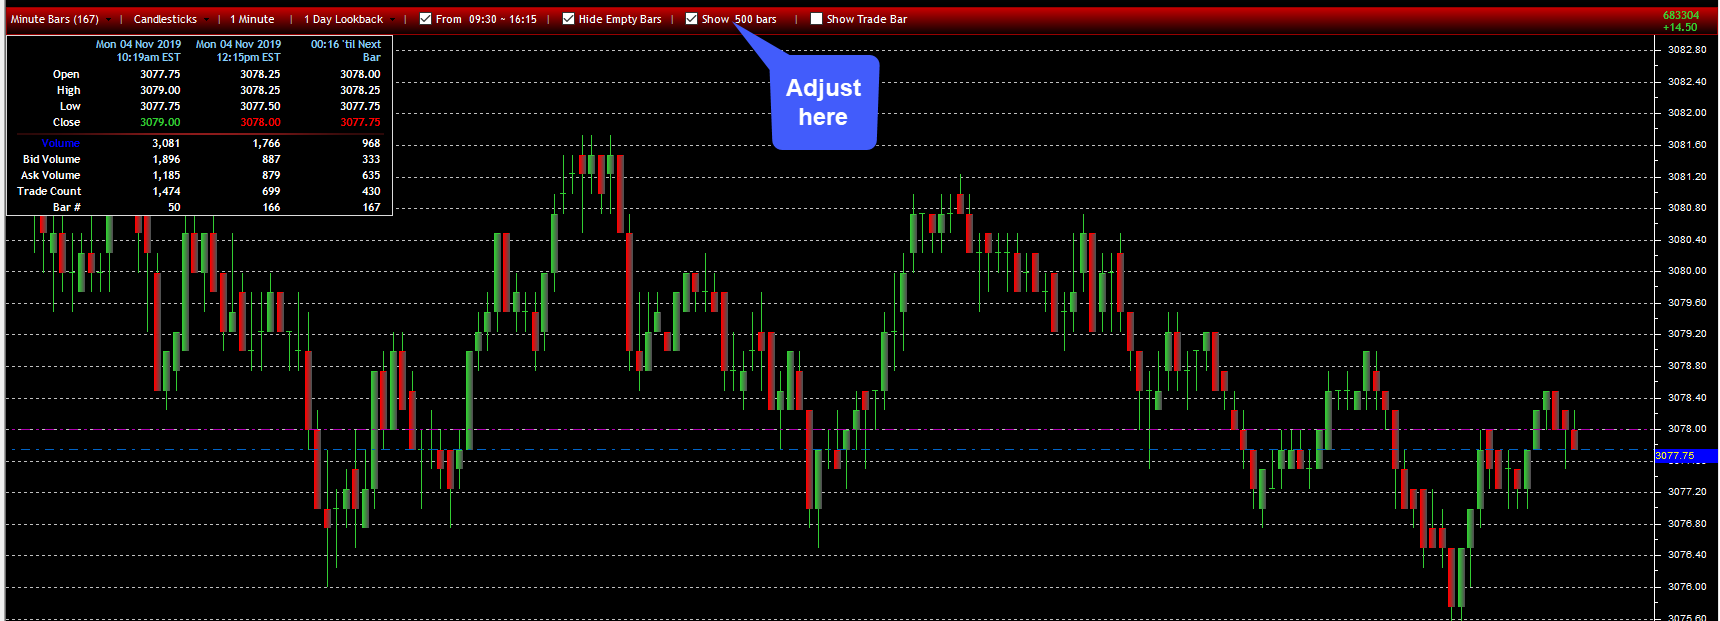
You can change bars displayed by adjusting the Show x Bars box at the top of the chart:
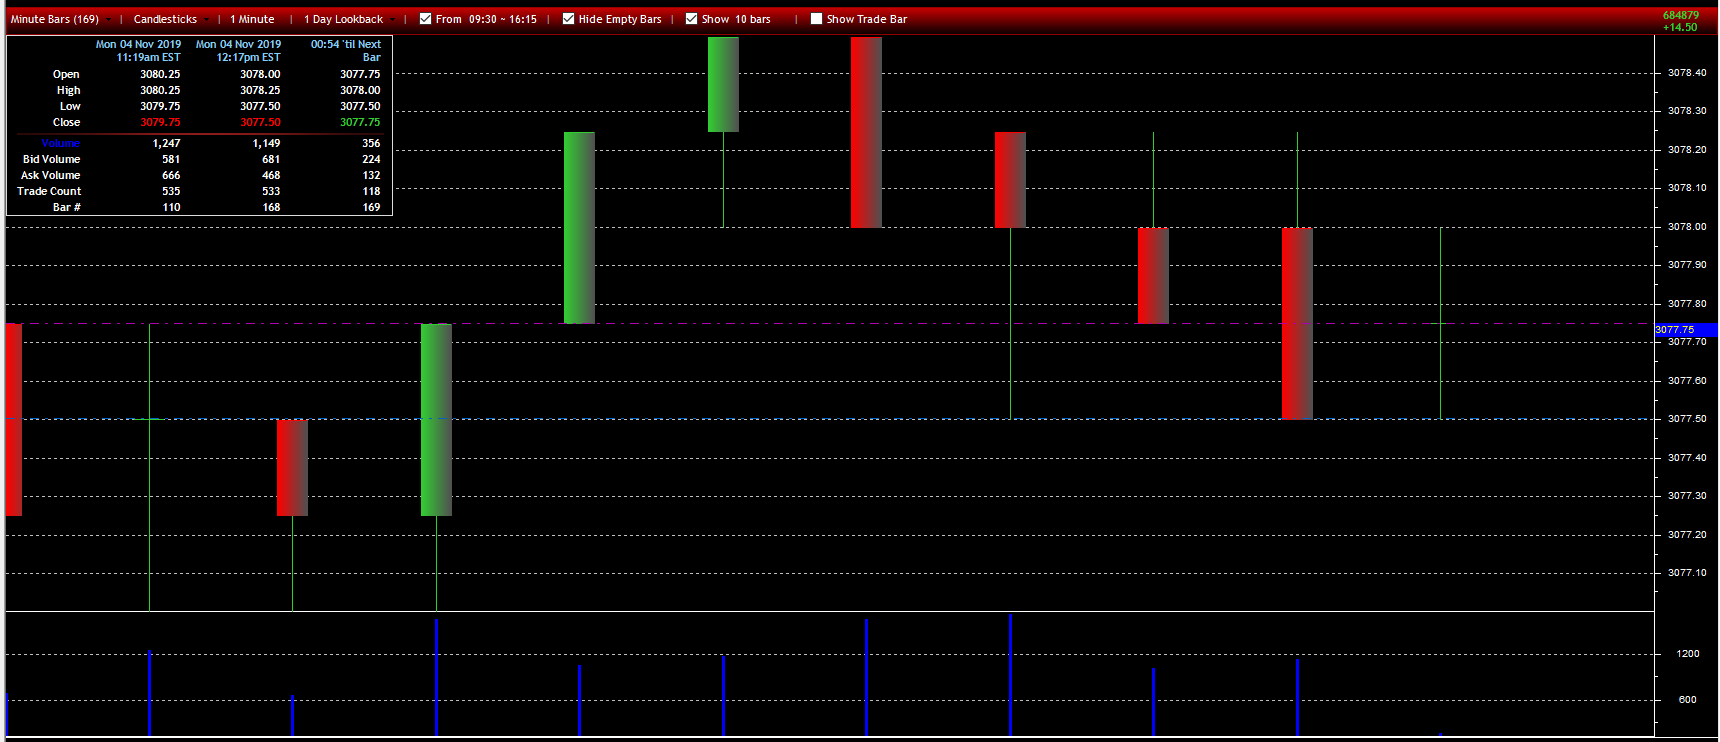
Here is an example of only 10 bars shown:
I know this isn’t exactly what you are looking for, but being that the horizontal grid line customization options you are looking for aren’t available, I wanted to provide you with an alternative that might be able to assist you.
Feel free to reach out with any additional questions you may have related to R Trader or any of the other platforms we offer. If R Trader Pro isn’t meeting your charting needs, you can always look for an additional charting platform while you continue to use R Trader for execution.
Thanks for your time,
Jake
Optimus Futures Support
Thanks for the reply Jake. I have solved the problem by adjusting the amount of look-back and bars on the screen (as you have suggested)…I’m satisfied with this solution. I do like the simplicity of R/Trader Pro, it’s got everything that I require, as a chart trader.
Regards,
mes.
Glad to hear the workarounds we provided served as a solution to what you were looking to accomplish!
Don’t hesitate to reach out with any additional technical questions or anything Futures trading related, we’d love to assist you.
Thanks,
Optimus Futures Support