You can run the strategies in replay mode with Bookmap!
Bruce Pringle
Risk Disclaimer:
There is a substantial risk of loss in futures trading. Past performance is not indicative of future results.
You can run the strategies in replay mode with Bookmap!
Bruce Pringle
Risk Disclaimer:
There is a substantial risk of loss in futures trading. Past performance is not indicative of future results.
When the Bookmap program is installed on your computer with a particular data vendor, are there any difficulties encountered if you want to change to another data vendor in the future?
The webinar showed that high liquidity was represented on the Heatmap as a white horizontal bar. Would you say that this would be indicative of the development of significant Support/Resistance levels or a Point Of Control by Institutions?
I have a question for Bruce. Is Bookmap planned as a replacement for a standard technical analysis chart or as a supplement?
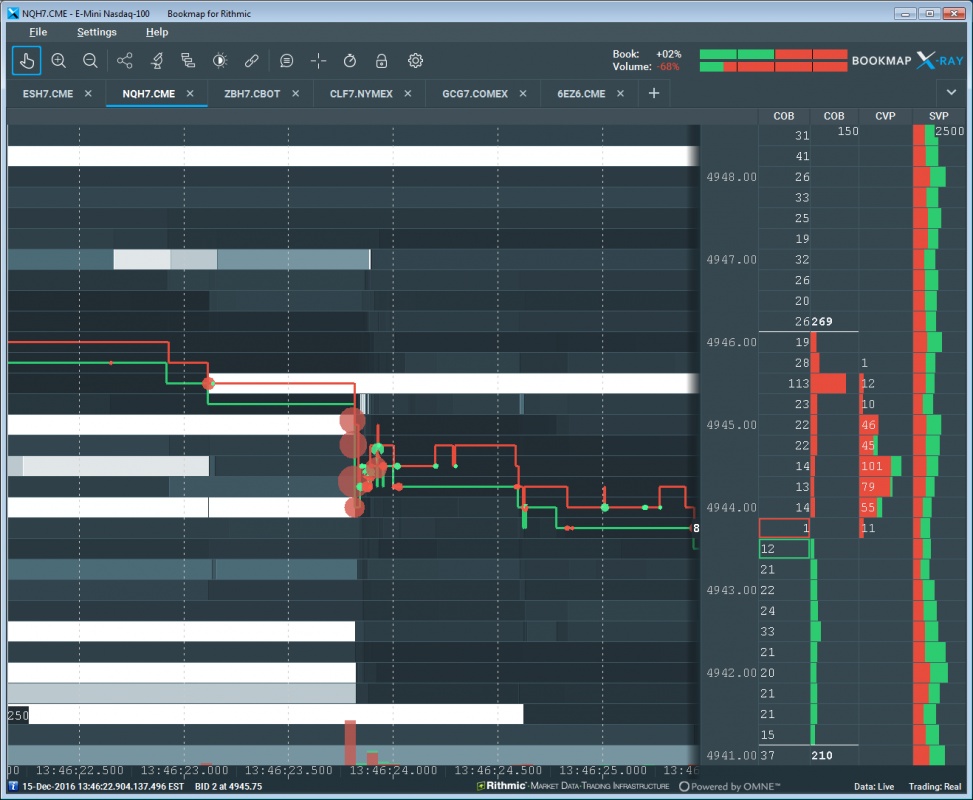
Bookmap does a beautiful job displaying sweeps of the book. The same for pulls. Take a look at this image. You can clearly see several phenomena. Look at the aggressive auction skew of 113 contracts at 4945.50, and then the sweeping of several price levels down to 4944. Look at the pull of liquidity around the 4942 levels.
Bruce Pringle
Risk disclaimer:
There is a substantial risk of loss in futures trading. Past performance is not indicative of future results.
Just let us know at support@veloxpro.com if you need to switch to another Bookmap supported data provider and we will enable you.
Bruce Pringle
Risk disclaimer:
There is a substantial risk of loss in futures trading. Past performance is not indicative of future results.
That’s quite possible but let’s boil it down – what we truly know at that price level is there are a lot of contracts at that price level. It doesn’t mean aggressive traders can’t take them on and trade through that level. However, if you read the order flow contextually as covered in the webinar, then you’ll have a much clearer understanding of the intent of those high liquidity providers. This will give you tremendous insight within your trading methodology.
Bruce Pringle
Risk disclaimer:
There is a substantial risk of loss in futures trading. Past performance is not indicative of future results.
Use Bookmap in any way that gives insight to your trading levels of interest. One thing for sure – the data in Bookmap is very factual and objective. It simply displays the liquidity provided at price levels, for how long, and at what size. The traded volume displays where the transactions took place, when it took place, and how much volume traded. Bookmap is not an indicator, nor a derivative of time, price, nor volume. perhaps you use indicators to give you insight at your levels. That’s great. Look at Bookmap to give you very objective data at those levels.
Bruce Pringle
Risk disclaimer:
There is a substantial risk of loss in futures trading. Past performance is not indicative of future results.
Yes, we will do our best to have future presentation again.
Thank you,
Matt
Optimus Futures
www.optimusfutures.com
Indeed a tough question. However, consider that trading is a profession where you make new observations and could potentially improve your trading ability the longer you dedicate to it. To learn any new method will depend on your futures trading background, prior knowledge of order flow, and your actual trading experience. I am sorry that I can not give a particular period. Part of the challenge as well is determining a futures traders need to become “proficient.” For example, one could use a small number of features from Bookmap while others other would want to take advantage of all its capabilities Whther your approach is to bookmap is simple or complex will depend on you, and both methods are fine. Try to put in three to six months of screen time to observe how Bookmap behaves, under different market conditions.
Thank you,
Matt
Optimus Futures
The volume dots display the size, time and location of the traded volume at the specific price levels. Bookmap displays every single discreet action received from the data provider. Bookmap can show you the break down of market activity to nanosecond levels, yet still visually and graphically display this data in a digestible manner at higher time frames so you can understand what unfolded at these levels. This is displayed, for example, through the pie chart volume dots display, which quickly gives you the overall delta of the aggressive buy versus sell volume.
Bruce Pringle
Risk disclaimer:
There is a substantial risk of loss in futures trading. Past performance is not indicative of future results.
Any given Futures trading platform can not be everything to everyone. Due to Booksmap’s unique approach to market structure and order flow, I would like them to focus on their core strengths. This is what their user base would like as well.
If you need delta type charts to enhance the display of Bookmap, consider MarketDelta. Since Bookmap could be driven by CQG as well, you can tie MarketDelta and Bookmap to the same account. We offer both platforms.
On a personal note, I have seen platforms that try to satisfy larger groups of people by adding more and more features. This was just done for the sake of sales and larger mass appeal. But, this is also reflected in the platform’s overall stability while not having any particular specialization.
Thank you,
Matt
Optimus Futures
No extra cost at all! Bookmap’s Complex Event Processor can handle all these data point and display them for you – this is quite unique compared to other trading platforms out there. It will allow you to zoom in and check out exactly what unfolded in the market place as well where your orders were executed.
Bruce Pringle
Risk disclaimer:
There is a substantial risk of loss in futures trading. Past performance is not indicative of future results.
@nsmith968 Do you refer to the ability to place order according to your targets and risk management? If you could be more specific it would be helpful. Also, we suggest you give Bookmap a trial here: Bookmap | Futures Trading Platform | Optimus Futures
Thank you,
Matt
Optimus Futures
Hi,
Is it possible to create a custom “indicator” for the bottom of the chart instead of or in addition to the volume indicator?
If not, do you have any plans to include such ability in the future?
Thanks
Matt and Bruce,
Just wanted to thank you both for answering my questions and for doing the webinar. It was a great orientation into the use of Bookmap.

JoeYou are welcome. Thank you for the kind words.
Matt
Optimus Futures
Is there an education video series or PDF documentation included with Bookmap so that a new user can be trained in it use and functionality?
In order to use the Replay feature, does the user have to collect the data (leave the platform running for the time that they want to replay) or can the user just pick a date at random and the data provider supply the rest (Depth of Market data?)?
Thanks for a great webinar!
Hello Bruce, great webinar about the BOOKMAP software. The heat map is a much cleaner look from the other heat maps I’ve seen out there and the detail of the volume dots from the zoom options are excellent. You spoke a little about being able to see “imbalance” from the heat map and how scalpers can take advantage of this. I would love to see more or a separate webinar on how scalpers see this “imbalance” from the heat map and how to take advantage of this in real time. I also like the fact that you can have multiple volume profiles off to the side of the heat map and have a question in regards to this. In the profile settings, can you set places of interest/alerts and have it show up on the profile and heat map? For example session high, low, weekly high, low, value areas etc… Finally, I like how the “traded volume” is located on the heat map near the current bid and offer. Is there an option to have the traded volume highlight or alert once it reaches a certain amount of volume on the bid and offer based on an individuals settings? Thanks again Bruce and Matt for putting this webinar together.
Jason