So today was my first day on the Optimus platform. I’m not sure how the platform came about. If it was an off th shelf platform or if Matt had developers make I but I have to say it’s a pretty nice platform. Intuitive, easy to use and set up… 1st trade today was a test in very early trading where I seldom visit. Heavy volume. Market order entered and filled immediately and confirmation posted immediately. At first I wondered where to enter my SL… The I looked at the order on the chart and saw SL and TP on it. I just smiled and said it can’t be that easy… but yes, yes it was that easy… Click and drag and SL and the TP entered… Beautiful. Stopped out for 5 points but it was just a test. No locking up. No ghost orders, just worked perfectly and continued to do so until I turned it ogg. So Kudos to the developers of this program. Well done.
Ok, so , I only trade the NQ and since before I opened my account here I have looked at the NQ charts and noticed certain patterns develop on some days… Not everyday but usually fairly often. Todays chart was a perfect example of what I am talking about and it has the set up both long and short so I decided to screen shot it, make some notes and talk about it this evening.
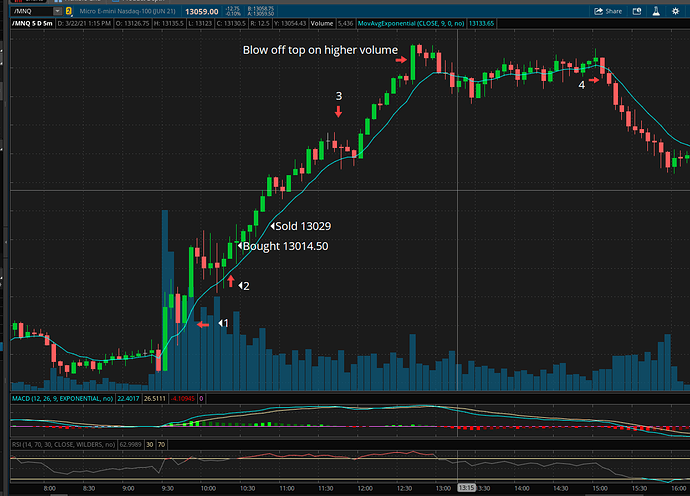
Ok so first of all that blue line you see is the EMA. This past weekend I realized I really don’t have a concrete trading strategy other than an idea in my head. So in order to put th strategy together I need to see a decent chart of what II am looking for and what my goals would be. Today presented that chart.
So the goal is to get as much of the move as possible from about Point #2 to the blow off top… Then again on the short side from point #4 on down… The long side has about 125-150 points of movement in it and the short side from point#4 had about 60-70 points of movement. Timing perfect entries and exits on a chart like this, for me, would probably never happen… I would be happy with 1/2 of the move in any direction.
So that being said lets look at this chart and the different points I make reference to.
Point#1 is the first 4 bars or 20 minutes of the day. (This is a 5 minute chart) I see this as a danger zone to me. Market is moving very fast in both directions. Great for a quick scalp but not what I am looking for to enter a longer term trade. The one thing I do notice is that almost immediately the EMA line is holding. Although it looks like today that would have been a good entry point. It isn’t always the case at that time of the morning.
I really look for my set up at between 10:15 and 10:45. The early morning turmoil as I like to call it, has settled down and the market is giving us a clearer indication of what it wants to do. (Again, not always but these ar the times that seem to work best for me.)
You can see at point #2 I have an arrow pointing straight up. Thats the bar where I really felt my set up developing this morning. We just had a run up and then things took a breather and a bit of a shakeout even. Last 2 bars the ema pretty much held.
The next bar (The Doji bar) moved back down to the EMA which acted as support again. Thats my buy point… However with the new system I missed the fact buy and got in about 8-10 points later. Still, not.a bad entry and my strategy is confirmed when the EMA held once again anyway… Now I am in the trade and confident that I have it correct. My SL is just below the EMA and my TP is at 31.50. The really nice thing about this set up is that is you get in right at th bounce of the EMA, you can set your stop just below it and it probably won’t ever trigger. As you can see, the entire move up until point #3 the EMA line was never broken.
ok so lets address why I sold at 29… Market was moving up but seemed to be stalling at 27, 28 and pulling back to 24 or so then running up and pulling back… Just didn’t feel like a strong enough push t get us up to my 31.50 level. About 20 seconds before the end of the bar I moved my TP down to 29 and just as right before the next bar started it hit 29 then the next bar came and ran up to 34.50 or so LOL… I just laughed. Not going to care to much about 2 points. I recovered my loss plus posted a profit for the day after covering commissions… It was a good trade. In and out in about 13 minutes I think and was calm the entire time.
I also wanted to note that I had things going on at the house this morning so didn’t want to trade all morning. Thats the only reason I was even looking for an exit at this point.
So as you can see, between where I sold and up to point 3 it is pretty smooth sailing. Little bit of a pause for a couple bars here and there but nothing major going on. Certainly nothing that says sell.
Then we get to point #3. 4 red candles. the one right before those 4 is a Doji. The Doji and the next one have topping tails. After that we have the one that really breaks down and for the first time since the move started, moved below the EMA. Put a piece of paper over everything to the right of that candle. I’m not sure I haven’t sold in this area if I was in the trade. Can anyone offer up an explanation as to why I should still be holding on there? Thats a really hard spot for me…
The next 2 red candles do hold and then the upward move continues right on to the blow off top on higher volume. So, even if I sold at around point #3, by the 2nd green bar it’s obvious that the ema is still holding and the upward trend is still intact. So again, not looking to get the entire mov but definitely has some possibilities for a nice 2nd or even 3rd trade of the day in there.
Then we get to the afternoon doldrums until we get to point#4. We get the 1st red bar breaking the EMA and the 2nd one confirming the move down. That total move is 60-70 points so there is definitely a trade to be had in there. Also notice that once the EMA was broken it never traded back above it for the entire move. Thats why this chart was so perfect to post and talk about. The set up are not always this easy to spot but today was just a picture perfect day on the charts. Wish I didn’t have so many other things going on. Unfortunately trading is not something you can just do in the background. It really requires my full attention. Maybe someone out there has written a program to take advantage of this kind of action.
Anyway, posting this for discussion. If my line of thinking is completely wrong please let me know. I do see these set up quite often. Many times they run 50-300 points. These are the types of set ups I really want to take advantage of in the future.
