I am still learning about Sierra Chart. One frustration id the size of indicators like MACD. It takes up a large portion of my screen and I can’t find a way to downsize it. I use MACD to affirm what I am seeing in price action and I would prefer having it about half the size it is. How can I shrink it and make it the default size for any other indicator that I open?
Hello @Shelia,
There are multiple ways to resize and reconfigure indicators, otherwise known as “Studies” on Sierra Chart, but how they are displayed is entirely up to you. I am not sure of the exact configuration you are looking for here, so I will to attempt to answer the question to the best of my ability.
The first thing I would suggest you try is to change the scale range of your graph with your MACD study applied to a chart.
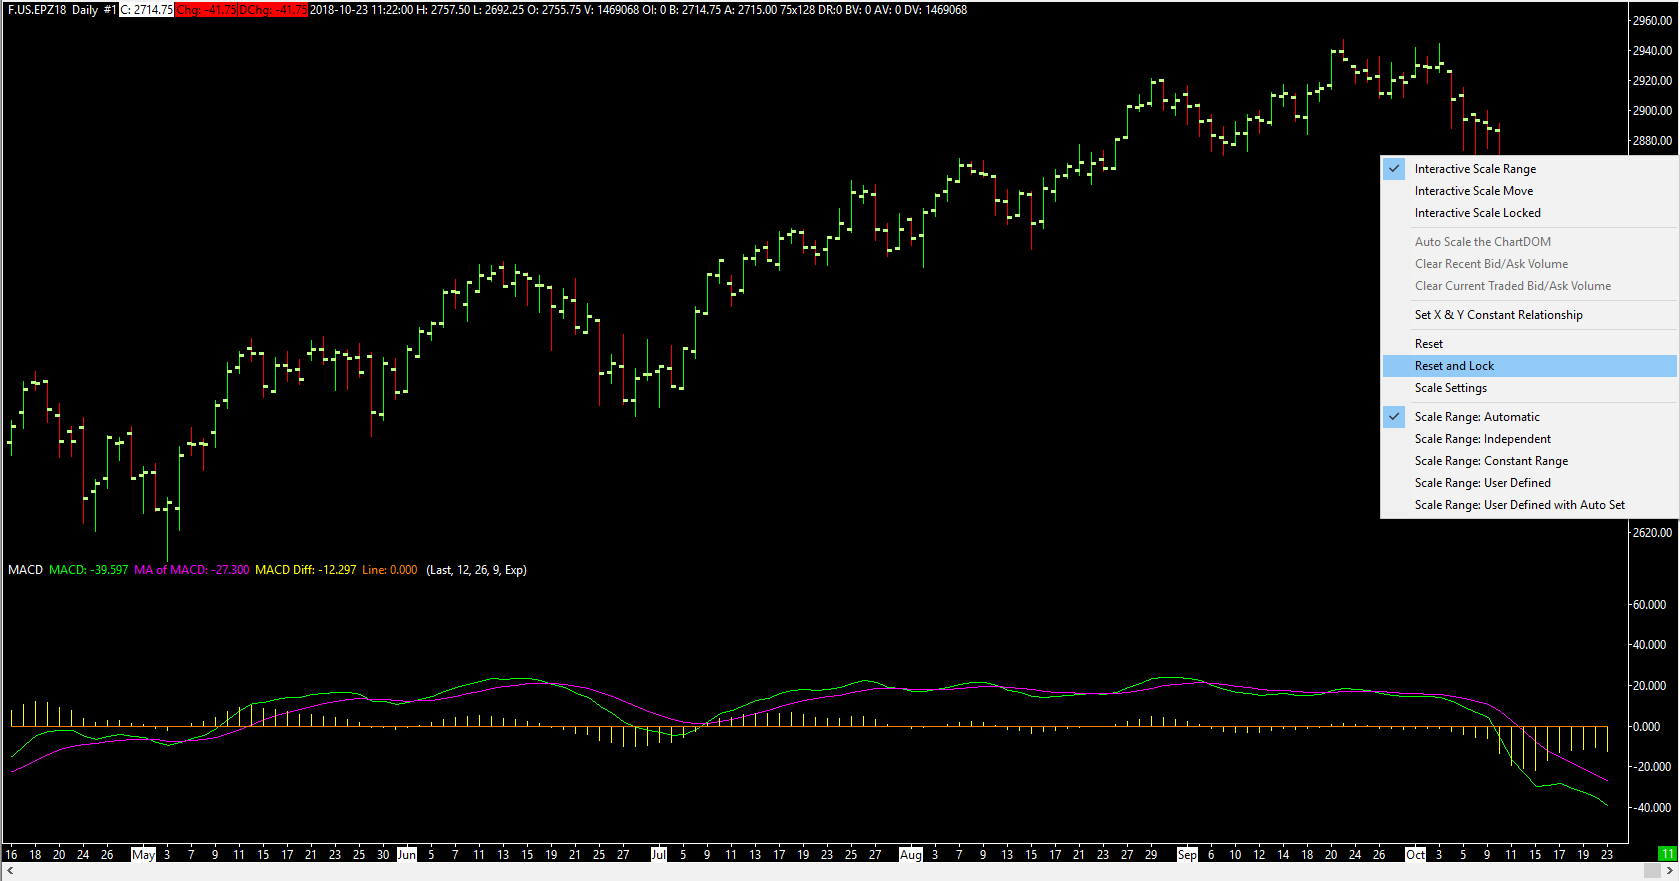
1. Right click within the Y Axis of your chart. As you can see, there are various scales in which users can select for there graph. I would suggest to try different scaling methods until you are able to configure your desired graph and study. Specifically, look into the Interactive Scale Range and Scale Range: User Defined options.
2. Once you have selected on of the following scales, you can left click and hold within your X or Y axis to adjust the scaling of the main price graph or the indicator.
The other option you have is through the study menu and adjusting the scale here.
1. Navigate to Analysis >> Studies on the top of the platform window.
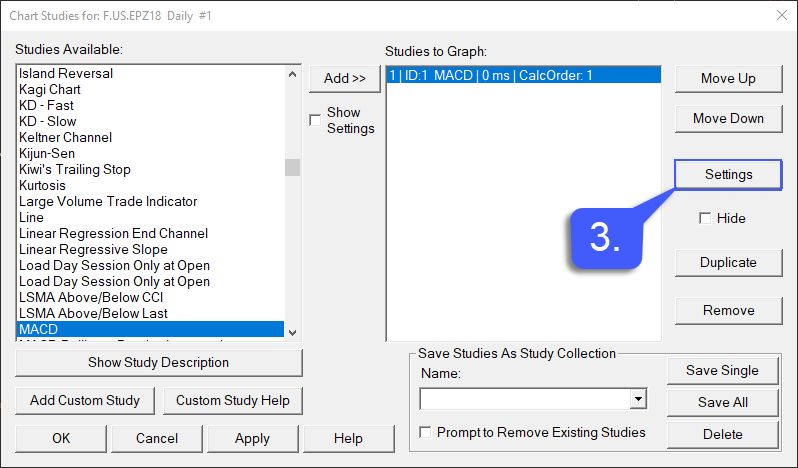
2. Within the Studies To Graph field, select the studies that you wish to display on your chart .
3. Press the Settings button to open the Study Settings window.
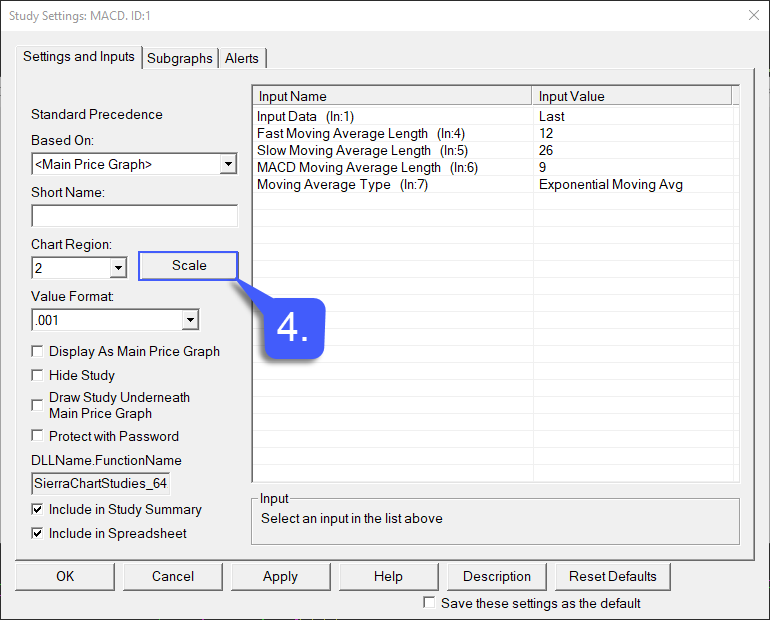
4. First select a Chart Region (Choosing a chart region of 1 would actually hide the study from the main price graph) and then press the Scale button.
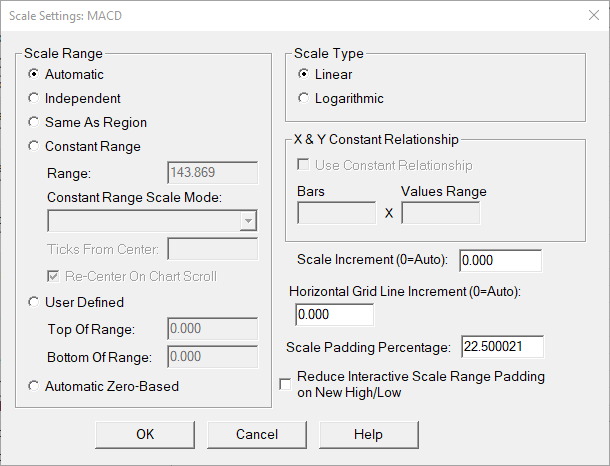
From this point on, the settings that are chosen are entirely up to you. I would suggest to try the Independent scale range, as this would allow you to have more control of how the study is displayed. It is entirely personal preference as to how you would like your study displayed, so it is impossible to provide the exact solution you are looking for.
Let us know if you have additional questions related to this issue. If you had something different in mind on how you would like the MACD indicator displayed, please provide additional details so we can troubleshoot this issue further and assist you.
Thanks,
Jake
Optimus Futures Support
(800) 771-6748
1 Like
I don’t think it is a scale issue. IT appears that region 2 is very large and it could be any indicator that occupies that region. My question is how do I reduce the height of region 2?
1 Like
Thank you for clarifying. I think this is the answer you might be looking for!
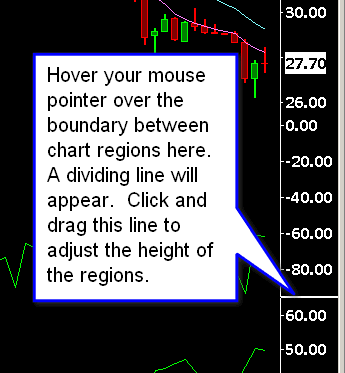
Once you do change the height of a chart region, then you may have to utilize the steps I provided above for scaling, but I think this should be the solution you are looking for.
Let me know if you are still having issues.
1 Like
Thanks, I new it was something simple. I don’t need to adjust the scaling that is automatic. Is there a way to make the adjusted size the default region size?
1 Like
After you a change the heights of the Chart Regions, you may want to save your Chartbook by selecting File >> Save on the menu.
Also, if the studies on the chart are from a study collection on the Analysis menu, then you will need to save the Study Collection again in order to have the region heights saved with the Study Collection so they will be restored next time you apply the Study Collection. To do this select Analysis >> Studies . Select the Study Collection name in the Study Collections list and press the Save All button.
This will essentially allow you to set your currently customized chart region as the “default” for that specific study or study collection. If you save several studies under one study group with this chart region, all studies within that group will be configured with this default region. Otherwise, you will need to declare your chart region for each new study you apply to a chart.
1 Like