Hello, I cannot seem to find a way to draw Fibonacci retracement levels on Sierra Chart. I have found something called a Fibonacci fan (Below is a screenshot of the Fibonacci fan), but I am not familiar with this tool and I’m not sure how it works. Is there something comparable to traditional Fibonacci retracement lines on this platform? Thanks.
Yes, there are traditional Fibonacci retracement levels on Sierra Chart, although the tool does not use the word Fibonacci.
Navigate to Tools > Price Retracement or use the shortcut Alt-7.

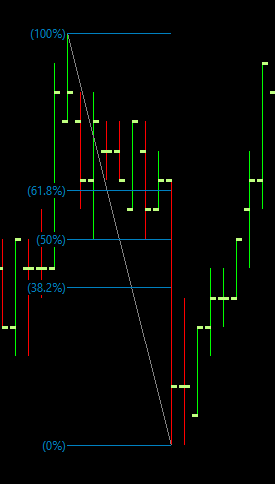
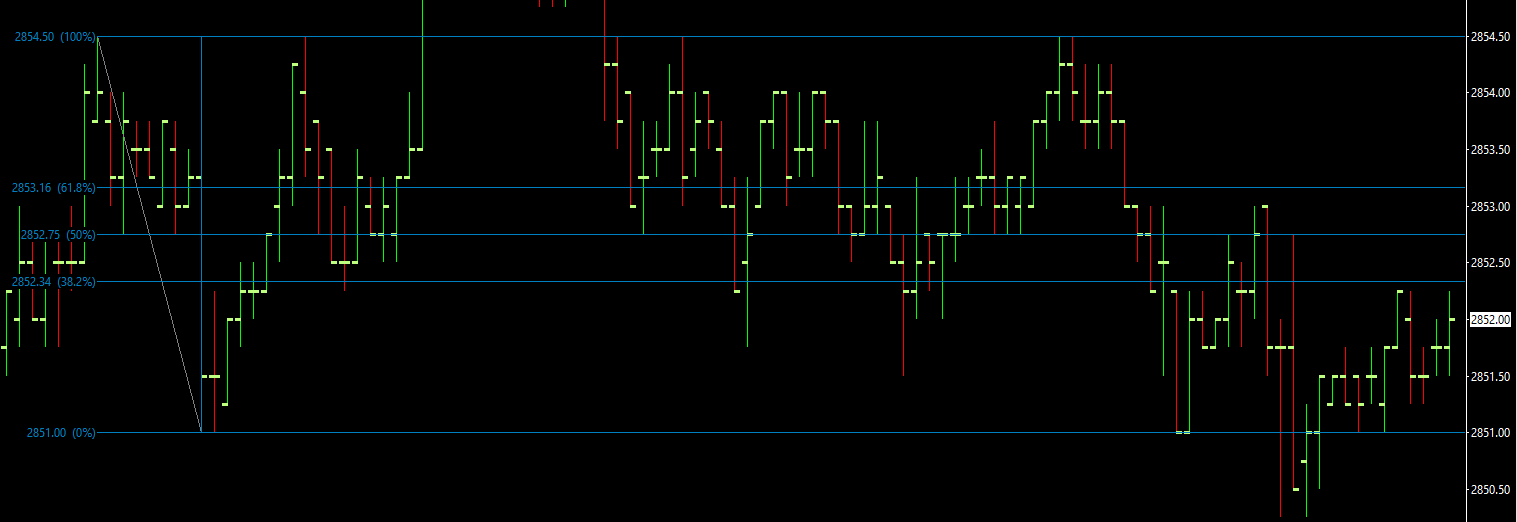
This should be the tool you are looking for. Once the tool has been selected in the tool tab, left click at a specific point on the chart. This point will become “point A”. Once selected, move the cursor to the next desired location and left click again to mark “point B”. The new A-B line represents the length of price move. Below is an example of a Fibonacci retracement I created.
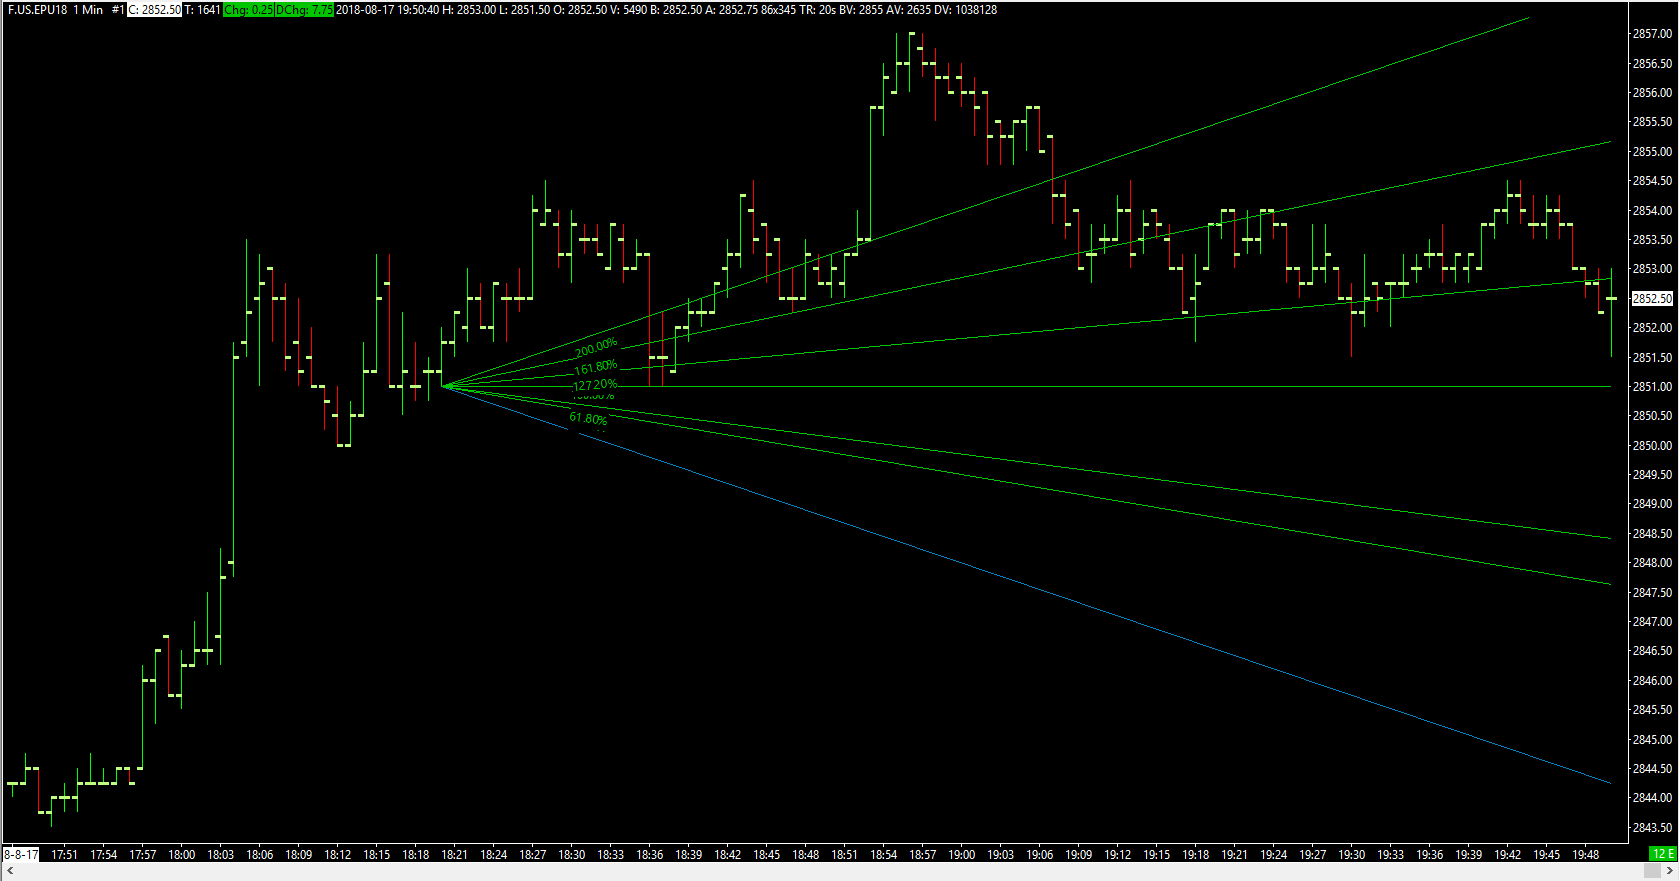
It is also possible to customize the features of the retracement lines, such as displaying the current price level or extending the levels across the width of the platform.
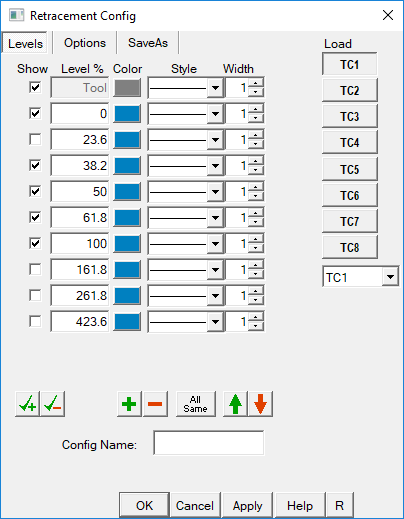
Navigate to Tools > Tool Configs > Price Retracement Config.
Under the Levels tab users can customize the retracement percentage levels, line colors, style, and width.
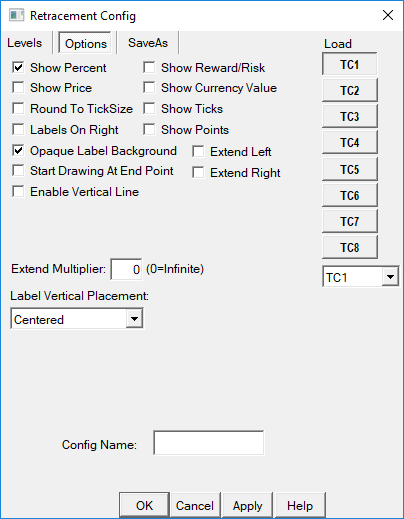
Under the Options tab, users can select various options to be displayed on their Fibonacci Retracement lines. For example by selecting the Show Price option, retracement lines will also display price the price level. In the example below, we have created a Fibonacci retracement with the Show Price, Enable Vertical Line, and Extend Right options enabled.
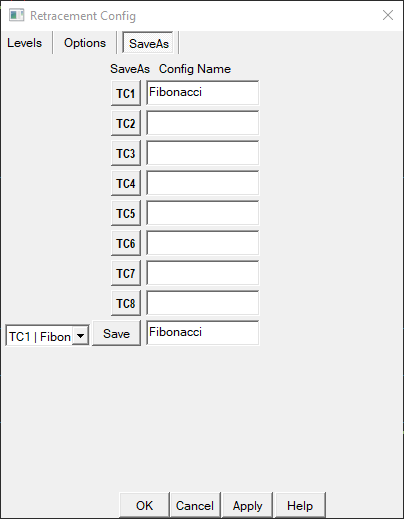
Finally, users can save these settings under a configuration in the SaveAs tab. Simply select a name for your configuration, left click the Save button, and then Apply.
We hope this helps. If you have any further questions feel free to contact us directly.
Thanks,
Jake
Optimus Futures Support