DOM and DOM for Chart customization

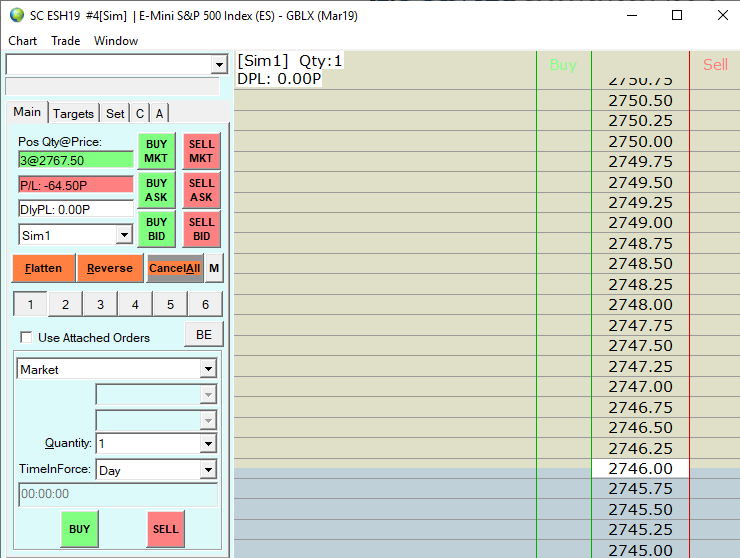
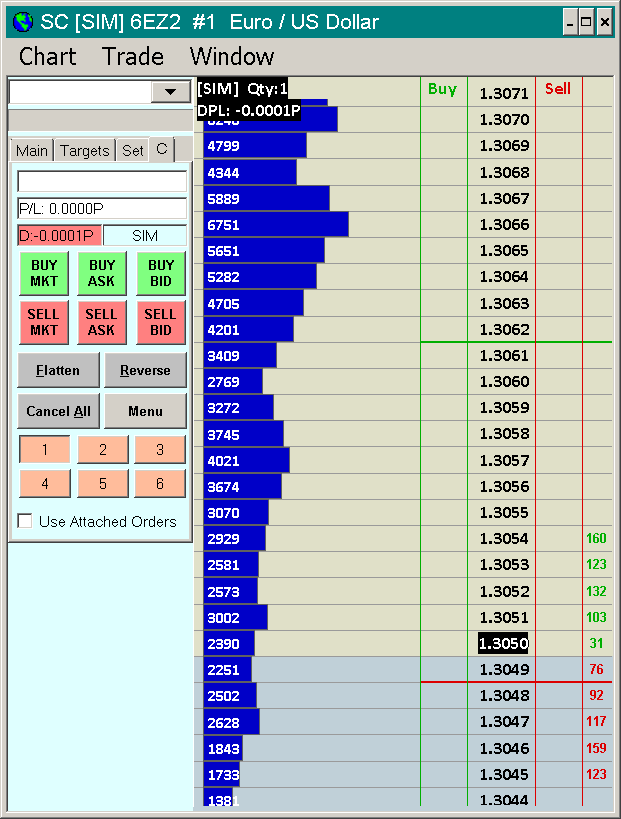
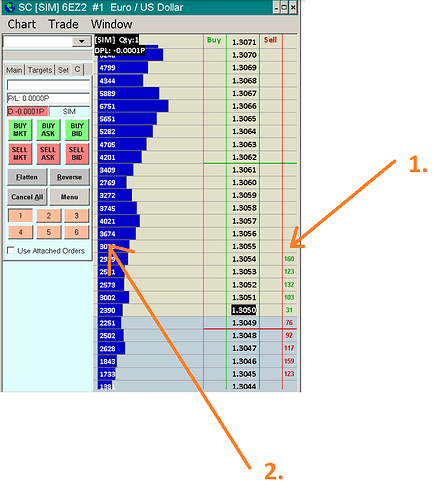
I see that there are 2 main DOM sections.

  1. DOM
    and
  2. DOM for charts.

I would like to be able to customize them both. Where can I find the customization options for these on the Sierra Chart interface?

Also, I am not getting the BID/ASK size vols on the DOM?

Q: Where can I add columns on the DOM like P&L and Bid/Ask Vols and Vol Historgrams (Vol Profiles)?

My DOM is still naked for now and I need to dress it up a bit :slight_smile:

Thanks,

  • P11

2 Likes

@Project11

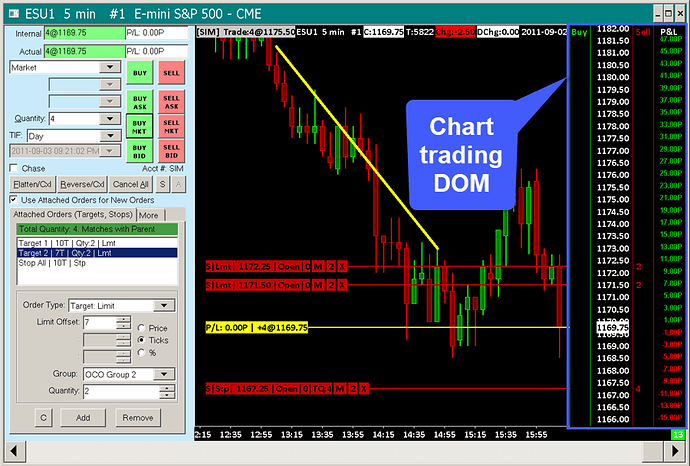
Correct there are two doms on Sierra Chart. There is the typical DOM as you have shown in your screenshot and there is a “Chart Trading DOM” as shown on the far right side of the window in my screenshot below:

Both function typically as you might expect, however, the normal DOM is packed with much more features and in my opinion, is the better option. The chart trading DOM must be interacted with right clicks, rather than the normal DOM which is much easier to interact with.

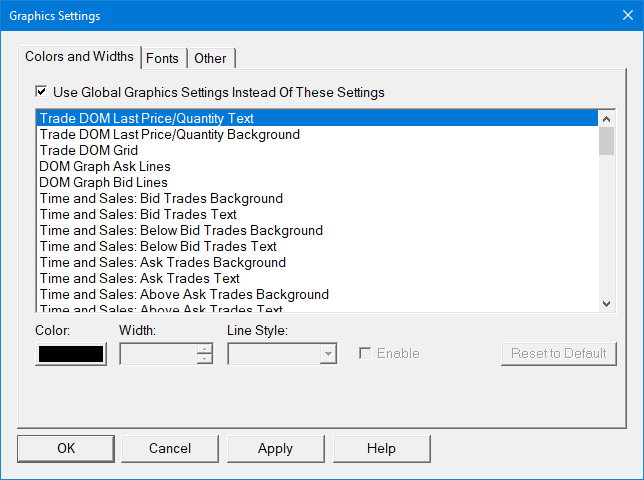
As for customization with your normal Trading DOM, I would first suggest opening up a DOM. Once a DOM is open: 1. Navigate to Chart > Graphics Settings. Within this window you’ll be able to customize graphics settings, line widths, colors, fonts, and much more.

image

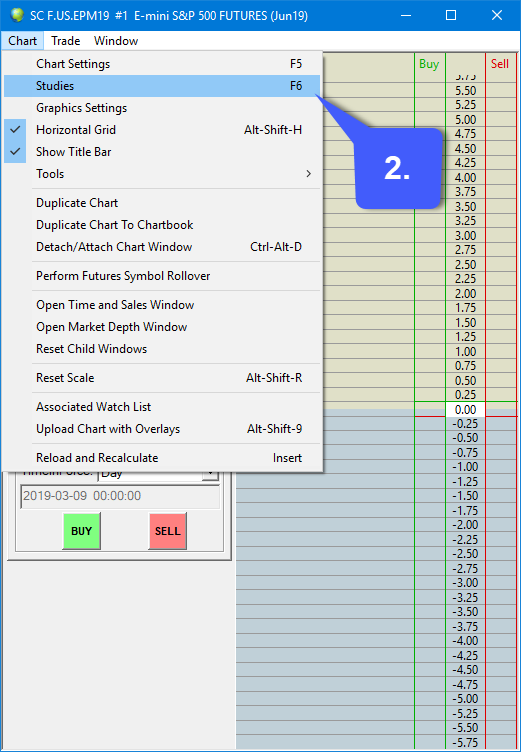
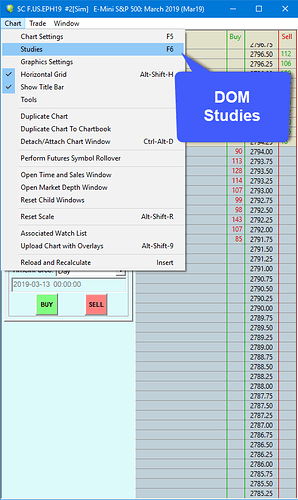
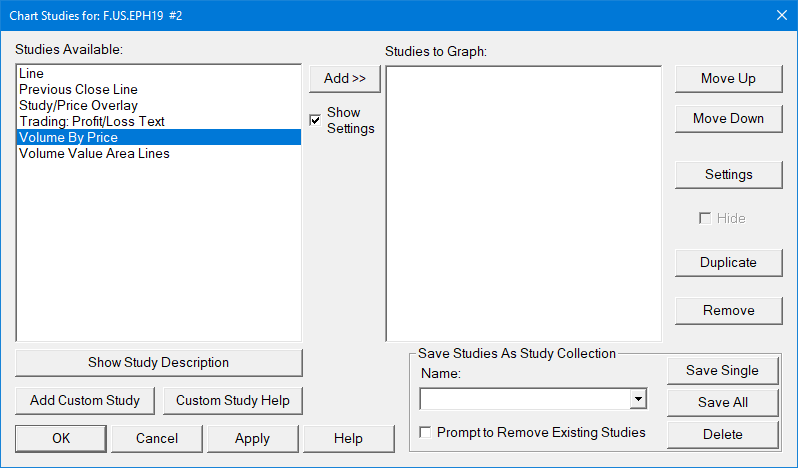
If you’d like to add columns such as Daily Volume profile, P/L, close lines and more you can do so by navigating back to 2. Chart > Studies. If done directly through the DOM, this will only display studies available for trading DOMS. If you’re looking for volume histograms, the study you would apply is Volume By Price. Feel free to mix and match studies and see what works for you.

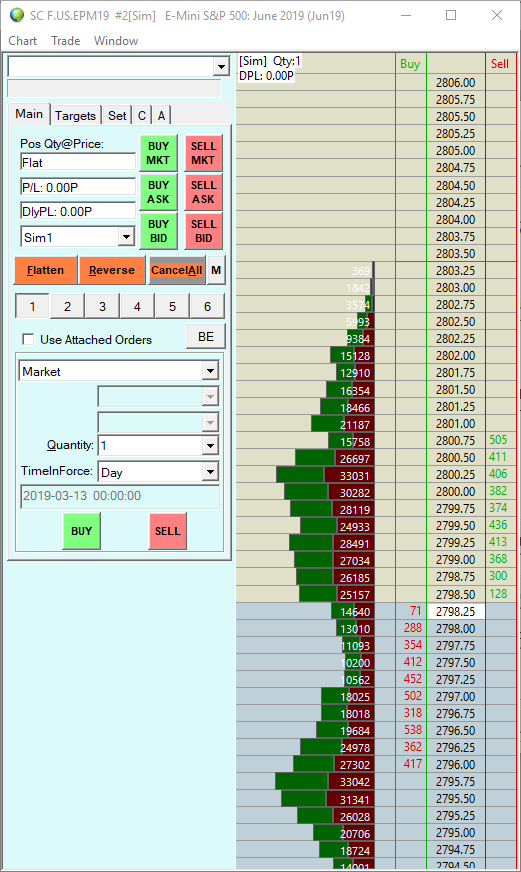
Shown below is a DOM with the Volume by Price study added to it:

I hope you found this helpful,
Jake
Optimus Futures Support :optimus_logo_no_backroug:

2 Likes

@Mod-JakeM,

  1. I am still not able to generate the vol sizes per level. Last column?
  2. How can I display the Vol size on the Vol histogram?

p.s. The snapshot is from your earlier pic.
Thanks much,

  • P11

1 Like

Hi @Project11,

Try this:

First, make sure you add the Volume By Price study to your DOM, this is crucial.

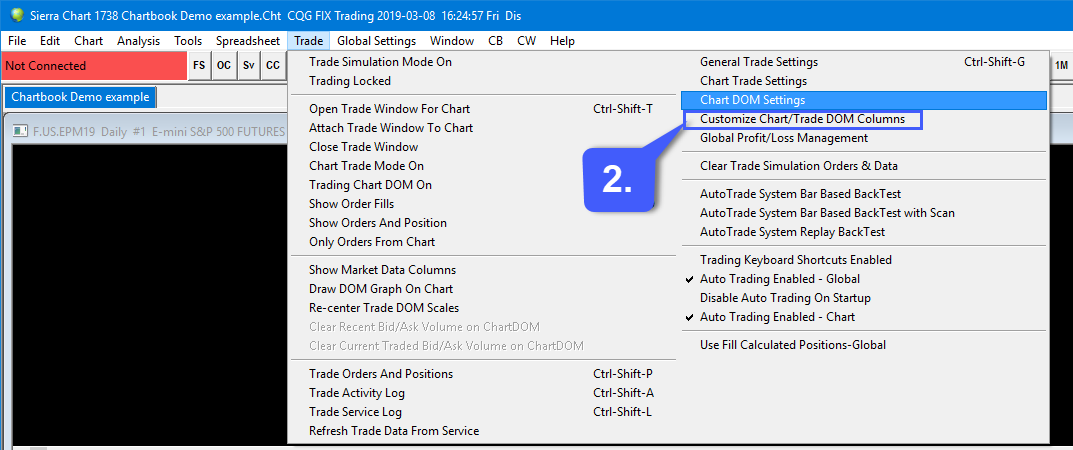
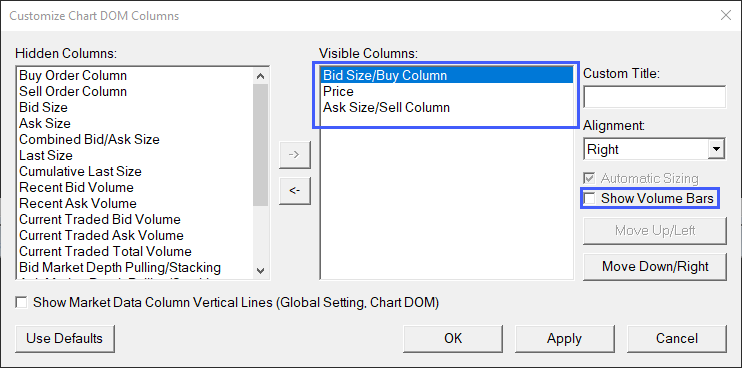
Second, double check that you have Bid size/Buy Column & Ask Size/Sell Column. This can be done by navigating to Trade > Customize Chart/Trade DOM Columns. Once within this window, you can add the respective columns to the visible column section. Also, highlight each option and make sure to enable the Show volume Bars setting as shown below.

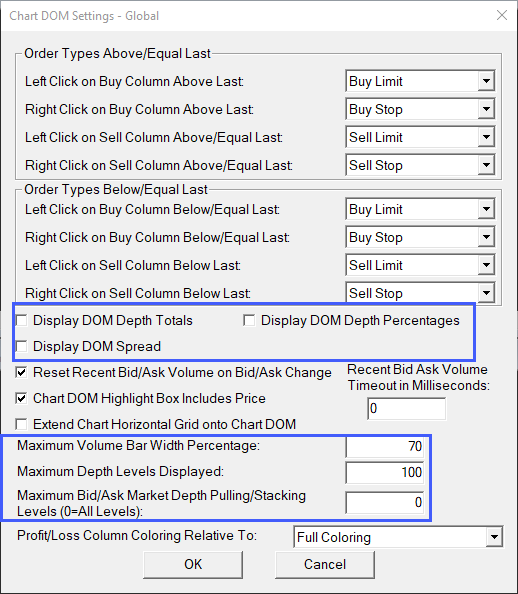
My last suggestion is to navigate to Global Settings > Chart DOM Settings.

Try and enable/disable the highlighted settings in the image below. I would suggest having maximum depth levels displayed to 100 if they are not already.

Please let me know if this works for you.

Thanks,
Jake
Optimus Futures Support

2 Likes

@Mod-JakeM,
Hmm, I was able to add the columns but the values for the Vols still do not show up (see pic).
I also, dont see the check box “Maximum Depth Levels Displayed:” under CHART DOME Settings.
Also, I noticed that the Chart DOM settings may be regarding the actual Chart DOM and not the regular DOM that I am working with. I also was not able to see the Chart DOM displayed yet.
I will try to go over the entire chain of steps again.
Hmm.

  • P11

Hello @Project11,

After some configuration, I believe I have found what you are looking for. You are right, the chart DOM settings I mentioned are not for the regular DOM, you may find those settings useful, but I do not believe they are what you were looking for.

Please follow the instructions below to replicate the DOM found in the previous screenshots as well as the one provided below. Please pay particular attention to step 7, I believe this is what you should focus on to replicate the screenshots:

  1. Go to your Trade DOM window.

  2. Select Chart >> Studies on the menu.

  3. In the Studies Available list, locate the Volume by Price study.

  4. Press the Add button.

  5. Press the Settings button.

  6. Select the Inputs and Settings tab if it is not already selected.

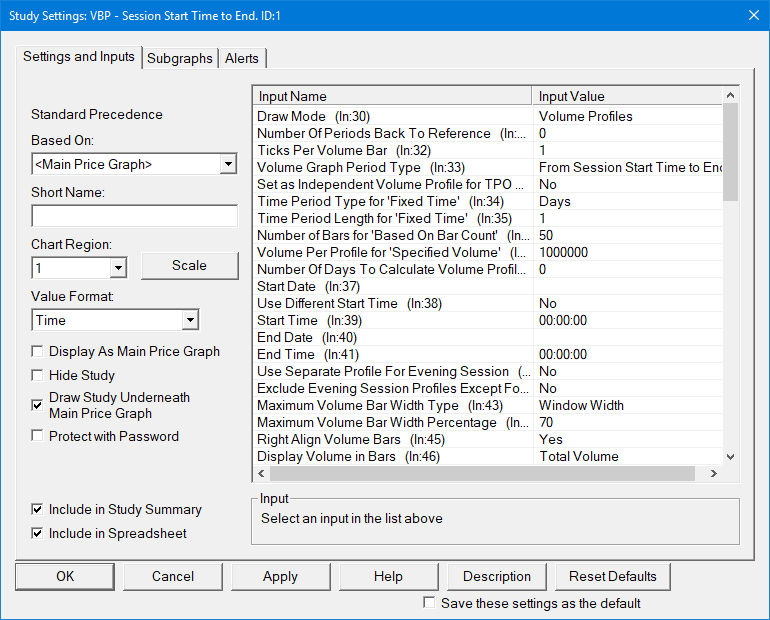
  7. Set the following inputs:

  • Ticks per Volume Bar to 1.
  • Volume Graph Period Type to From Session Start Time to End .
  • Maximum Volume Bar Width Type to Window Width .
  • Display Volume in Bars to Total Volume .
  • To align the Volume Bars to the right side beside the trading columns on the right side of the Trade DOM, set the Right Align Volume Bars input to Yes .

Feel free to also take a look at my settings window, you can replicate the settings by looking at the window if you’d like:

I hope this helps you finally achieve what you are looking to accomplish.

Thanks,
Jake
Optimus Futures Support :optimus_logo_no_backroug:

1 Like

@Mod-JakeM,
I did everything as you suggested and I still cannot see the volumes next to the prices to show up.
How can I reset the DOM settings to defaults? Maybe during manipulating the settings I check
something that is critical.
Thanks,

  • P11
1 Like

@Mod-JakeM ,
Also, I don’t see the option of TOTAL VOLUME in the drop down menu under
Display Volume in Bars to Total Volume as you suggested, hmm?

  • P11

@Project11

That is strange. To accomplish the DOM I included in the picture above, I started with a fresh DOM. I had nothing open besides the DOM and the DOM had no studies applied to it.

I would suggest closing all of your charts (including the DOM) and starting from scratch. Open a DOM with zero studies applied to it. If the DOM opens with a study, simply remove it from the studies window.

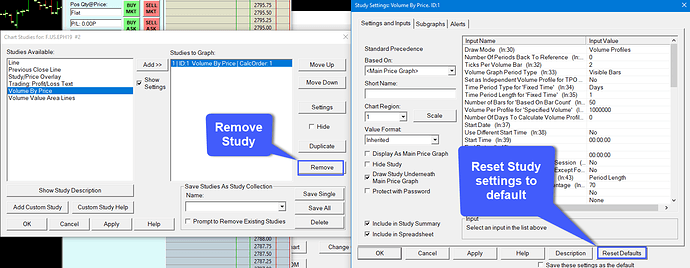
If absolutely necessary, you can revert the settings of a DOM study by opening Study Settings and then clicking the Reset Defaults button as shown below.

Its worth mentioning that it did take a couple of minutes for the volume bars/text to appear on my screen. Once it loaded in it has been working fine though. Please also keep in mind that you should also rollover your symbol to the June trading month if you haven’t done so already/

Let me know if you’re still running into issues. Maybe another study is interfering with the Volume by price study.

Thanks,
Jake
Optimus Futures Support :optimus_logo_no_backroug:

1 Like

@Mod-JakeM,
I did roll the symbol to June.
Will give it another push/restart/Reset Defaults.

We will get it done :wink:

  • P11

@Mod-JakeM,
No go. Still no volumes show up.
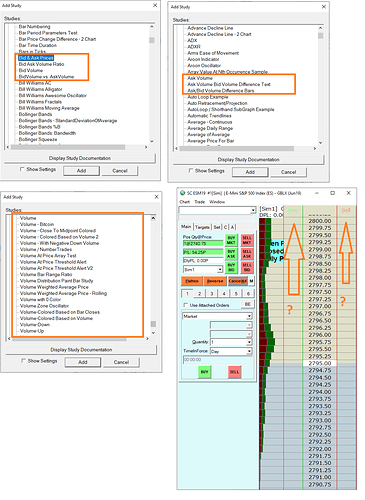
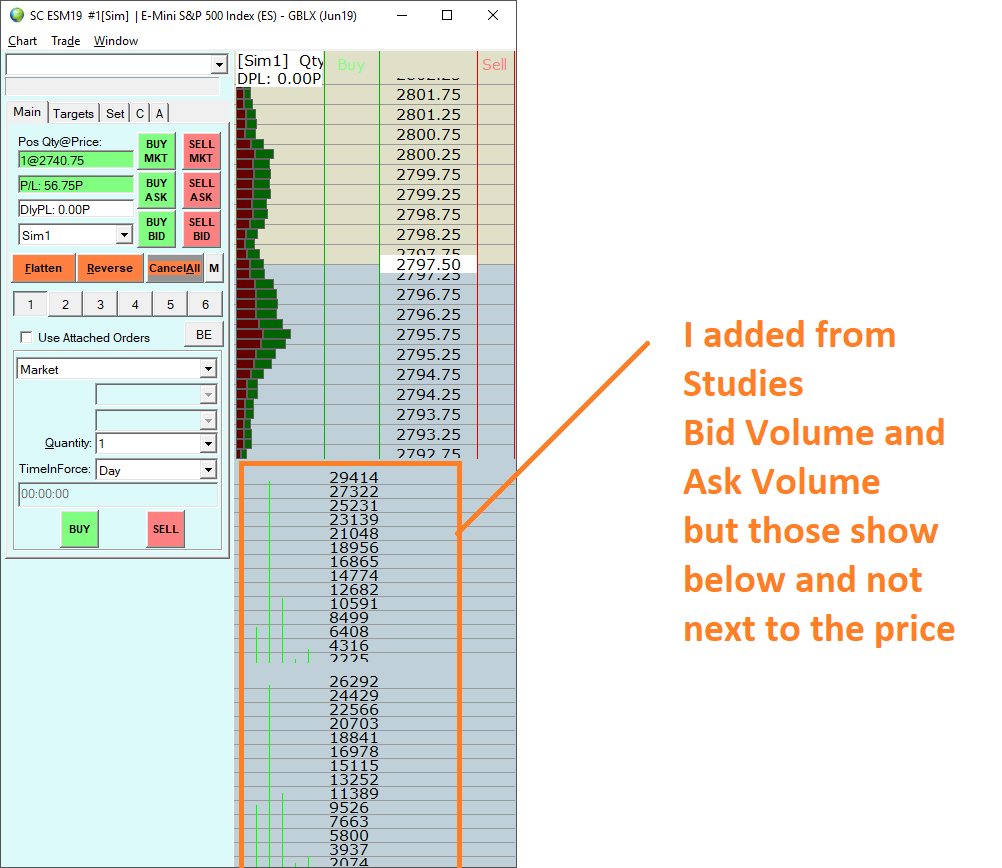
But when I try to add volume studies (see below) they all show up
below the DOM but I can’t to have the current PRICE VOLs to show up (neither on the Vol Histogram nor next to PRICE Ladder).
hmm.

  • P11

@Mod-JakeM ,
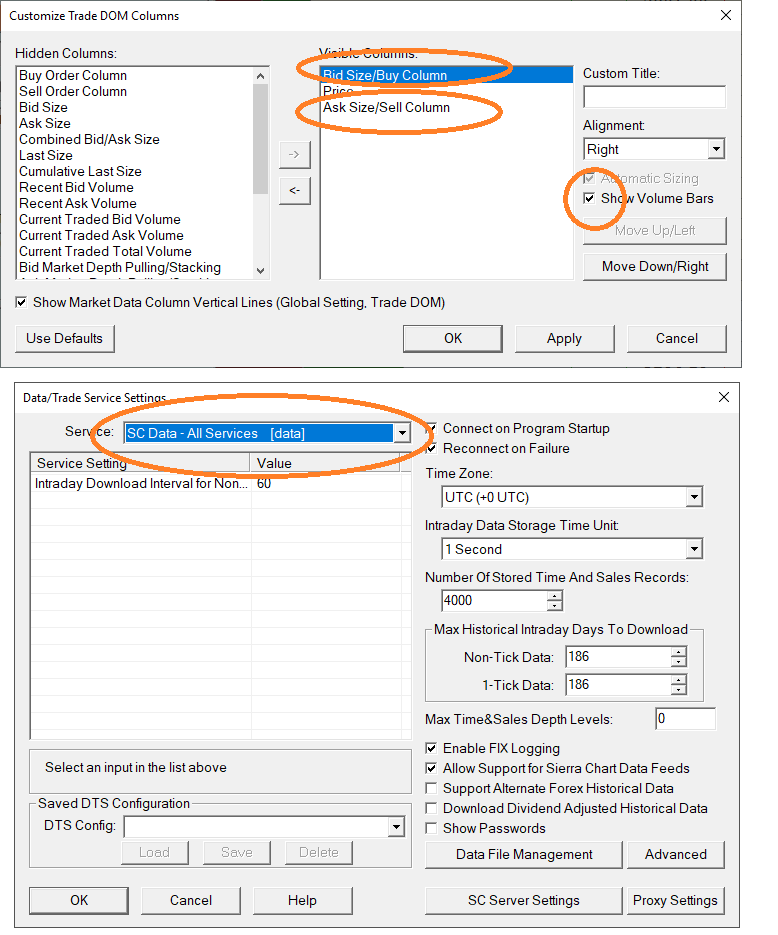
I also made sure I went to
TRADE > CUSTOMIZE CHART/TRADE DOM COLUMNS
and selected the BidSize/Buy Column and AskSize/Sell Columns
and checked SHOW VOLUME BARS.

Still, no vols show up on my DOM.
Strange.
Maybe I am not connected to the proper server?
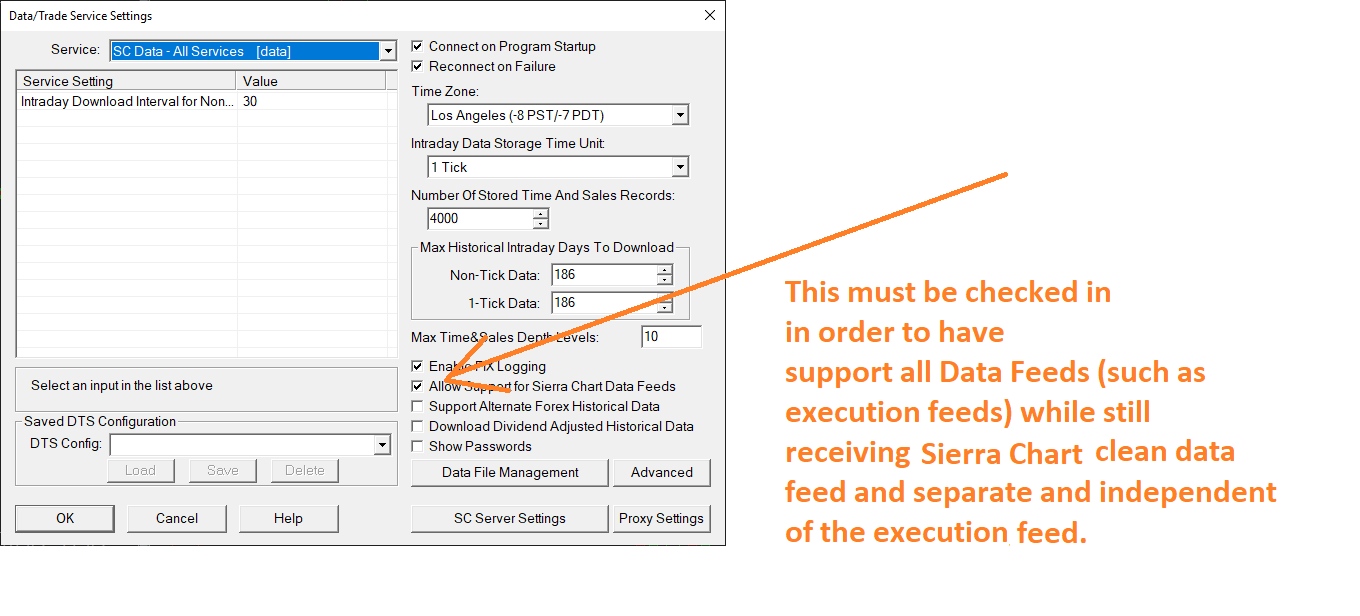
I am using SC DATA - All Services under DATA/TRADE SERVICE SETTINGS

  • P11

@Project11

I would suggest doing nothing under the Customize Chart/Trade DOM Columns at this point. If you are attempting to replicate the DOM I Have posted in the images above, please Open a DOM and then apply a study through the DOM Studies menu.

To do this first open a DOM, then navigate to Chart > Studies as shown below:

This will Only display studies that are available to the DOM. There are only about 6 available. I only added the Volume by Price study to accomplish the DOM posted in the reply above.

Once you add the Volume by Price study:

  • Set Ticks per Volume Bar field to 1.
  • Set Volume Graph Period Type field to From Session Start Time to End .
  • Set Maximum Volume Bar Width Type field to Window Width .
  • Display Volume in Bars field to Total Volume .
  • Finally, to align the Volume Bars to the right side beside the trading columns on the right side of the Trade DOM as shown in the screenshot, set the Right Align Volume Bars field input to Yes .

I’ve highlighted the necessary fields below to accomplish the look of the DOM you seem to be looking for. Please only focus on these fields. Please make sure to click the APPLY button in both the settings window as well as the Studies menu:

After attempting these steps if you still cannot replicate the image, I wouldn’t mind using a remote desktop software to remotely connect to your computer and reconfigure the settings for myself. I did not adjust any other settings to achieve the look shown in the image below. I only added the Volume by Price study and adjusted the fields posted above. I attempted this process 3 times now and I was able to replicate the image below by only following the several steps listed above. I also wanted to mention that I do not have Show volume bars enabled under the Customize Trade DOM Columns window.

Thanks,
Jake
Optimus Futures Support :optimus_logo_no_backroug:
(800) 771-6748

1 Like

@Mod-JakeM,

Good News!
It worked. Jeez-o-Pet’s.
For some reason before I didn’t see the TOTAL VOLUME under
Display Volume in Bars options but your last post was very clear and I finally got it.

I see the Vol Historgram Volumes and because the market is closed for the 15 min,
I guess I will see the Vols next to price once we start trading .
Now I can jump all in and start customizing the DOM and the CHARTS of Sierra Chart to my heart’s desire :slight_smile:

Thank you for your patience @Mod-JakeM, you are a true resource of Optimus and the traders
on this community!

Best Regards,

  • P11
1 Like

@Project11

Glad we were finally able to get this solved!

For any traders who may stumble upon this post in the future and are looking to replicate the DOM in the image below, I would suggest to strictly read the following quoted text. You may find the initial few post useful when configuring chart DOMs and other selective features, but if you would like to display volume levels (including text) on the DOM, follow the steps below:

1 Like

@Mod-JakeM,

Thanks. It all finally connected beautifully once I got my execution data connected.
It seems that now I can use the Sierra Chart (native) BarChart data for both intraday up to the tick,
real time DOM vols, Time & Sales and all instruments going back decades and also I can
execute using the execution data which for now is OEC / Gain Capital.

I love the fact that I am running Sierra Chart on the super stable, granular non-execution BarChart data
and execute on the OEC / Data.

Great setup.
Thanks for all of your help @Mod-JakeM,

Best Regards,

  • P11

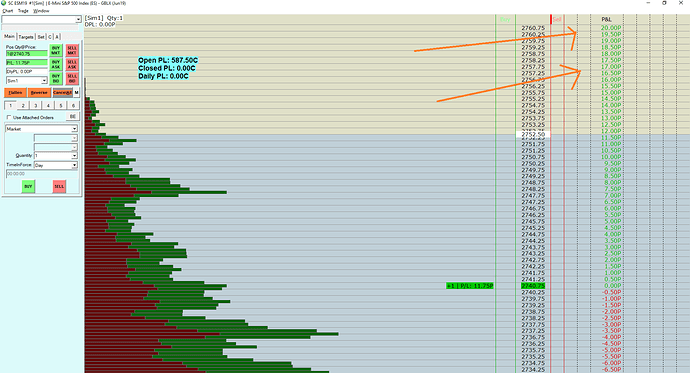
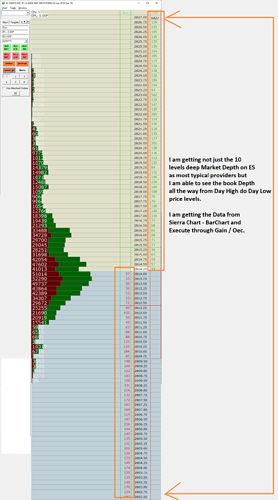
p.s. Included the pic of the full Depth of Market of the ES via Sierra. I can see not only the top 10-15 levels but can see the current liquidity all the way to High/Low of the day.

2 Likes

@Mod-JakeM,
Also, after careful reading of the Sierra Chart documentation (their docs are very straight forward and if one takes their time, I seem to slowly find many answers to my questions).
For example, my earlier quest to connect the data now works perfectly smooth.

For example, it clearly states in the documentation under:

Integration with Trading Services

… that I needed to connect my live account and also make sure I have the Trade Feeds Option
checked (See attached pic) and also a good idea is to restart Sierra Chart platform once the connection
has been established so all the the internal automatic symbol mapping gets completed between Sierra and my Execution data.

All of my earlier concerns disappeared once I was able to fully connect and see the power of the Sierra Chart data in conjunction with my Execution data.

I can now place orders on Sierra and see them instantly across all of my 3 Gain Capital platforms (Gain Trader, IBroker Mobile and IWeb platforms as a back up).

Sierra Chart can be a bit intimidating at first, but once I start clearing some bumps on the road,
I can see it’s power already.

Thanks @Mod-JakeM for all of your help.
Regards,

  • P11

2 Likes

@Project11

I’m glad we were finally able to make this distinction! Sierra Chart definitely has it’s learning curve, but once mastered, it is a robust platform that can be used in a multitude of ways.

Thanks for the insight as to how to make this process a bit easier for future users how may run into this issue. I’m sure they’ll find the links and screenshots you’ve posted very helpful.

Thanks,
Jake
Optimus Futures Support :optimus_logo_no_backroug:

1 Like