Futures Spread Trading. Question and Answers

Hi @Robert_Kinman and welcome to the community!
One of our members here @Digital_Jester is an expert in energy products and spread on those
He may be able to weigh in on software and energy spreads themselves.
Also, @jokertrader has some experience with spreads and he put some effort into finding the right software. I hope they chime in soon.

As a matter of legal disclaimer, spreads do not necessarily mean less risk than outright futures.
My colleagues above can explain how spreads could go in two different directions.

Thanks,
Matt Z
Optimus Futures

There is a substantial risk of loss in futures trading. Past performance is not indicative of future results.

1 Like

Thank you Matt!
Look forward to the Joker and the Jesters comments.

1 Like

Hi Robert…MattZ has some valid points so lets talk about pros and cons.
Pros: Reduced margin, lower volatility, many spreads are implied i.e. you can click and trade like a any other contract

Cons: Many of these spreads are not implied and you could have slippage/fills which you did not expect, more commissions (like lets take the FYT bond spread thats in a ratio of 3:2 - so thats 5 RT to trade 1 spread) and what Matt said that the 2 legs may not go in the direction that you want.Also charting and execution is highly dependent on platform

Here is something people dont normally tell you. Usually reduced margin and volatility means people take on larger risk and this could people in serious trouble. Also with spreads they are rarely day trades (they can be and thats what a lot of professionals do but their commission structure is WAY different than us) - so you are subject to uncertainty which means you have to have the right strategy to be able to hold overnight (i am guilty of both of these and paid the price)

So if you are directional then there are certain types of spreads, if mean reversion certain types of spreads and bottom line you should know when to get out

In summary, spreads are great and will open up a world of possibilities BUT you have to know your risks and your strategies (and you will need to know how to learn it - not freely available)

I am not deterring you but asking you to consider the different aspects and head in the right direction
reach out if you need more assistance
Joker

I am happy to discuss and welcome the opportunity to discuss with others - its kinda lonely in the spread world with retail

3 Likes

Some really great feedback @jokertrader . I see what you mean as to risk. The trader is taking the lower margin and then leveraging up their contracts, from a risk perspective, they won’t last long.

I once tried to do a cattle spread and I was not prepared for it. I was a few weeks early and the spread squeezed me out. I have been very curious about trying to ease into spreads that have better-defined ranges. I see what appears to be good ranges on the equities charts with the indexes. Keeping the back month 6months out. For example NQ Jun/Dec Calendar. Now are these ranges in your opinion good for a retail trader to trade to get their feet wet? Something tells me, even with these ranges so well defined, that everyone would be doing them, so it will probably not work. I am only as good as the spreads I can pull up on a chart. I have only looked at a few things without much direction.

I can answer platform or how to questions here but not strategy/trade questions (also with the the NQ Jun/Dec would not have the foggiest)

From what you seem to have researched, you are looking at calendar spreads and something like

  • Moore’s research (MRCI) could be a resource for you,
  • there is Joe Ross who teaches spreads and has a newsletter (on the more expensive side)…there are - others like spreadcharts.com (website to chart is free but they do offer a newsletter)…
    Also seasonalgo.com (thats a more comprehensive tool and they do offer training)
1 Like

@jokertrader

Fully understand man. I to want to first thank you for the information you have given. I think the best thing for me to do is fire up some sims and just trade various spreads at no cost to me. I will continue my research as I am hungry for it.

Joker, if you don’t mind me asking. What got you started into spreads? What kept you with them after?

1 Like

I’ll try and make a couple of posts over the next few days.

First lets talk about spreads or more specifically futures spreads as option spreads are even more complicated. There are two types of spreads, exchange listed spreads and custom spreads. Then there are two types of exchange listed spreads implied and non-implied.

Exchange Listed Spreads :- These are spreads that trade on the exchange as a single instrument but hit your account as multiple instruments. They transact as a single transaction, hence no legging risk. For example the Crude Oil Jun20/Jul20 spread or CL M/N. If you buy this spread at -$2 what will actually hit your account is a buy of CL Jun20 with a price $2 below a corresponding sale of CL Jul20. NOTE not all spreads are quoted the same way. If you buy the S&P 500 eMini Jun/Sep spread or ES M/U at -850 what will hit your account is a buy of Sep20 (Not Jun20) 850 points below the corresponding sale of Jun20. The Exchange lists Calendar Spreads in almost every product there is but they also list cross-commodity spreads as well. Obvious examples are crack spreads in energy (eg Heating Oil vs Crude Oil), the crush spread in Ags (Soybeans vs Soybean Oil or Meal) , the TED spread (Treasury Bills vs three month libor or Treasury-Eurodollars). Spreads have the advantage that the bid-ask is often tighter than the bid-ask would be in an individual outright contract. The margin requirement for a spread is also significantly lower than that of an outright. They have the disadvantage that your pay 2 (or more commissions)!

Implied vs Non-Implied Spreads :- Exchange matching engines are complex and have the ability to calculate multiple levels of implied pricing. An implied price is two orders in different instruments which when combined ‘imply’ a price of a third instrument. For example imagine trader A is trying to buy June Crude at $20 and that trader B is trying to sell the June/July spread at -$2. The exchange will also show a bid in July at $42 which is the June bid plus the June/July spread. This is called a first order implied. CME’s Globex calculates both first order and second order implieds. ICEs matching engine calculates siz orders of implieds. If Trader C then sells the July at $42 the following trades will happen

Trader A buys June at $40 from Trader B

Trader C sells July at $42 to Trader B.

Trader B sells June at $40 to A and buys July at $42 from C. Hence selling the spread at -$2

Whether the implication is switched on is different market by market. Nearly all the energies have implieds switched on. Things like equity indexs, currencies and CME bitcoin do not have the implieds switched on. When implied markets are not switched on, the best available market may not be the market shown. Expanding our example above assume implieds are not switched on, so there is no visible bid in July. Trader D comes along and bids $41.98, which is now the best SHOWN bid in July. If I am trader D and I can buy July a $41.98, I would then sell the June at $40, buy the June/July at -$2 and collect my 2c arbitrage profit. In reality that is very difficult to do in modern times as there are so many superfast computers trying to do it.

Non-Exchange Listed Spreads or Custom Spreads :- This is where things can get fun as it can be any spread you can dream of. Gold/Silver Ratios, any commodity in a Non-USD currency (eg Gold in Euros), mmBtu Spread (Crude vs Natural Gas), arbitrage spreads S&P 500 eMini vs Micro. These can be difficult to execute. Worst case you are manually executing multiple legs and giving up lots in slippage and crossing multiple bid-ask spreads. There is software out there that have ‘spreaders’ or ‘autospreaders’ specifically designed to do this. If your interested in this take a look at this thread New with Futures trading and looking for something powerful charting (Spread chart) - #5 by Arman_shah

3 Likes

I think spread trading is unpopular for several reasons

  1. It’s not as intuitive to most people. I say this from two perspectives. First the fundamentals that effect a spread are or can be very different than what effects an outright and secondly a lot of people just struggle with the math/numbers concept.
  2. Most retail software does a bad job of showing spreads and some retail software won’t even allow spreads (eg Tradestation)
    2b. Backtesting a spread strategy is almost impossible.
  3. The combination of poor execution options meaning high slippage and retail commissions often means spread trading is not economically viable. (Which is probably why retail software is so bad at it).

Saying that spread trading is extremely popular with professionals. Of course professionals have the advantage that they can afford to have the more expensive software, have seat leases for lower commissions etc that all make spread trading easy and more economical.

NQ as in CME Nasdaq 100 eMini? As a rule there are two types of futures spreads, those that exist because there is spread risk that needs to be managed (eg Crude Oil calendar spreads, cross commodity spreads) and spreads that exist almost entirely to allow people to roll their positions from one contract to the next when close to expiry. The equity index spreads fall into that category. The NQ M/Z spread is a calculatable value which is a function of dividends and interest rates. This is why forward equity futures have lower prices than the spot contract. The dividend yield is higher than the interest rate. So if you bought the stocks in June, held for six months, you would make more in dividends than it costs to borrow the money, so you can afford to sell below your purchase price and still make money. This is what we call an arbitragable situation. Once the spread differs from the arbitrage boundaries somebody will perform the arbitrage, since it is in theory a riskless profit. Hence by trading the NQ M/Z spread you are betting on the dividend rate and interest rates, and not equities!

Currencies work in a similar manner. The difference in the 6E M/U spread is a function of the difference in US and Euro interest rates. You can borrow in Euro’s lower than you can invest in USD so the forward exchange rate has to reflect that otherwise it would be a risk free profit.

It used to be that it was possible to find relationships like that and take advantage of them as they were just to small for the big firms to think about. Unfortunately it’s become so easy to run Algo’s and there are enough small guys looking for these opportunities that they are now very difficult to find.

In comparison Commodities time spreads do not have as defined arbitrage rules that keep them in line. In theory spreads are capped at the cost of carry (interest expense) plus the cost of storage but that rule assumes that storage is unlimited. The recent activity in crude oil shows you what happens when that assumption becomes invalid!

Maybe not answering the question you specifically asked but I will say this. Spreads are a lot more difficult to get started on, and generally take a lot more work. They are a lot less glamorous. To be good at spread trading is not easy. Saying that if you do your homework I believe you can have a higher win rate trading spreads assuming you can overcome the difficulty to execute and double commissions!

As additional advice I would say that physical commodity spreads close to expiration are the domain of the traders that trade the physical. As such I would advise against holding spreads, or any contract that is very close to delivery.

4 Likes

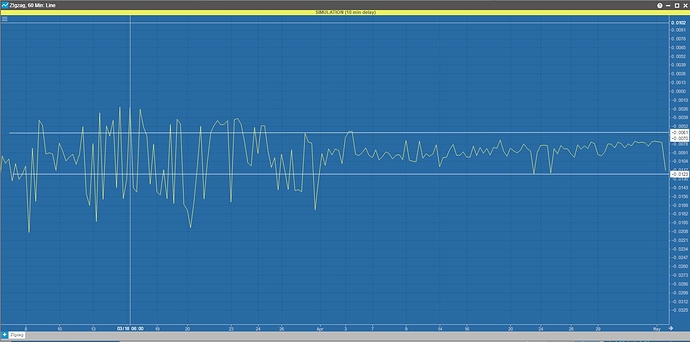
Mr @Digital_Jester is very knowledgeable in this arena. A caution for the readers and a question from me if someone can answer this… There are many spreads that i try and test. I find a stationary series of three or more instrument and then try to plot them. My goal is to make the graph so ZIGZAG around Zero or some number. However, we need to be really cautious about the fact that most of these program plot the graph using “last price” which is completely misleading in my opinion. If anyone know how to plot with midpoint or bid and ask separate lines that will be great.

this is a calendar spread or 6E futures. the spread on these are 0.00005 or even if we X2 still 0.00001. The oscillation is clearly way above and below the spread zone. Which means it should be profitable. But we know that its not that easy. Any suggestion @Digital_Jester to make it appear more practical ?

2 Likes

@Arman_shah as I explained above there are some spreads that are defined by arbitrage-able conditions and 6E M/U as illustrated is a prime example of that. You can put out some quotes in that spread and you may get some odd lot fills. I have tried this and have generally found that an Algo will automatically tick you until your close enough to value that your not going to make enough money to make it worth your while.

When trying to plot any spread you can plot one of two things. You can plot last print to last print which can be wildly inaccurate because the print in the less liquid contract could be stale by minutes or even hours, especially if your talking about ES or 6E. Or you can plot the actual trades in the actual exchange listed spread. If your plotting CL M/N this will work nicely but if you plot ES M/U or CL Z24/Z25 the spread trades so rarely the chart is meaningless. Of course if there is no exchange listed spread your left with last print to last print which is unrepresentative at best. You can also print/analyze settlement prices but even they can be a little, ‘screwy’ for lack of a better word and probably doesn’t have the granularity you are looking for but could be more suited for more medium term trading.

Quoting an email I received this morning

Sadly, beginner traders fall prey to these soothing ideas pretty often. In the real world there are only two ways you can make money trading the markets:

  • Taking on risk that others won’t
  • Exploiting market inefficiencies

The beauty of spread trading is it can often combine both.

As for stationary series, you are definitely thinking correctly but you need to get out of the box that everybody else is thinking in. Try coming up with two, three, four or more instruments that when combined are stationary but stay away from the obvious especially the financials, I would recommend the very to semi-liquid commodities. In your original post you mentioned CL spreads and Brent/CL spreads so how about trying a combination of say CL and BRN/BZ maybe even RB & HO or even GAS. The more legs and the more deferred the contracts the more likely it will be stationary. You may want to convert to similar units, but since ratios are not always constant that may not be the case. (My choice would be to convert and then try different rations of the converted prices/units). What you find is not going to trade 100 times a day but if you can trade it two or three times a day and make say one or two ticks on each (after slippage and commissions) that quickly adds up. Two trades times two ticks is $40/day which 250 days a year is $10k. If that doesn’t sound like enough, then find a second and then a third and it eventually does become enough. This is what prop traders do. They sit around all day long, day after day, collecting the ticks that nobody else wants! One of most consistent trades I have (which isn’t necessarily the same as most profitable) is a 5 legged Energy Spread which even has different quantities on the legs.

Let me be clear. I am not trying to paint the picture this is easy. It’s actually very hard. Even if you find the right relationship the execution of it could make it un-viable. It involves hard work, an understanding of what could work and why, you need to understand the markets involved, the math, the software, how the matching engines work and what could go wrong. If it was easy everybody would do it. There’s a reason very few even try. But if you can get it to work…

5 Likes

Thank you @Digital_Jester. I understand and know exactly what you mean. And this is what i am doing. I always get stuck at “testing” part. I thought i was an idiot for not being able to do it but when you mentioned that those are actually impossible to backtest that kinda gave me a sigh of relief… lol

But… one of things what working at, is (inter-market spread) - (inter-market spread). Maybe if you have practice with trading technologies you can confirm this or post some sort of working graph. I started with CL-BZ (any month) then i thought it would make sense to do like (CLM20-BZN20) -(CLQ20-BZQ20). The spread on this whole thing is 12 cents. we can obviously play around with the months for each but i cant imagine that they wont deviate enough to give 10 cents profit. (which as you said is way more than enough for a couple of hours).
Problems i face: Charting it in TT gives a great looking graph but in TWS its a straight like. In ThinkOrSwim, the graph is good when I trade it it doesnt move nearly as much. I am still learning TT, i am not sure what it is capable of. (Maybe you can post some of your analysis here?) but for now i cant even seem to get the trades right on TT. Not sure if its the problem because of demo or what. Alot of the brokers/providers do that. They specifically make it bad in demo so it forces you to buy just to try. BTW above doesnt even have to be related, this would work with any instrument combination.

2 Likes

Seems like your asking two related questions, one theory and one specific to TT.

Re: The Theory I don’t have a PhD in Quantitative Finance so can’t tell you what the text book answer is, but I can tell you how I think about, and that seems to work for me. Like all trading your either trend/breakout trading or mean reversion trading. When looking for stationary series your mean reversion trading. The problem is what I think of as ‘constant maturity’. If you analyze two stocks say MSFT vs INTC, both of those stocks are the same as they were two years ago. When you analyze CL M0/N0 though, that is not the same as it was two years ago. Currently CL M0/N0 is prompt crude vs 1st deferred crude. Two years ago it was 24th deferred vs 25th deferred. Obviously it behaves differently than it did two years ago. This raises the question, what should you be looking at? It’s almost impossible to create a continuous spread contract like software programs create continuous outright contracts. That’s why I said it’s virtually impossible to back test ideas like this. So should you be comparing CL M0/NO now verses how CL K0/MO behaved a month ago, and CL J0/K0 two months ago? The problem with doing that is there could be seasonality involved. So there could be a reason why say F/G behaves differently than M/N even when looking at similar time to maturity. So should you be comparing CL M0/N0 versus CL M9/N9 last year and CL M8/N8 two years ago?. Unfortunately I do not believe there is an easy answer.

Re: TT The data is all on TTs side not the Broker so I can’t see how your Sim data would be different. What will be different is how you get fills. As discussed charting any of these things is very difficult. I can’t show you how I do it because I don’t chart with TT like you are trying to do. Regarding your specific combination, BZ is not very liquid when compared to CL. at time of writing BZN0 has traded 23k lots versus CLN0 218k. Of those 23k about 9k are time spreads, over 1k are CLBZ spreads and 2.5k are spreads to RB or HO. So BZN0 has only traded about 10.5k lots as a stand alone product. You’d probably get a better chart if you used BRN instead of BZ but suspect you don’t have ICE data. Even if you did adding in the cross exchange component to any spread like that will increase slippage.

6 Likes

Right. If that wasn’t the case Vix contract alone could make anyone a billionaire in a couple of years. Really all those products launched by CBOE on volatility that failed, Its beyond me why people didnt trade such predictable moves.

So my idea was to always trade contracts 2-3 months in expiry. Like every year trade August in May-June… and so on… If you feel comfortable, what method of pair/basket trading you are doing? Copula or cointegration?

2 Likes

I’ve looked at cointegration but it’s difficult to apply when your data isn’t continuous. I’ve never looked at Copula’s. I do all my analyze based upon settlement prices although I do trade my models intra-day.

2 Likes
`[quote="Arman_shah, post:10, topic:3470, full:true"]

My goal is to make the graph so ZIGZAG around Zero or some number. However, we need to be really cautious about the fact that most of these program plot the graph using “last price” which is completely misleading in my opinion. If anyone know how to plot with midpoint or bid and ask separate lines that will be great.
[/quote]`

Hello @Arman_shah,
I have the same problem with spreads especially when I want to scalp a calendar spreads since I use Tradingview spread charts they use the bid price on both legs and when I want to trade the exchange-listed spreads the spread is entirely different because the exchange calculates the offer price of the first leg and bid price for the second legs (in buying situation) I wondered if you find any solution for this problem? since you posted it 10 months ago.

Hello @Mod-MattZ,
Please, if you have also any solution to my problem I appreciate it if share it with me.

Thank you
Alan

Hello @Alan, Well the right answer is any perfect arbitrage like CL calendar spread are impossible to execute by a retail trader. @Digital_Jester gave this answer here and this is loaded with correct information.

Blockquote

as I explained above there are some spreads that are defined by arbitrage-able conditions and 6E M/U as illustrated is a prime example of that. You can put out some quotes in that spread and you may get some odd lot fills. I have tried this and have generally found that an Algo will automatically tick you until your close enough to value that your not going to make enough money to make it worth your while.

When trying to plot any spread you can plot one of two things. You can plot last print to last print which can be wildly inaccurate because the print in the less liquid contract could be stale by minutes or even hours, especially if your talking about ES or 6E. Or you can plot the actual trades in the actual exchange listed spread. If your plotting CL M/N this will work nicely but if you plot ES M/U or CL Z24/Z25 the spread trades so rarely the chart is meaningless. Of course if there is no exchange listed spread your left with last print to last print which is unrepresentative at best. You can also print/analyze settlement prices but even they can be a little, ‘screwy’ for lack of a better word and probably doesn’t have the granularity you are looking for but could be more suited for more medium term trading.

Quoting an email I received this morning

Sadly, beginner traders fall prey to these soothing ideas pretty often. In the real world there are only two ways you can make money trading the markets:

Taking on risk that others won’t
Exploiting market inefficiencies
The beauty of spread trading is it can often combine both.

As for stationary series, you are definitely thinking correctly but you need to get out of the box that everybody else is thinking in. Try coming up with two, three, four or more instruments that when combined are stationary but stay away from the obvious especially the financials, I would recommend the very to semi-liquid commodities. In your original post you mentioned CL spreads and Brent/CL spreads so how about trying a combination of say CL and BRN/BZ maybe even RB & HO or even GAS. The more legs and the more deferred the contracts the more likely it will be stationary. You may want to convert to similar units, but since ratios are not always constant that may not be the case. (My choice would be to convert and then try different rations of the converted prices/units). What you find is not going to trade 100 times a day but if you can trade it two or three times a day and make say one or two ticks on each (after slippage and commissions) that quickly adds up. Two trades times two ticks is $40/day which 250 days a year is $10k. If that doesn’t sound like enough, then find a second and then a third and it eventually does become enough. This is what prop traders do. They sit around all day long, day after day, collecting the ticks that nobody else wants! One of most consistent trades I have (which isn’t necessarily the same as most profitable) is a 5 legged Energy Spread which even has different quantities on the legs.

Let me be clear. I am not trying to paint the picture this is easy. It’s actually very hard. Even if you find the right relationship the execution of it could make it un-viable. It involves hard work, an understanding of what could work and why, you need to understand the markets involved, the math, the software, how the matching engines work and what could go wrong. If it was easy everybody would do it. There’s a reason very few even try. But if you can get it to work…

Blockquote

Anything that can be executed as arbitrage by retail traders gets into a trend, means you do not know when it is coming back to zero. As @Digital_Jester explained above look for more than two legged basket to trade. Another tip would be that any prime brokerage would want to keep exchange margin. Meaning a couple of thousands dollars to open a two legged spread let alone 4 or 5 legged ones, and if you end up making 10$ or you need to do it 100s of times before you can double your bet. So my suggestion is that depending on the amount you have start with the smaller offshore forex brokers like Icmarkets and once you have gained enough capital you can move on to bigger brokers for real trading. The advantage of that is these brokers provide humongous leverage and very very accurate pricing and execution. Plus on the platform like MT5 you can make custom algos to plot it with Bid or Ask price or both… or better yet Use these brokers (although they have limited products but you will find quite a lot still) use them for charting and use proper brokers for execution. There are sooo many ways it can be answered but i am gonna leave it here for now.
1 Like

Hello @Arman_shah,
Thank you very much for your answer, my broker offers spreads and in the example of CL the good thing is you can put a limit order on the spread but I can’t get a chart on exchange spread quotes,

Regarding forex brokers I had been trading with them for a long time but I have a interest in arb systems because its less correlated to markets

Thanks a lot for your insights. I’m highly interested in exploring market inefficiencies and correlations. Currently I’m backtesting certain automated stratgies under ideal conditions. Two years later, is it still worth to dive into the theorie of spread trading or do HFT algorithms eliminate any opportunities?

Chris

Start a new thread titled “Method in Futures Trading” and ask the same question to initiate a new discussion. I will contribute to the topic.

Matt Z
Optimus Futures

2 Likes

@Arman_shah
I know this is an old thread, but i’d love to hear back from you. Are you still doing spreads? How profitable/not-profitable is it after 4 years? I’m just getting started so wondering if it’s worth getting into spreads at all for a small account retail trader. TIA