I am not seeing the invite, do you want to send again or paste your profile here?
Thanks so much.
I am not seeing the invite, do you want to send again or paste your profile here?
Thanks so much.
I want to keep the identity and profile confidential.
Please email me each of you with a request and I’ll make the intro.
Ideally, you keep interacting here to create content for our users.
Matt
Gotcha thanks Matt. Will do and have a great Easter!
The same to you and have a great weekend.
Matt
Thanks, we are connected now.
Absorption vs. Aggressive Selling. 4/7 Wednesday Market Behavior.
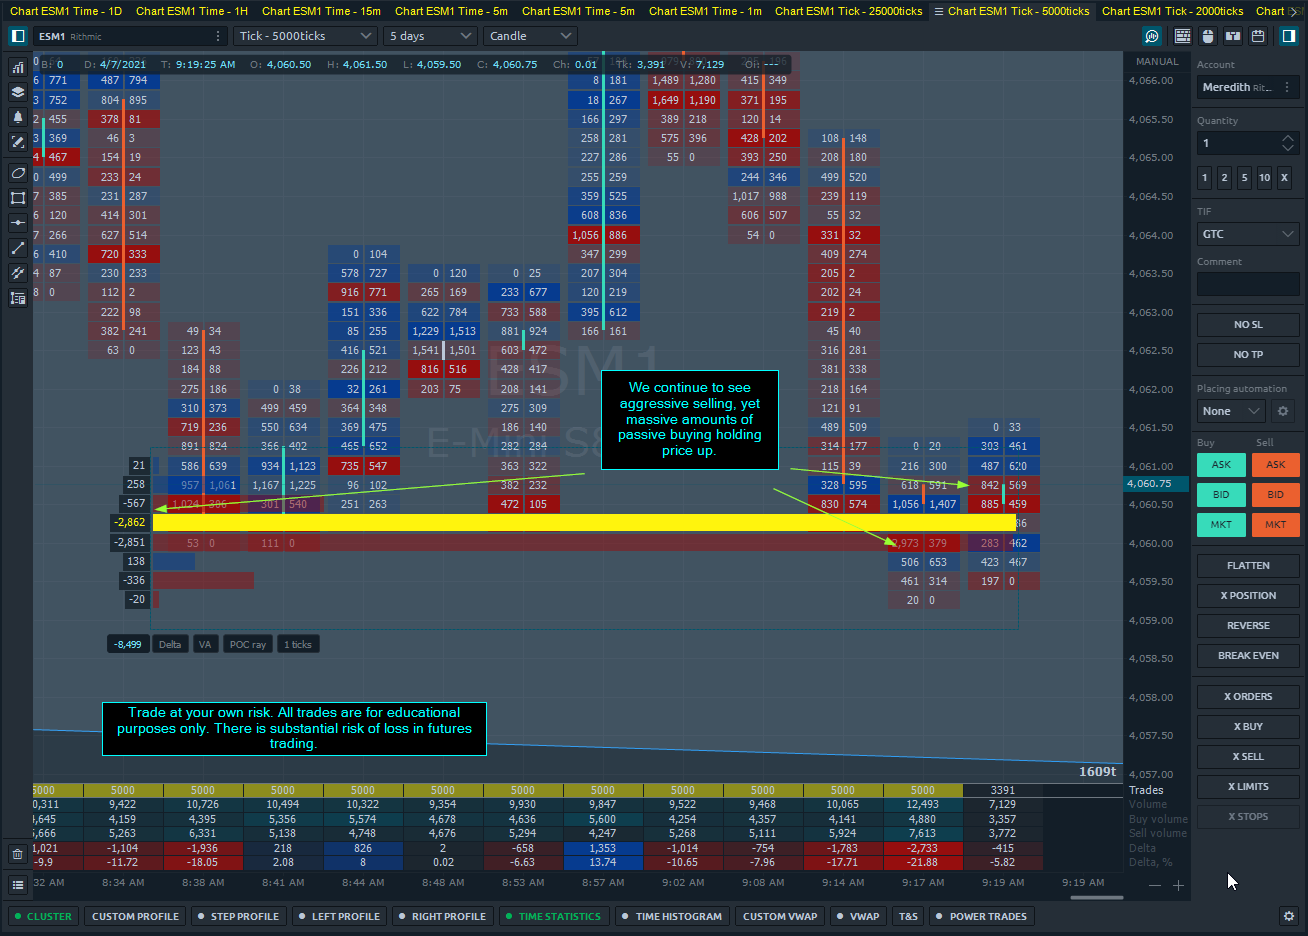
On the S&P thread for the last few days we have pointed out that the market is seeing much more aggressive selling than buying, yet price is unable to break any significant resistance.
This has been attributed to the large quantity of passive buyers absorbing selling that comes into the market, preventing price from moving below support.
The question I’m asking is how long can passive buyers hold this market up? What do participants need to see for price to move lower?
It’s hard to see the buyers continuing to hold up such massive selling power. If the aggressive selling continues in the way it has, price potentially can move much lower, forcing the longs out of their position.
However, any short position that is taken will be closely watched.
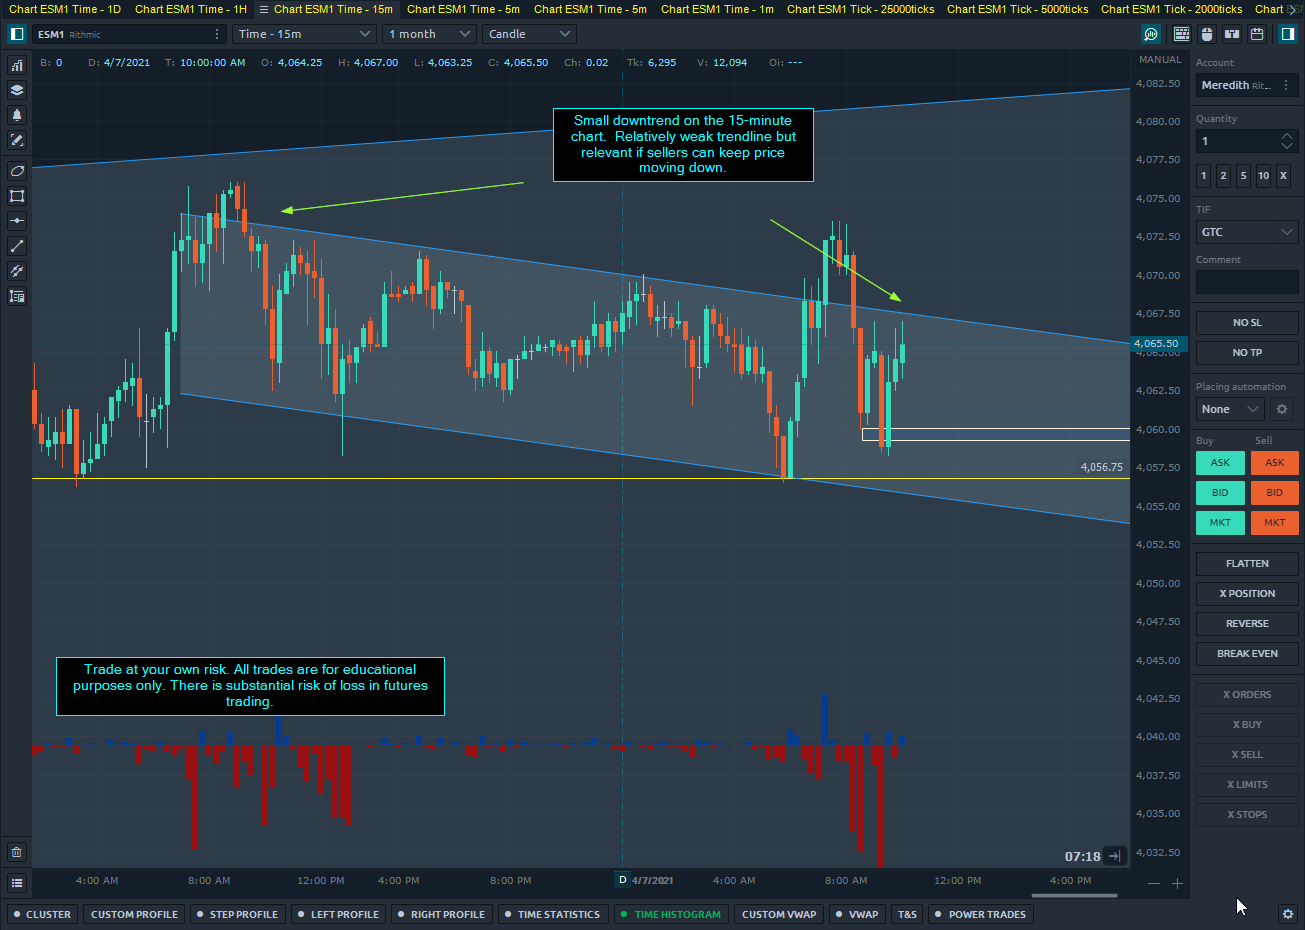
Downtrend on 15-minute chart - Watching sellers to see if they can keep price moving down.
Price has followed a short-term down trend on the 15-minute chart. A short position here would require sellers to fend off aggressive buyers from driving price above the top channel.
We also need to see follow through on the downside with a target of our support at 4056.75 initially.
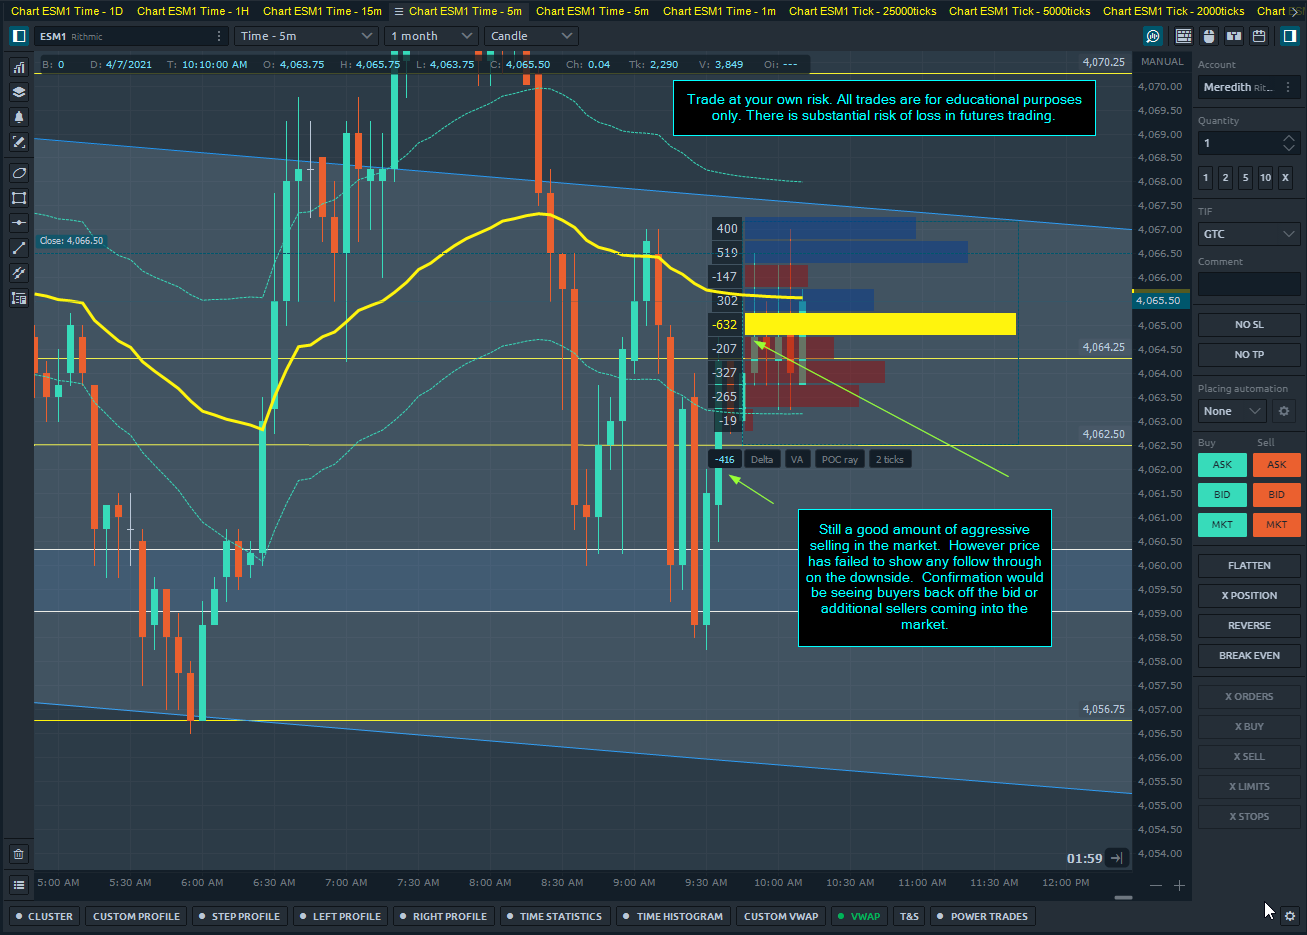
The custom profile shows aggressive selling slightly dominating buyers, but we still need more confirmation from price that there is potential for the market to move down.
Currently in a short position waiting to see if more sellers come to the market and push price down. So far, unfortunately for the shorts, buyers continue to show us that they are willing to absorb sell orders which is keep price high.
There is a substantial risk of loss in futures trading. Past performance is not indicative of future results. The figures here represent an opinion. The placement of contingent orders by you or broker, or trading advisor, such as a “stop-loss” or “stop-limit” order, will not necessarily limit your losses to the intended amounts, since market conditions may make it impossible to execute such orders. Please conduct your own due diligence if Futures are an appropriate instrument for you.
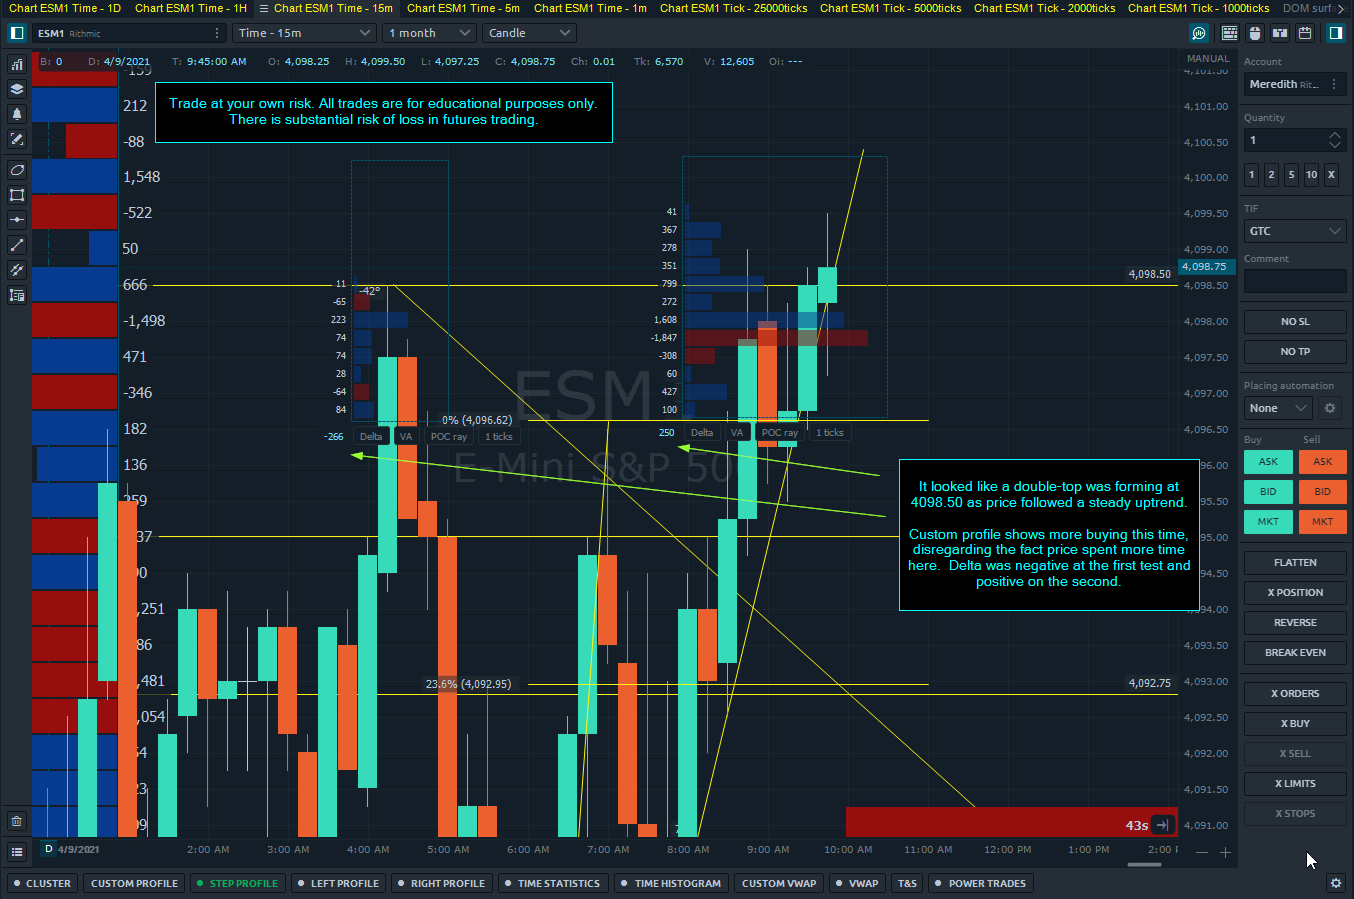
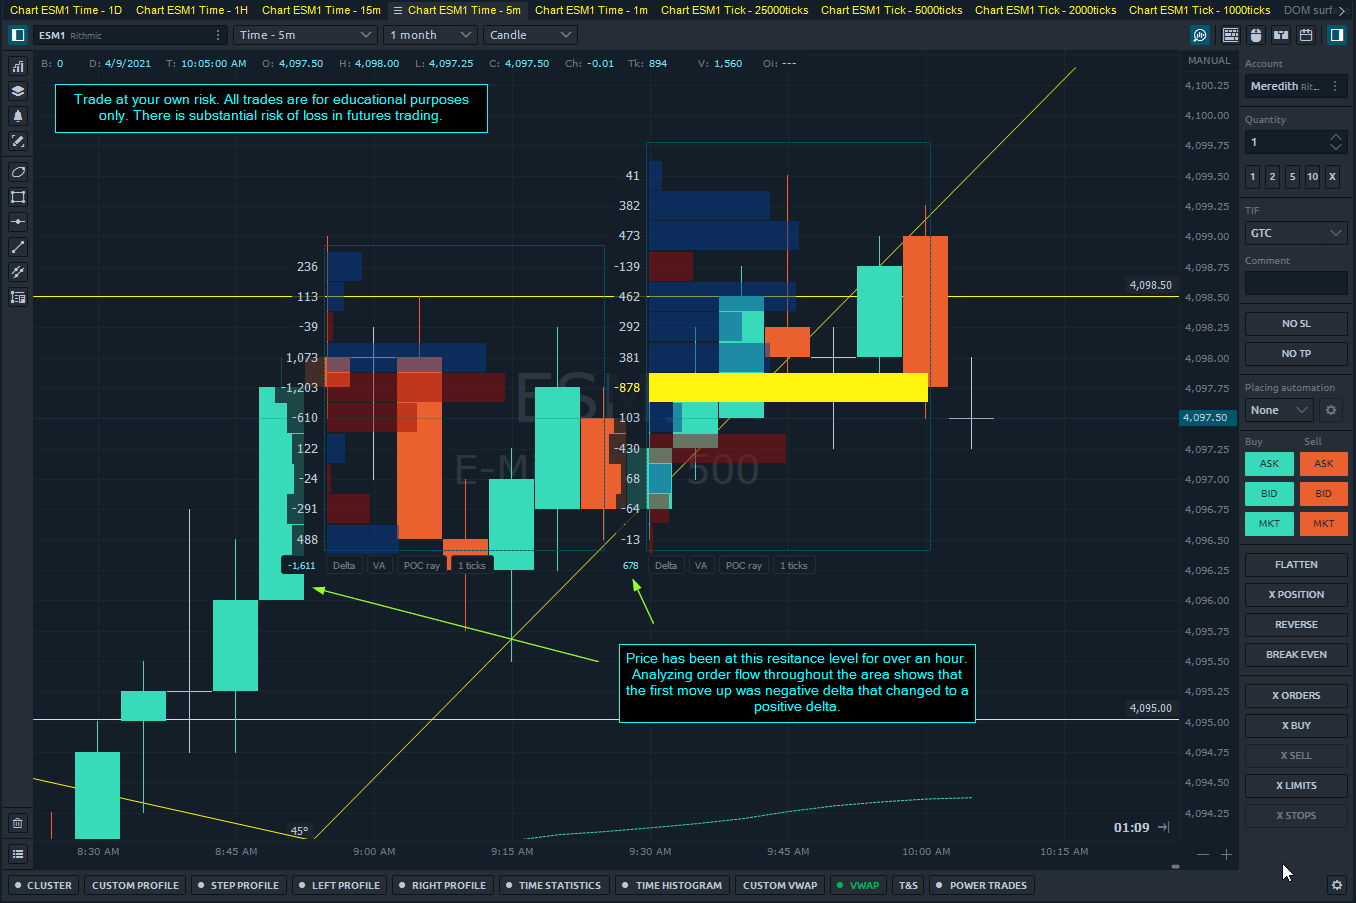
Double-top ES Mini Futures.
It looked like a double-top was forming near 4098.50 with the first high occurring at 4:15 AM Pacific, then price moved to that level again at 8:45 AM Pacific.
Looking at the custom profile we can break it up to see what order flow was doing. The first part of this area showed more negative delta as it came up. This follows the narrative this past week which is passive buyers continuing to move price up.
The second half of the area shows price staying near the level and making higher lows. This has a positive delta showing more active buyers participating.
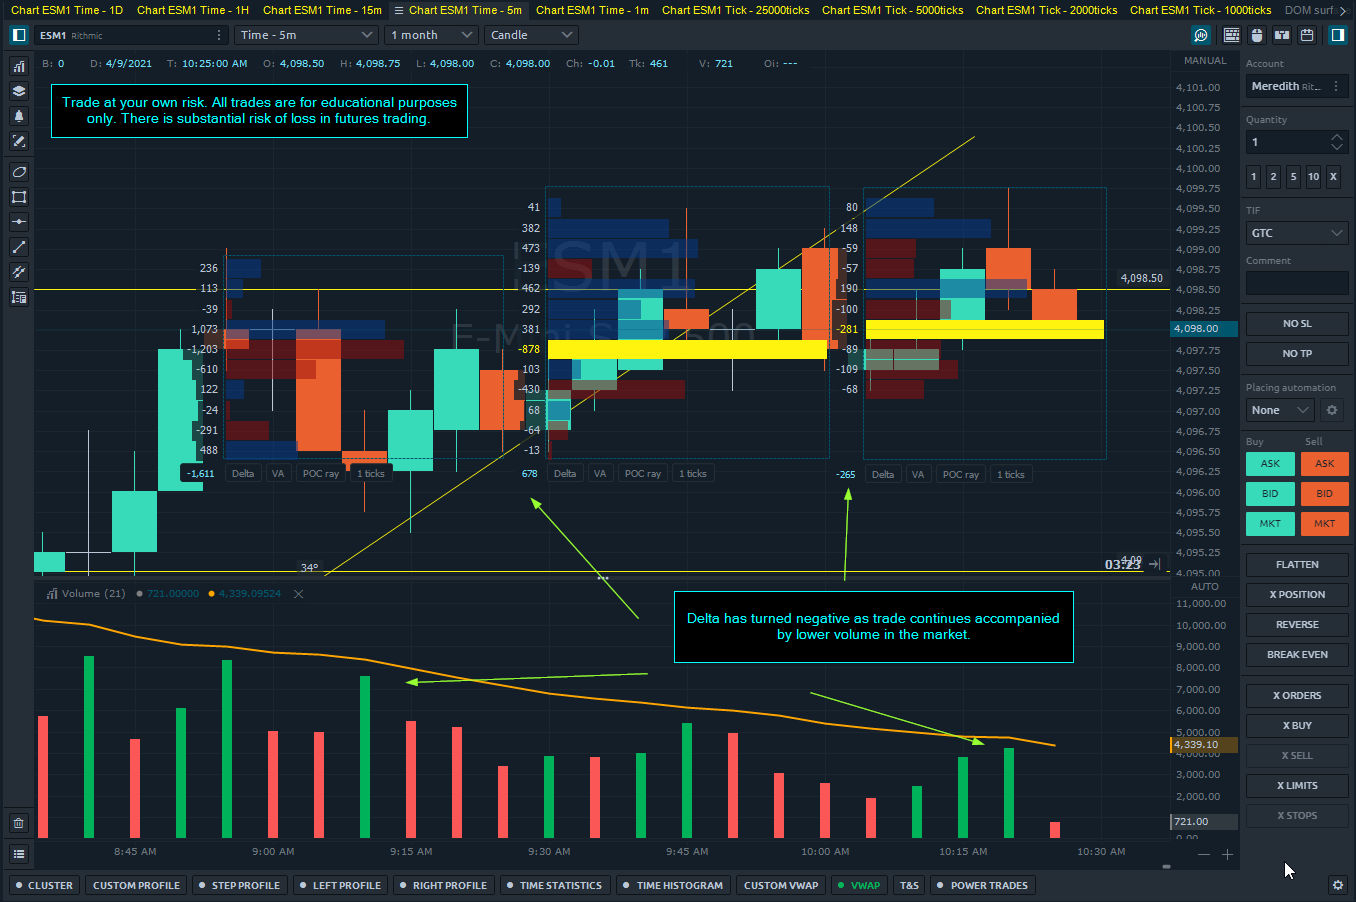
In addition, price has failed to move much due to decreasing volume through the mid-day trade.
A valid breakout will have to come with significant volume in a clear direction. Hard to say what way that will be, however, with the recent all time high at 4102.50, there may potentially be short positions with stops above that high.
If price moves up to that price or just past it, we could see a true breakout to the upside or even a false breakout then price come back down to support.
There is a substantial risk of loss in futures trading. Past performance is not indicative of future results. The figures here represent an opinion. The placement of contingent orders by you or broker, or trading advisor, such as a “stop-loss” or “stop-limit” order, will not necessarily limit your losses to the intended amounts, since market conditions may make it impossible to execute such orders. Please conduct your own due diligence if Futures are an appropriate instrument for you.
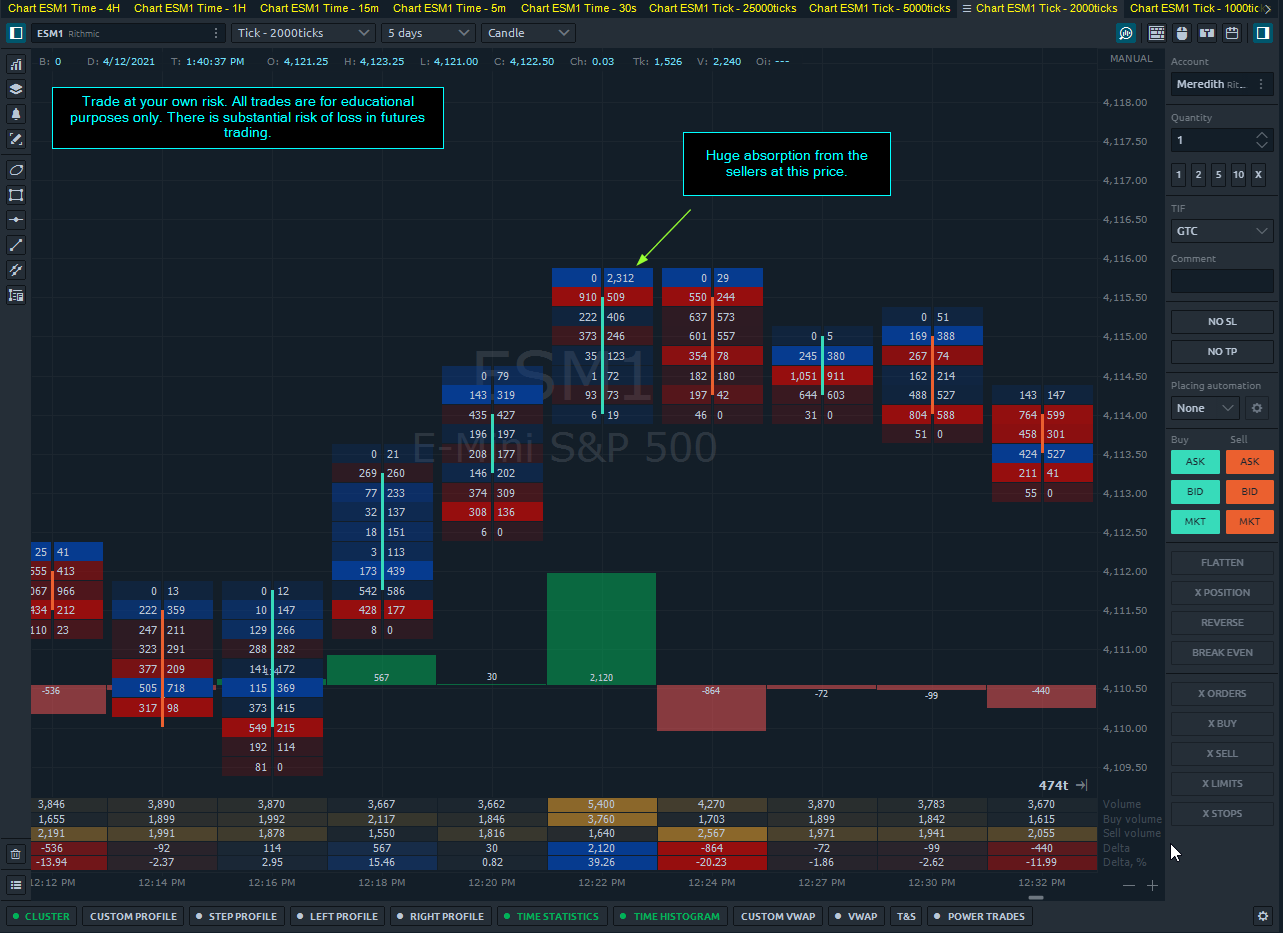
Absorption Reversal
Here is a great example of the absorption reversal we saw today.
Although price only reversed 2 points then continued it’s uptrend, these sellers were able to stop price from moving any further up.
This was not an order in the book, rather it was an iceberg order that just kept refilling when the contracts got low on the offer.
There is a substantial risk of loss in futures trading. Past performance is not indicative of future results. The figures here represent an opinion. The placement of contingent orders by you or broker, or trading advisor, such as a “stop-loss” or “stop-limit” order, will not necessarily limit your losses to the intended amounts, since market conditions may make it impossible to execute such orders. Please conduct your own due diligence if Futures are an appropriate instrument for you.
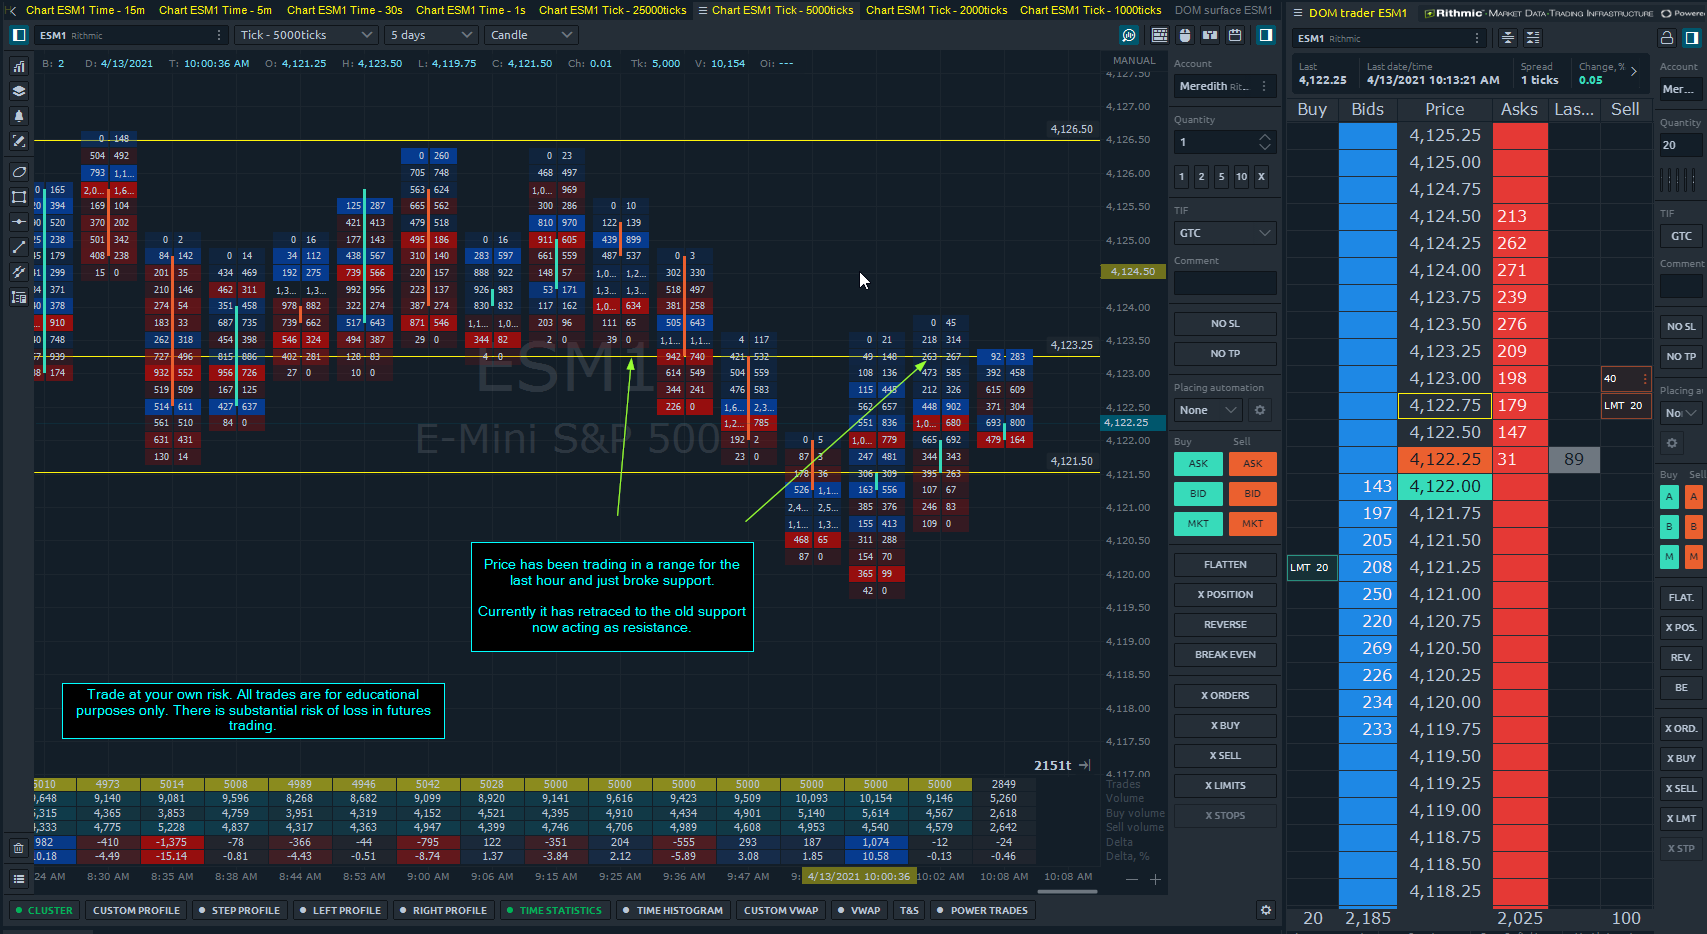
Support & Resistance.
When price follows a clear range with support and resistance, it’s important to monitor how buyers and sellers are interacting with the market at these levels.
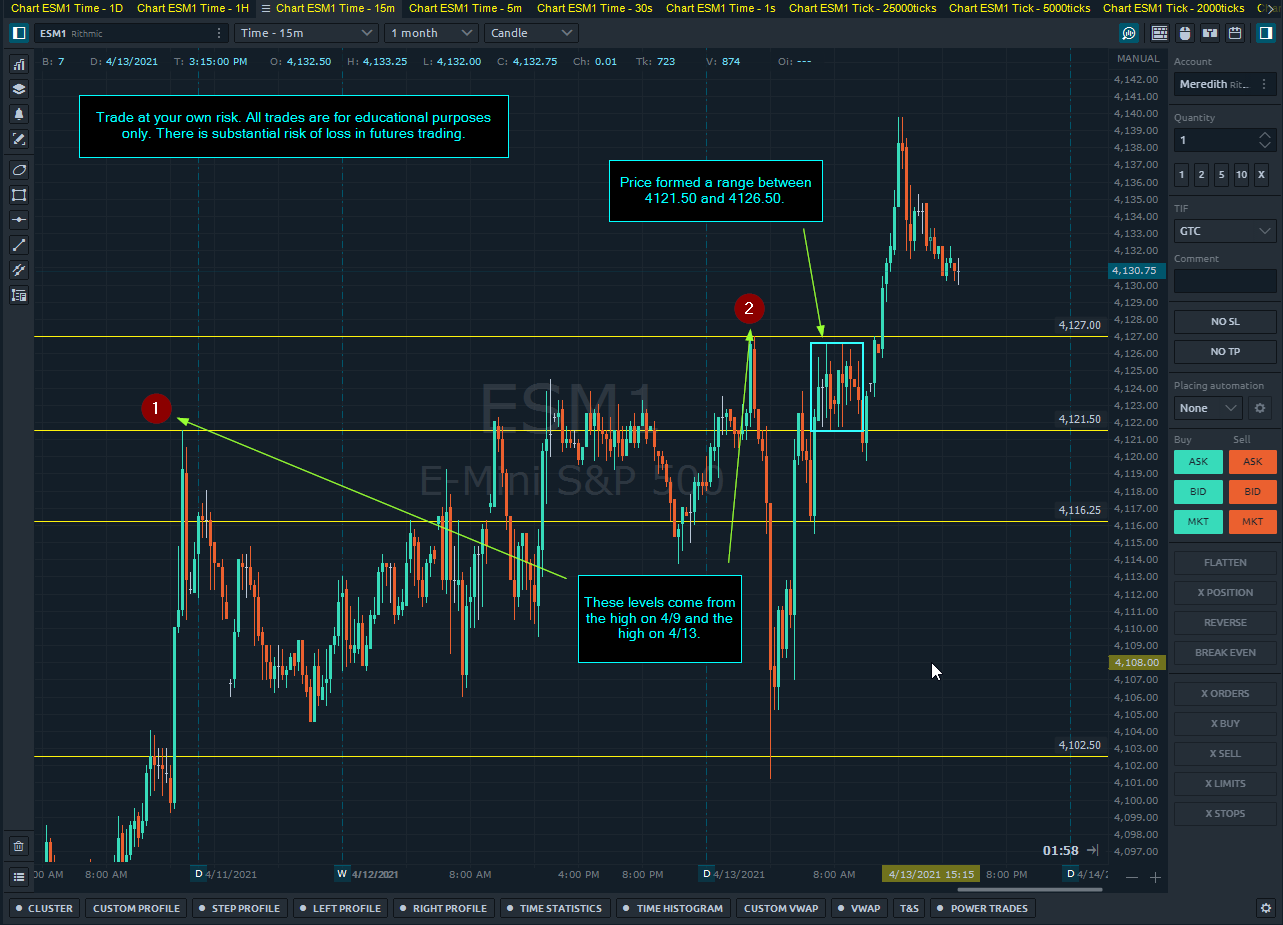
ES Mini Futures traded up to the highs then formed a range between 4121.50 and 4126.50.
Price briefly broke support and then came back into the range.
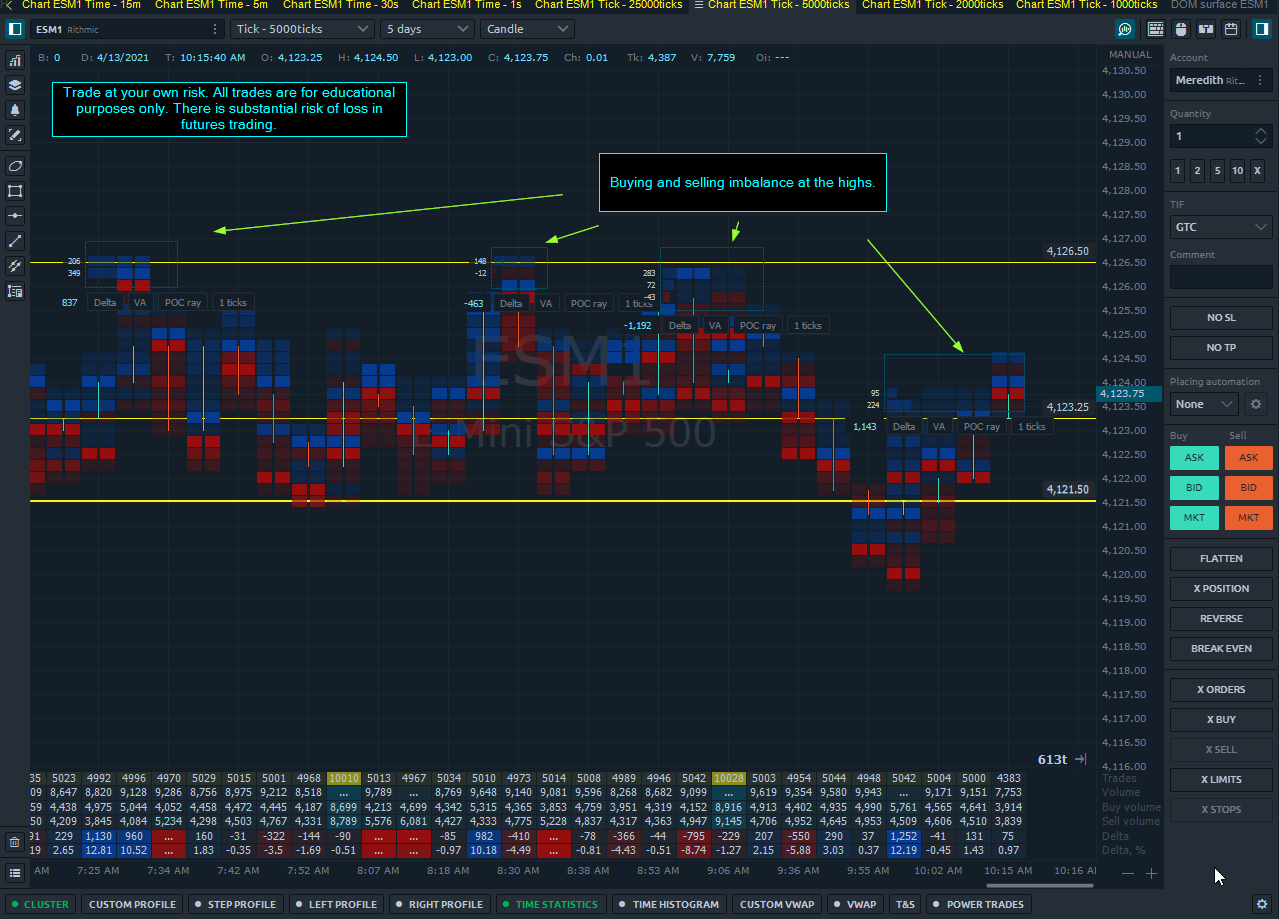
On our Custom Profile, we can see what the buyers and sellers are doing at the highs of the range and also this last move back into the range.
Most recently, there has been more buying than selling, which may potentially move price up toward the top of the range. However, overall the buyers have not proven they have the ability to move it past the highs yet.
There is a substantial risk of loss in futures trading. Past performance is not indicative of future results. The figures here represent an opinion. The placement of contingent orders by you or broker, or trading advisor, such as a “stop-loss” or “stop-limit” order, will not necessarily limit your losses to the intended amounts, since market conditions may make it impossible to execute such orders. Please conduct your own due diligence if Futures are an appropriate instrument for you.
ES Mini Futures Trading in a Range
all times pacific
Today we saw the market develop a nice range from 6:57 am to 10:37 am between the levels of 4121.50 and 4126.50.
These prices have been important levels in recent trade, coming from the high on 4/9 and the high on 4/13.
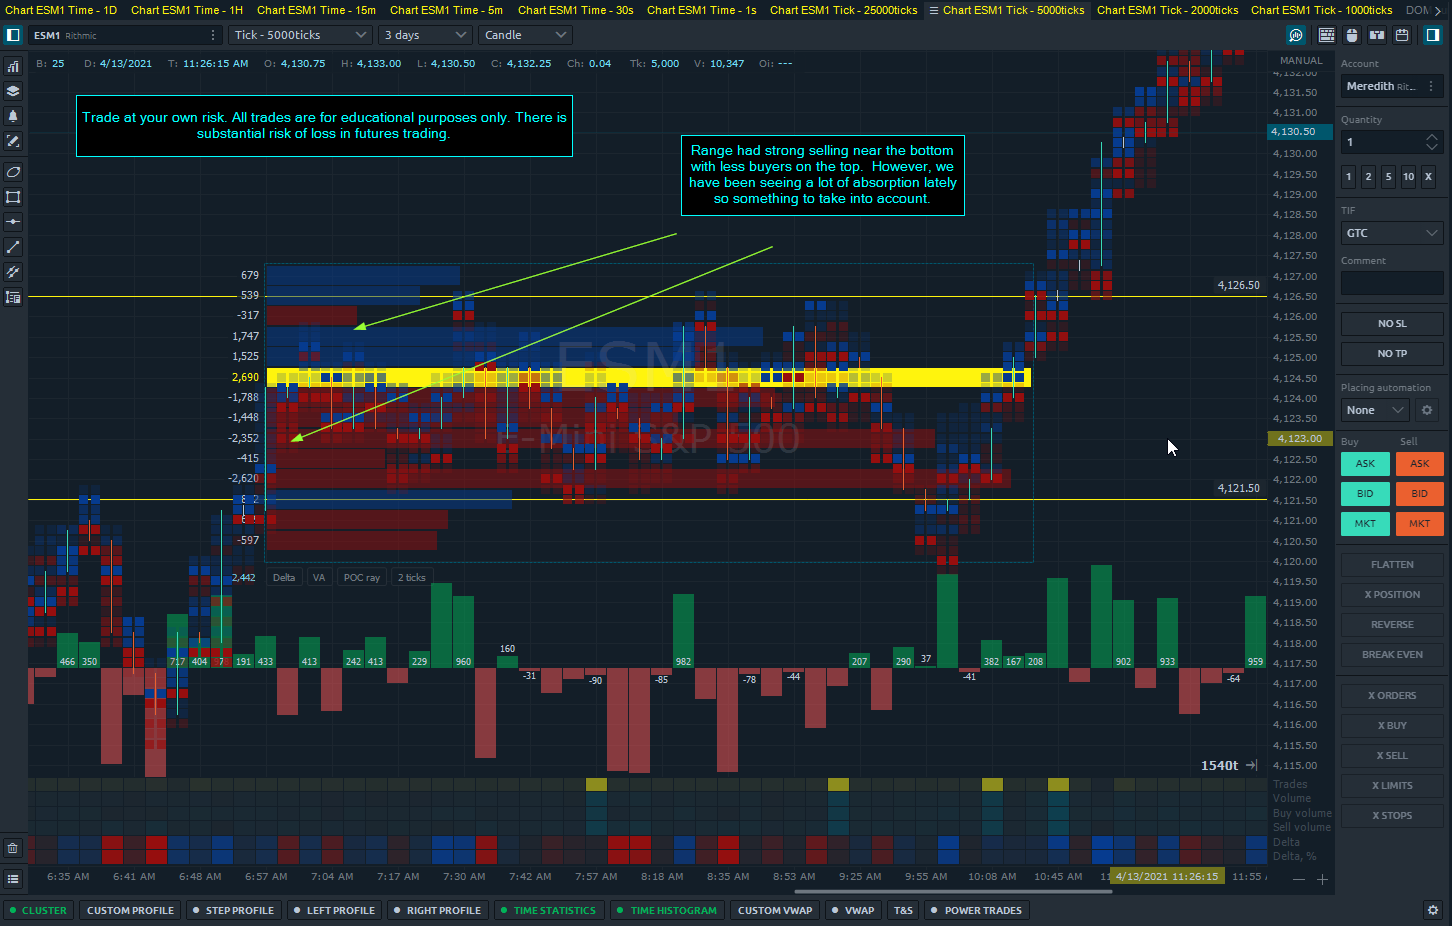
Here’s a zoomed-in Footprint chart of that range in the rectangle above.
Delta was generally evenly distributed through the range with slightly more selling on the lows than buying at the highs.
Delta only shows the overall imbalance of the market between buyers and sellers and provides a good macro view of behavior.
We can assume that throughout this range traders will be getting short and long, and with clearly defined edges of the range we can hypothesize where stops may be placed above and below.
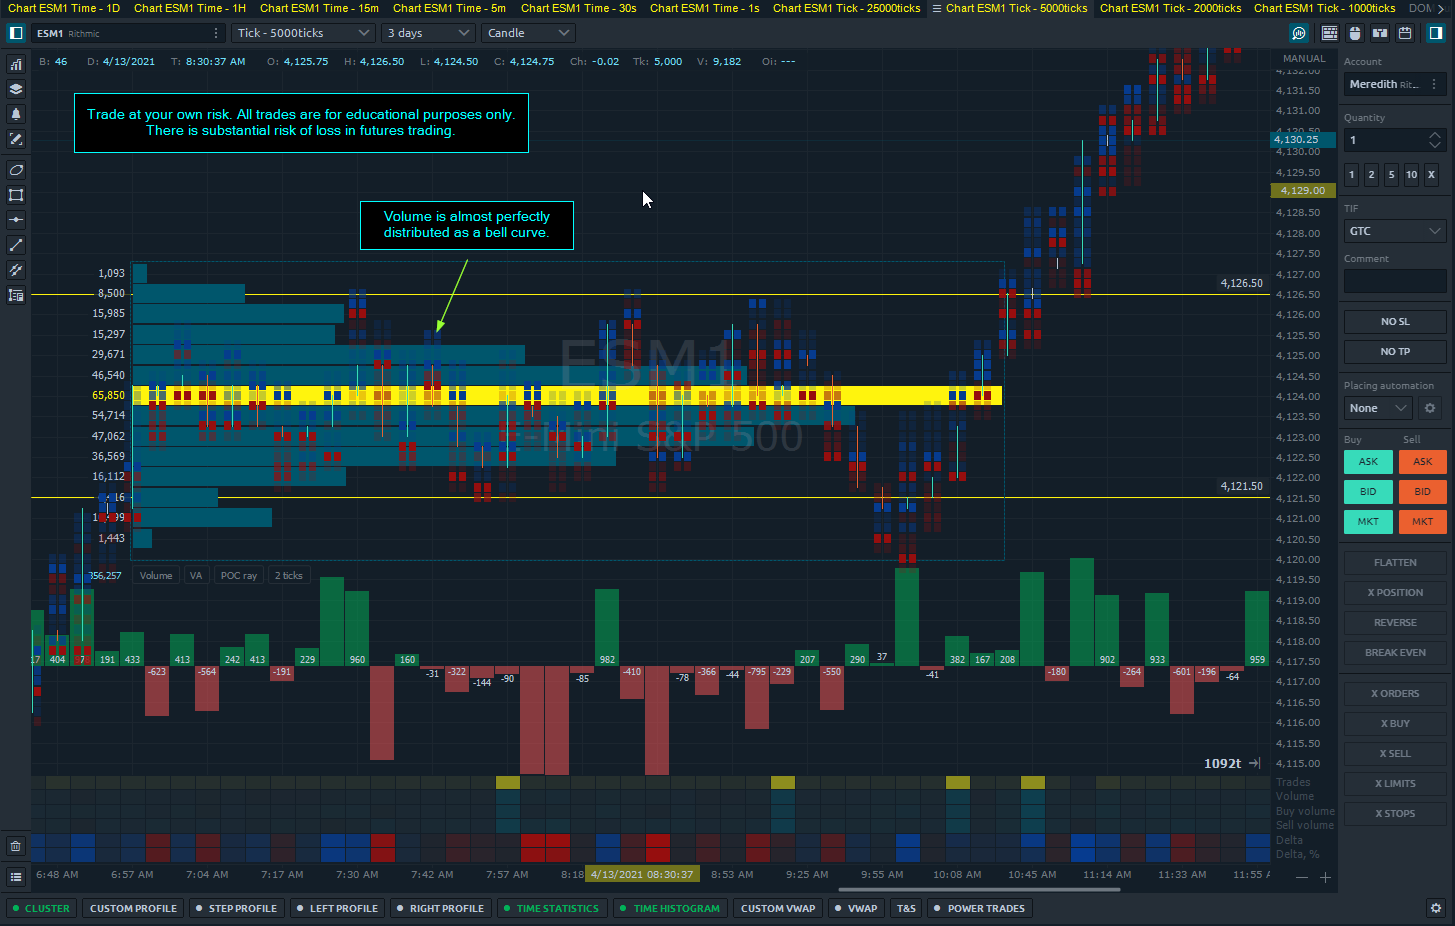
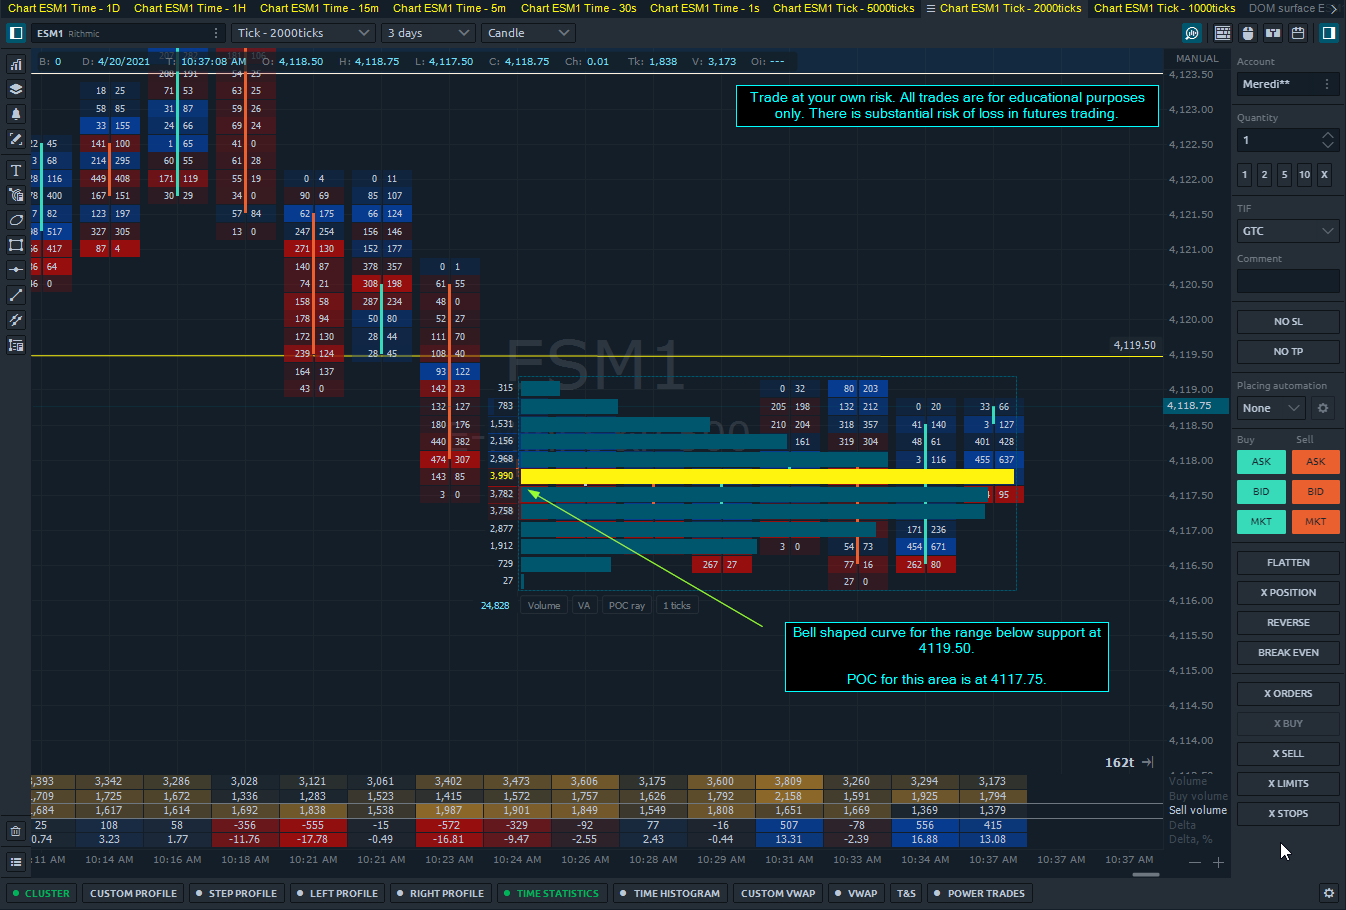
Another thing to note with this range is that the majority of the volume traded almost perfectly in the middle with an evenly distributed bell curve:
At 9:55 am price broke below the bottom of the range for about 7 minutes.
Let’s take a closer look at the breakout area to the sell-side:
Using a Custom Profile, we can see that there was a lot of aggressive buying at 4121.25. There was some selling below the range but not much, and clearly the buyers overpowered that move.
So what’s the strategy here and how do we apply order flow to our trading?
The market was in a clear range with a well-defined low and high formed by the previous day’s highs.
That’s where we can forget to check in with ourselves and the market to properly identify what’s going on.
As soon as it broke the bottom of the range, we should have been on high alert and watching order flow for any continuation. Depending on your position or outlook, you may have sold with expectations that sellers would follow through.
A long position before the false break may not have hit a sell stop. The only time to buy on a break below would be if price shows it’s willing to come back into the range with solid buying, which we can see happened.
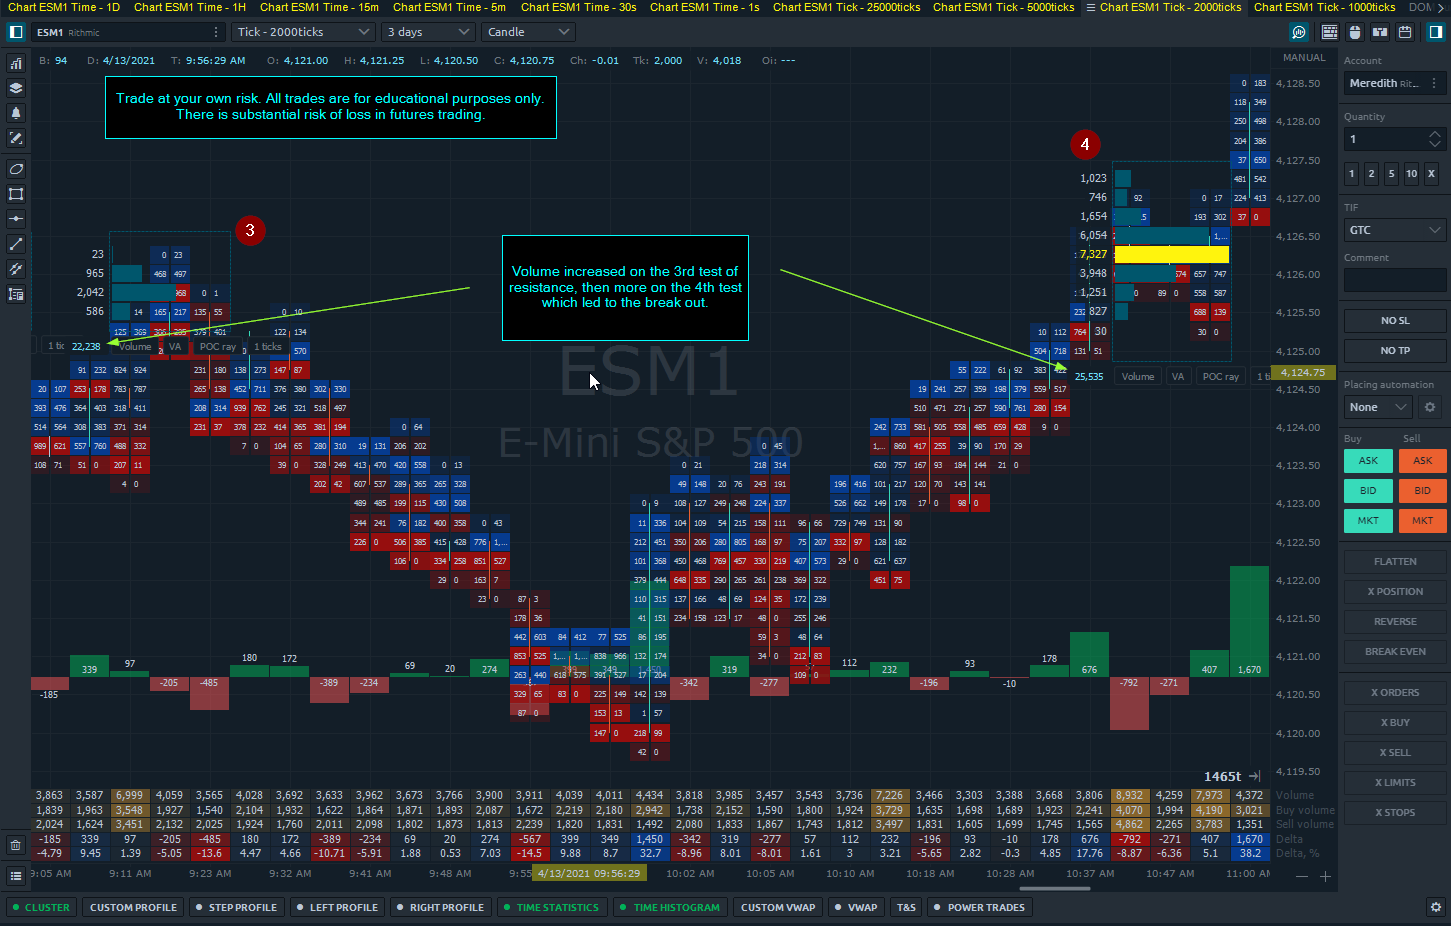
Looking at the volume during the time price reached the high of the range, we can see that this move had increased volume with it.
Here we can see that with each occurrence of price at the high of the range, volume increased. This ic what was able to finally fuel a rally.
On the bottom of the range, if we analyze volume there, we can see that it had much less volume even below the range.
This is another clue that there wasn’t enough interest to get price going down.
Here’s the key part. Once a breakout has occurred and the direction of the market has been identified, it’s important to be trading with move. Step back and look at the bigger picture to find the best moves.
There is a substantial risk of loss in futures trading. Past performance is not indicative of future results. The figures here represent an opinion. The placement of contingent orders by you or broker, or trading advisor, such as a “stop-loss” or “stop-limit” order, will not necessarily limit your losses to the intended amounts, since market conditions may make it impossible to execute such orders. Please conduct your own due diligence if Futures are an appropriate instrument for you.
Increasing Volume at Edge of Range.
We saw this pattern yesterday in the ES Mini Futures, where price is trading in a range then increased volume comes in a key levels.
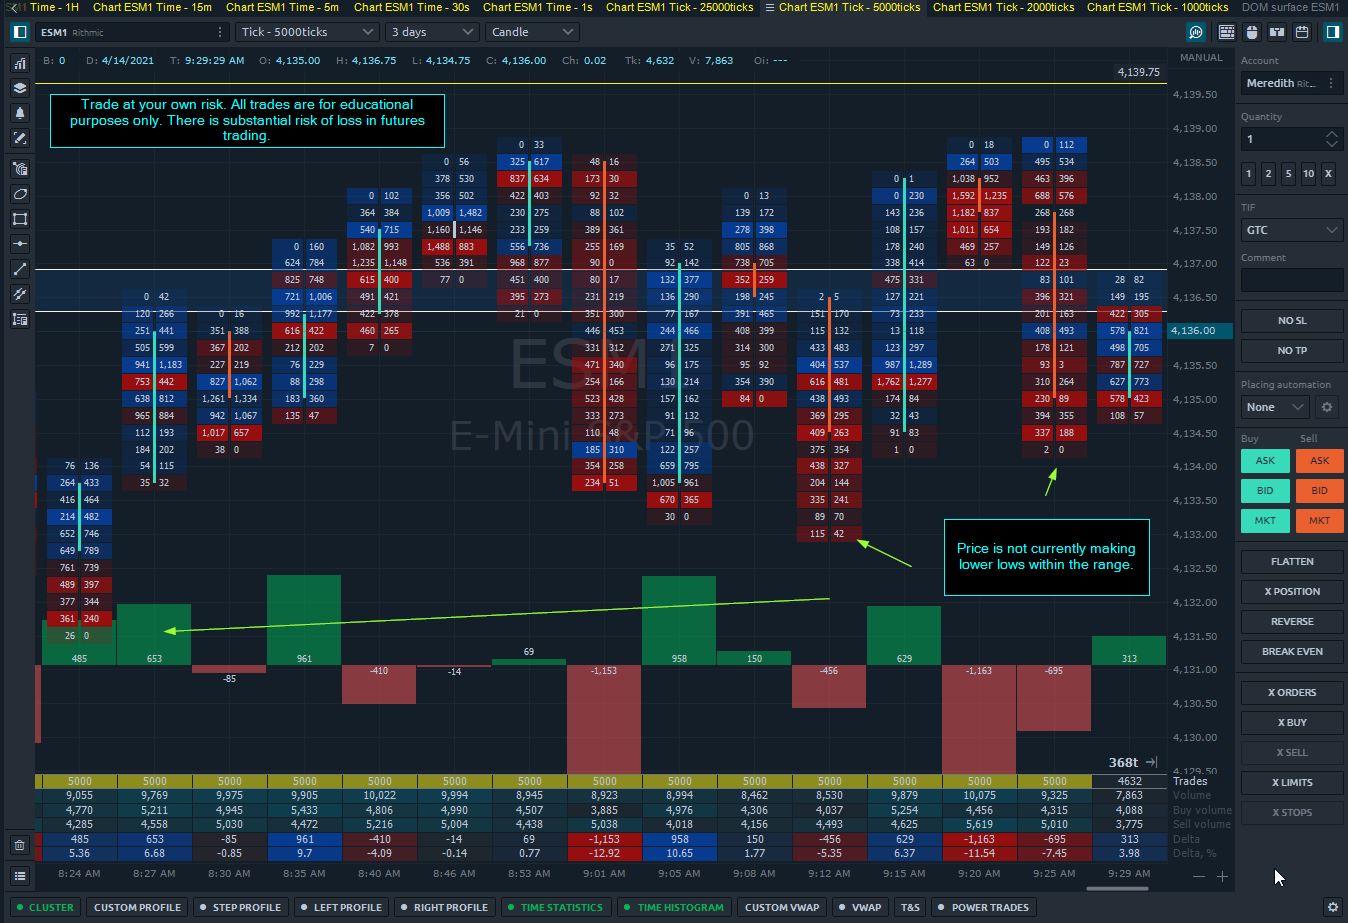
Today, 4/14/21, we have been trading in a range between 4130.00 and 4139.75 with price breaking above that area briefly.
Here is a closer look at the most recent move near the top of the range:
During these areas of increasing volume, there is more tension created which has the potential to move price faster when the losing side is forced out of their position.
This particular area showed significant selling into the bid and as soon as price went below that area, buyers were forced to puke which drove price to 4134.50.
While we are still in a range, price is failing to make lower lows despite the strong selling into the bid. A major move most likely will not occur until price breaks above the 4139.75 area or below the 4133.00 support level.
There is a substantial risk of loss in futures trading. Past performance is not indicative of future results. The figures here represent an opinion. The placement of contingent orders by you or broker, or trading advisor, such as a “stop-loss” or “stop-limit” order, will not necessarily limit your losses to the intended amounts, since market conditions may make it impossible to execute such orders. Please conduct your own due diligence if Futures are an appropriate instrument for you.
Measure volume at the edges of a range to see when a breakout may occur.
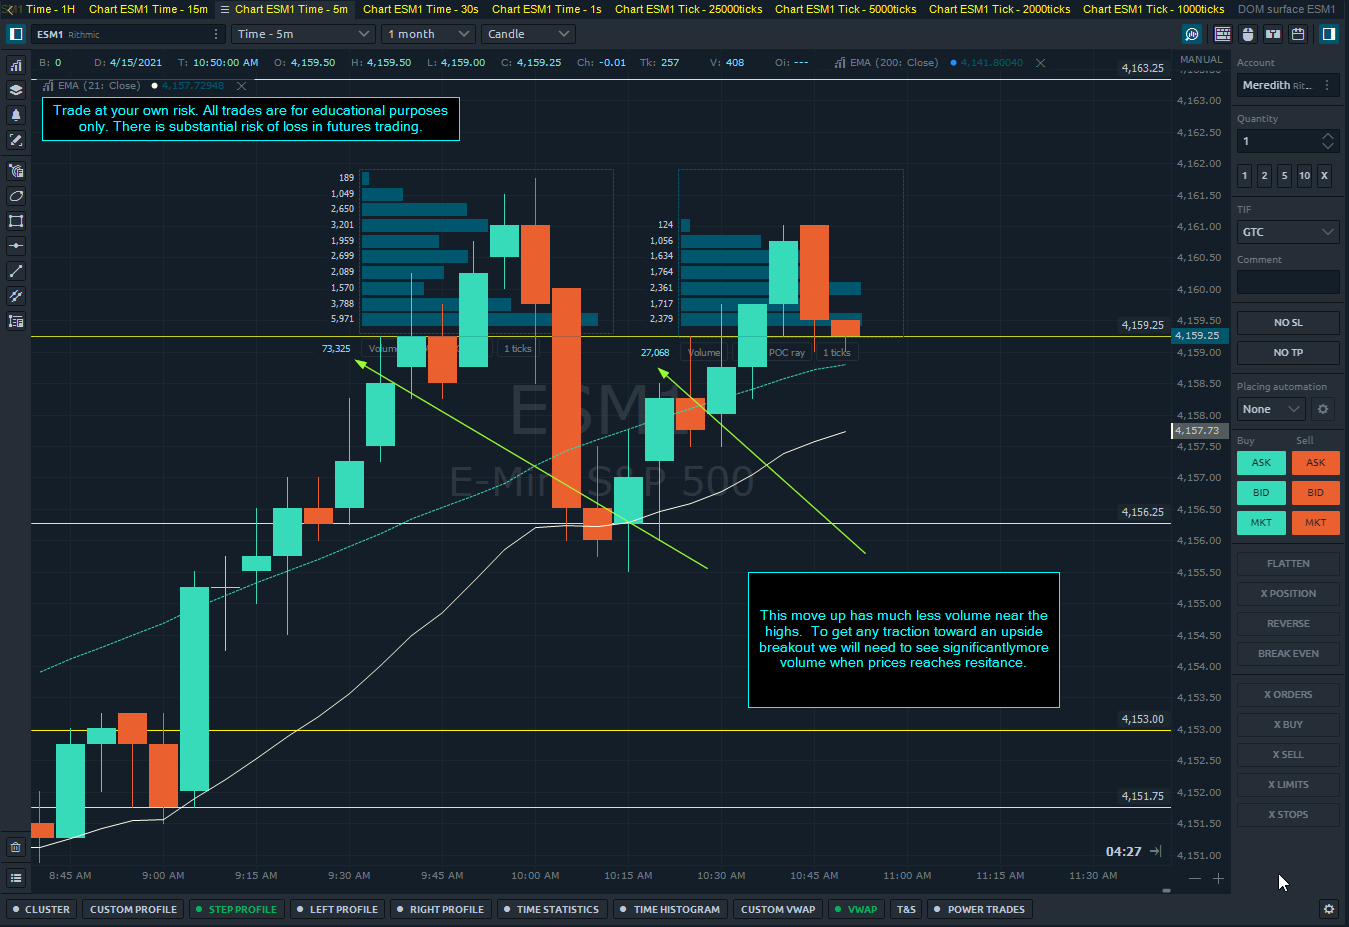
Today the ES Mini Futures have hit new highs and it is trading in a range now with a double-top formed at 4161.00.
In order for price to breakout to the upside we will need to see more volume when price approaches resistance.
As of now, the trading plan will be to monitor and trade the edges of the range and move with the ebb and flow of price.
On the Footprint chart it shows more clearly that price is following a few levels in this range. On this last bar we are seeing less selling near 4158.00 with price making higher lows as the day continues.
There is a substantial risk of loss in futures trading. Past performance is not indicative of future results. The figures here represent an opinion. The placement of contingent orders by you or broker, or trading advisor, such as a “stop-loss” or “stop-limit” order, will not necessarily limit your losses to the intended amounts, since market conditions may make it impossible to execute such orders. Please conduct your own due diligence if Futures are an appropriate instrument for you.
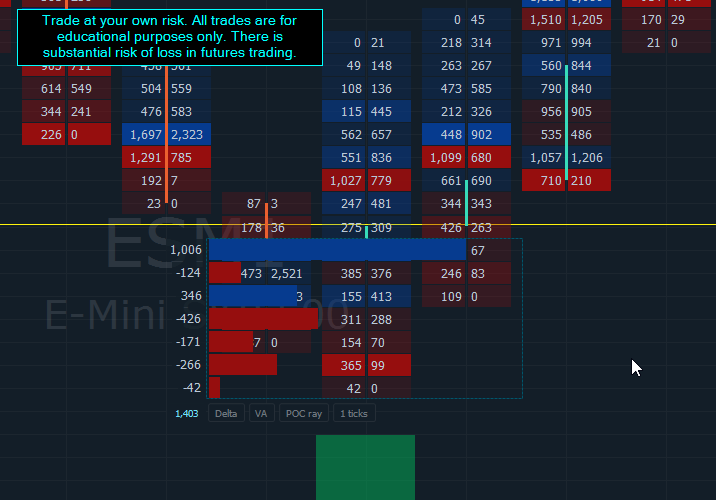
Imbalance goes from selling to buying which resulted in a move up.
On the Footprint here is the moment that the sentiment changed from selling to buying at support.
Capitalizing on this change allowed new buyers to come in and push price up for a small move.
The position in the picture was exited about 6-7 ticks above entry.
There is a substantial risk of loss in futures trading. Past performance is not indicative of future results. The figures here represent an opinion. The placement of contingent orders by you or broker, or trading advisor, such as a “stop-loss” or “stop-limit” order, will not necessarily limit your losses to the intended amounts, since market conditions may make it impossible to execute such orders. Please conduct your own due diligence if Futures are an appropriate instrument for you.
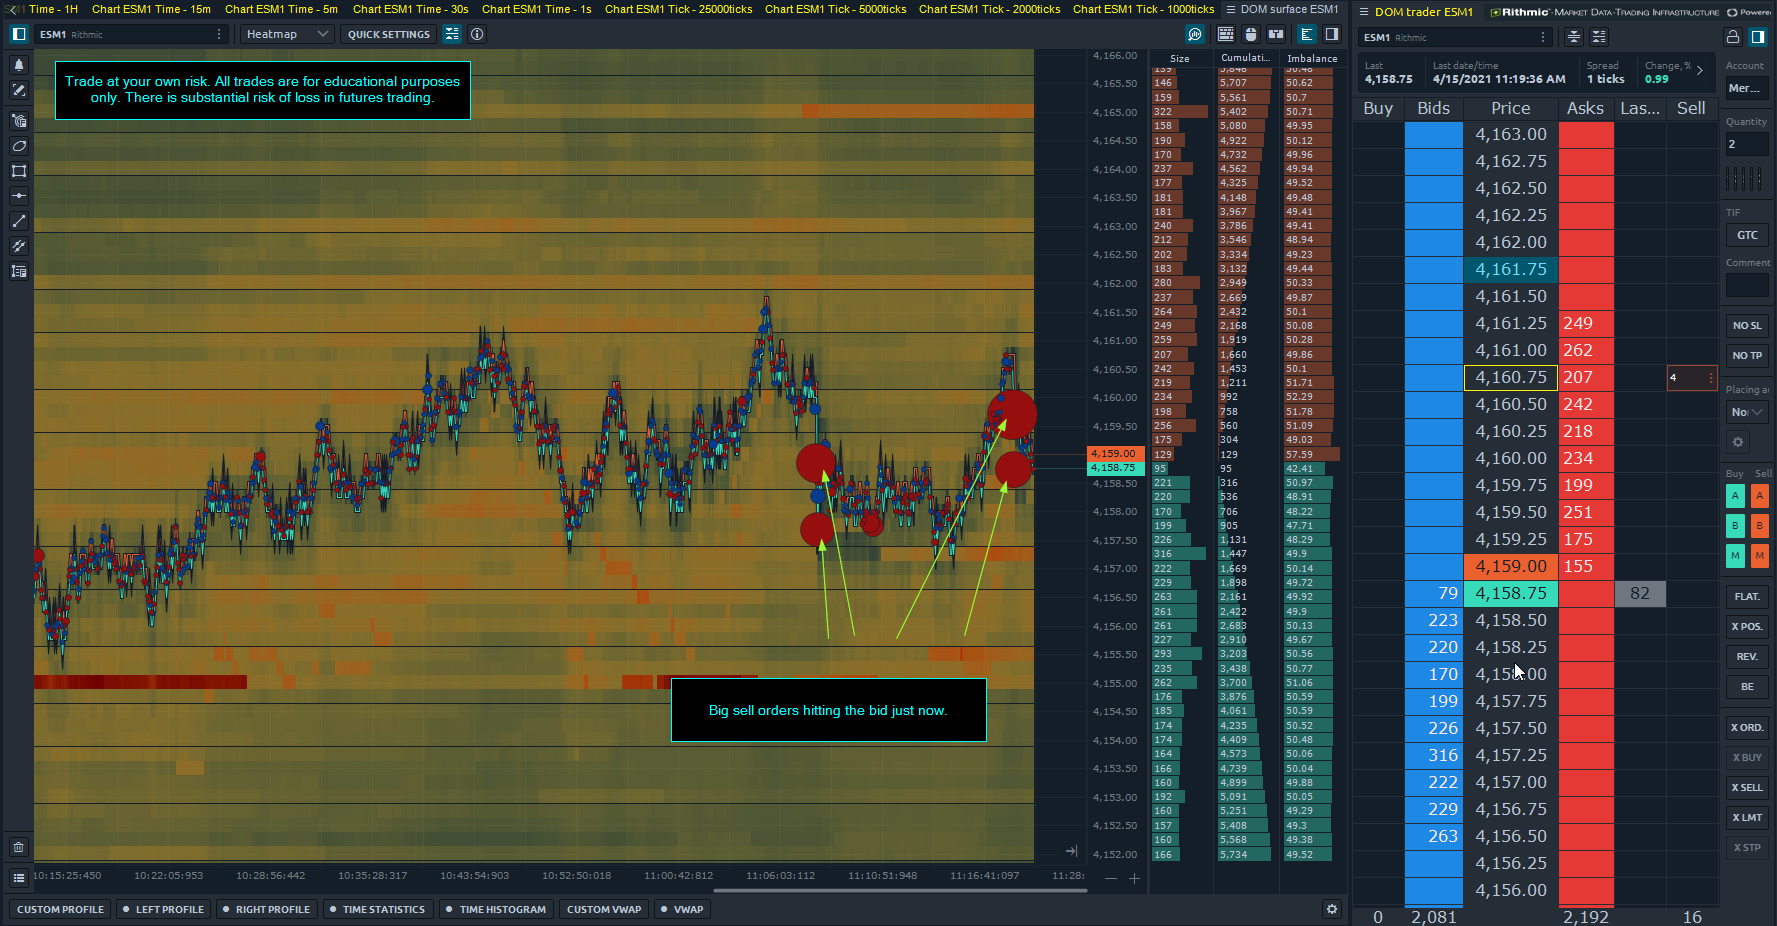
Sell orders hitting the bid.
Price continues to test the highs but recently we are seeing large sell orders hitting the bid.
To see these, switch to DOM surface in Optimus Flow and change settings accordingly.
There is a substantial risk of loss in futures trading. Past performance is not indicative of future results. The figures here represent an opinion. The placement of contingent orders by you or broker, or trading advisor, such as a “stop-loss” or “stop-limit” order, will not necessarily limit your losses to the intended amounts, since market conditions may make it impossible to execute such orders. Please conduct your own due diligence if Futures are an appropriate instrument for you.
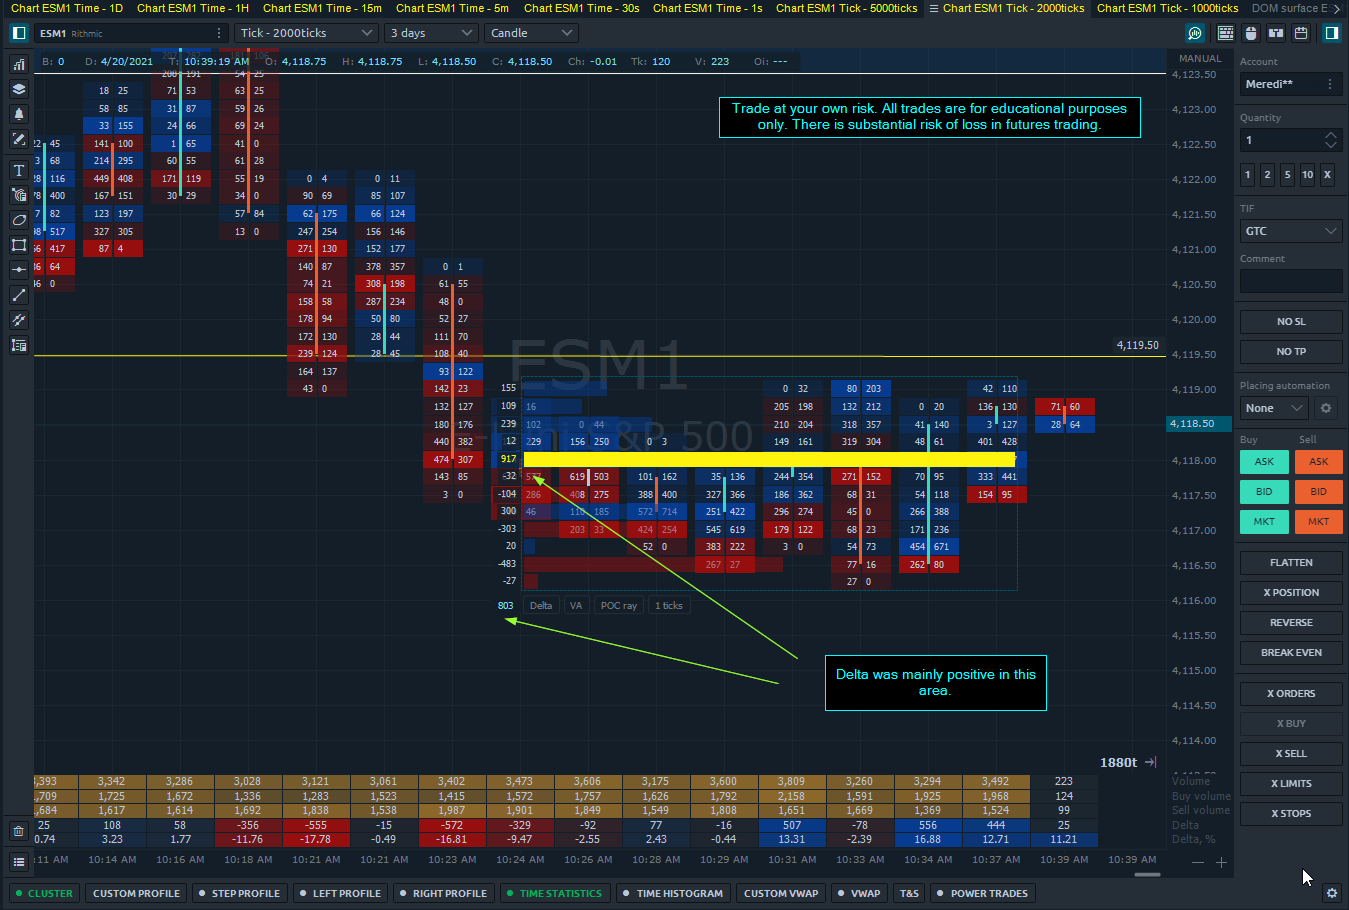
How to watch order flow in a range to develop trades.
Price came below support at 4119.50 and formed a quick range. There is support at 4116.25 and as the range formed, we could see that sellers were unable to push price lower.
When support or resistance is formed, we are looking to find the highest probability trades there are for that time frame.
If the market is going to continue to stay range-bound, then we don’t want to see high volume come in at the edges with decisive buying or selling that may take it out of the range.
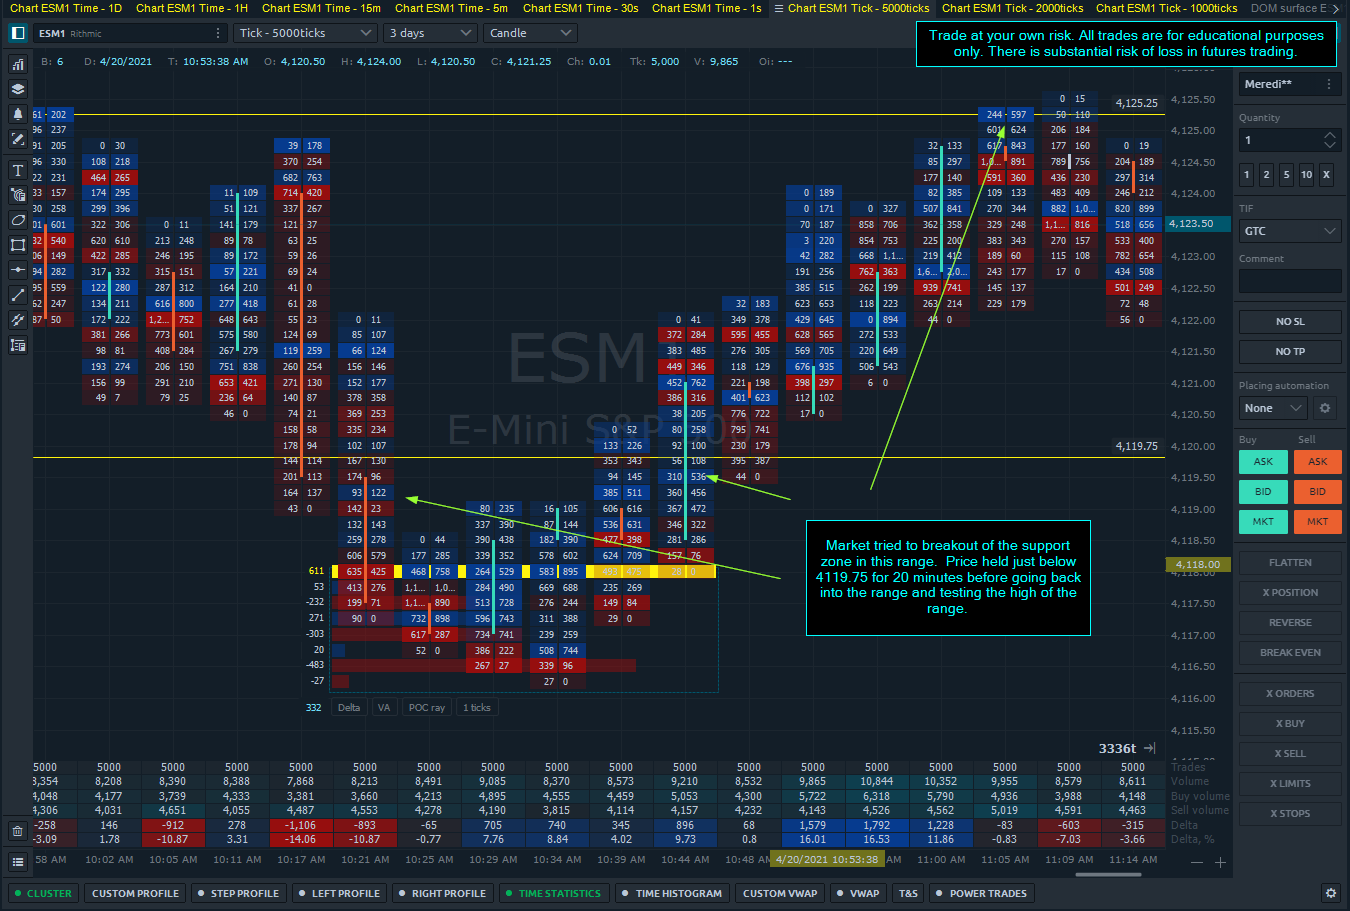
However, when it does break out of a range and there is no continuation, price may potentially creep back into the range testing the opposite boundary.
As we can see here, price came below the support line but didn’t have any continuation. Traders who got short had to cover which drove the price back to the high of the range.
There is a substantial risk of loss in futures trading. Past performance is not indicative of future results. The figures here represent an opinion. The placement of contingent orders by you or broker, or trading advisor, such as a “stop-loss” or “stop-limit” order, will not necessarily limit your losses to the intended amounts, since market conditions may make it impossible to execute such orders. Please conduct your own due diligence if Futures are an appropriate instrument for you.
How to identify setups with order flow.
Here’s a small consolidation area after a 4-5 point move up from the recent range.
We can see here that price is trading in an 8 tick range. As the bars have developed, we are seeing more sellers hit the bid than buyers lifting the offer.
This tells us that:
How do you trade this?
Yes, it entirely depends on your style of trading, but if we were going to make a trade how do we limit our risk and maximize reward?
If a range is going to hold up, the obvious it to buy and sell the edges of the range knowing your price targets and keeping expectations in check.
Also be aware of the potential for a breakout in either direction when there is clear evidence that buyers or sellers are stepping in more than they have recently at the edges.
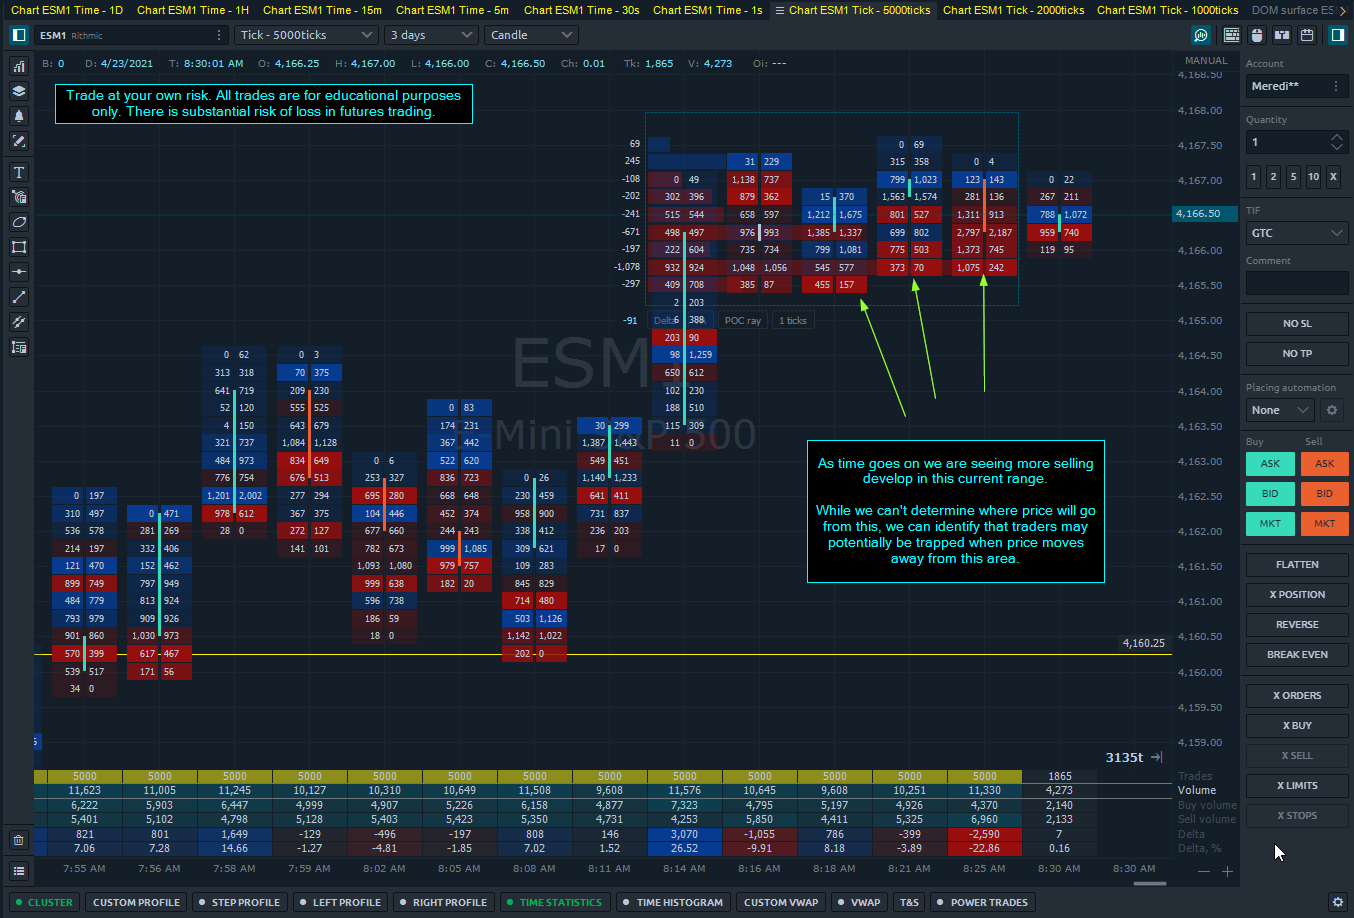
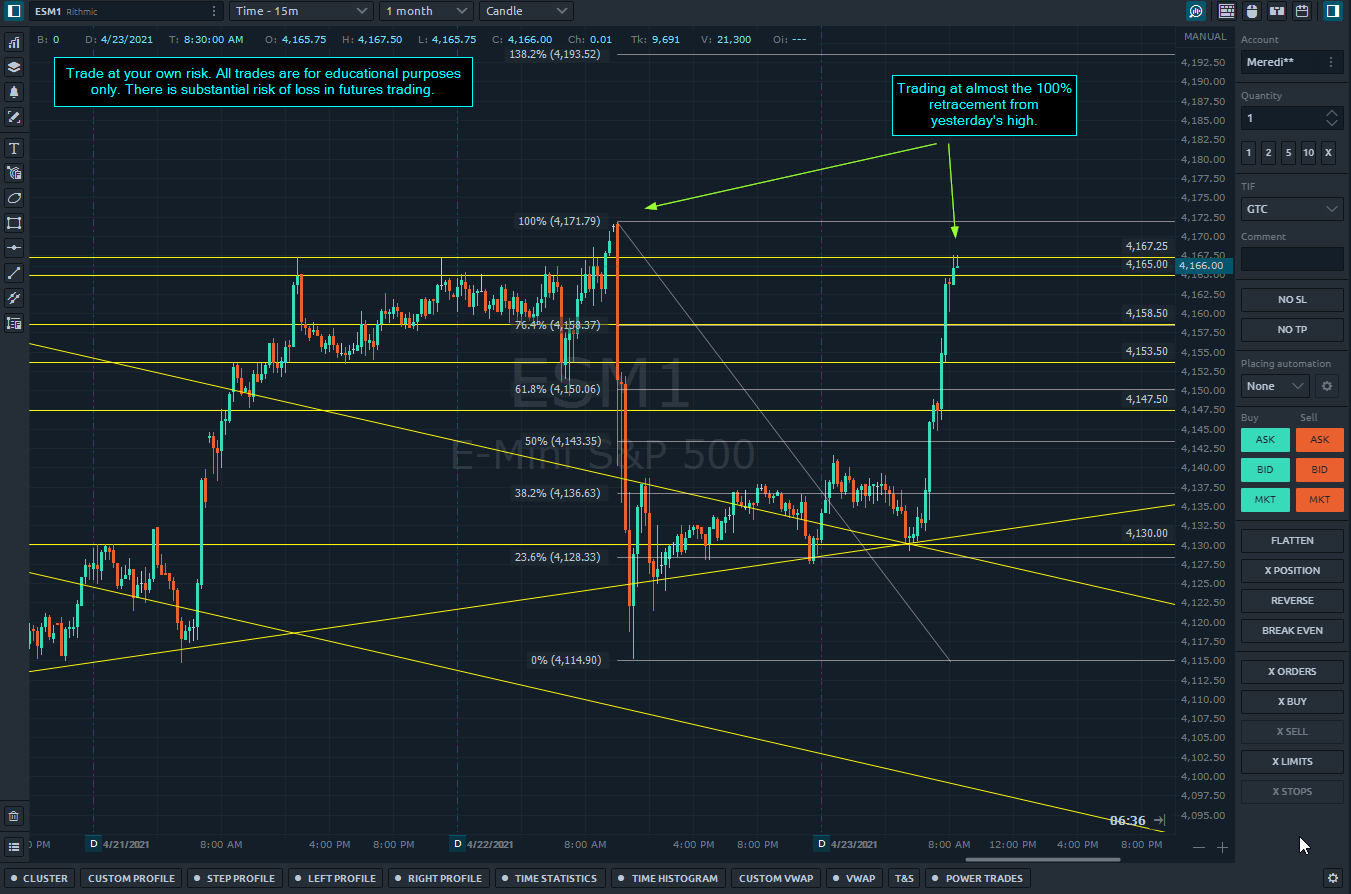
Here’s the situation now:
We are trading at almost the 100% retracement from yesterday’s high right before the sell-off.
There may potentially be stops above the previous high and also above the range from 4/16 at 4173.00 area.
If your trading style is to be long here, we will want to identify areas of support to help backup a long position. Whereas short traders will be selling the high part of the range with hopes sellers will come in and buyers will start taking profits or stopping out.
Either way, the key is to find areas like this where any price movement above or below the range where people may have taken positions will cause significant price movement as people get stopped out or pile on the move.
There is a substantial risk of loss in futures trading. Past performance is not indicative of future results. The figures here represent an opinion. The placement of contingent orders by you or broker, or trading advisor, such as a “stop-loss” or “stop-limit” order, will not necessarily limit your losses to the intended amounts, since market conditions may make it impossible to execute such orders. Please conduct your own due diligence if Futures are an appropriate instrument for you.
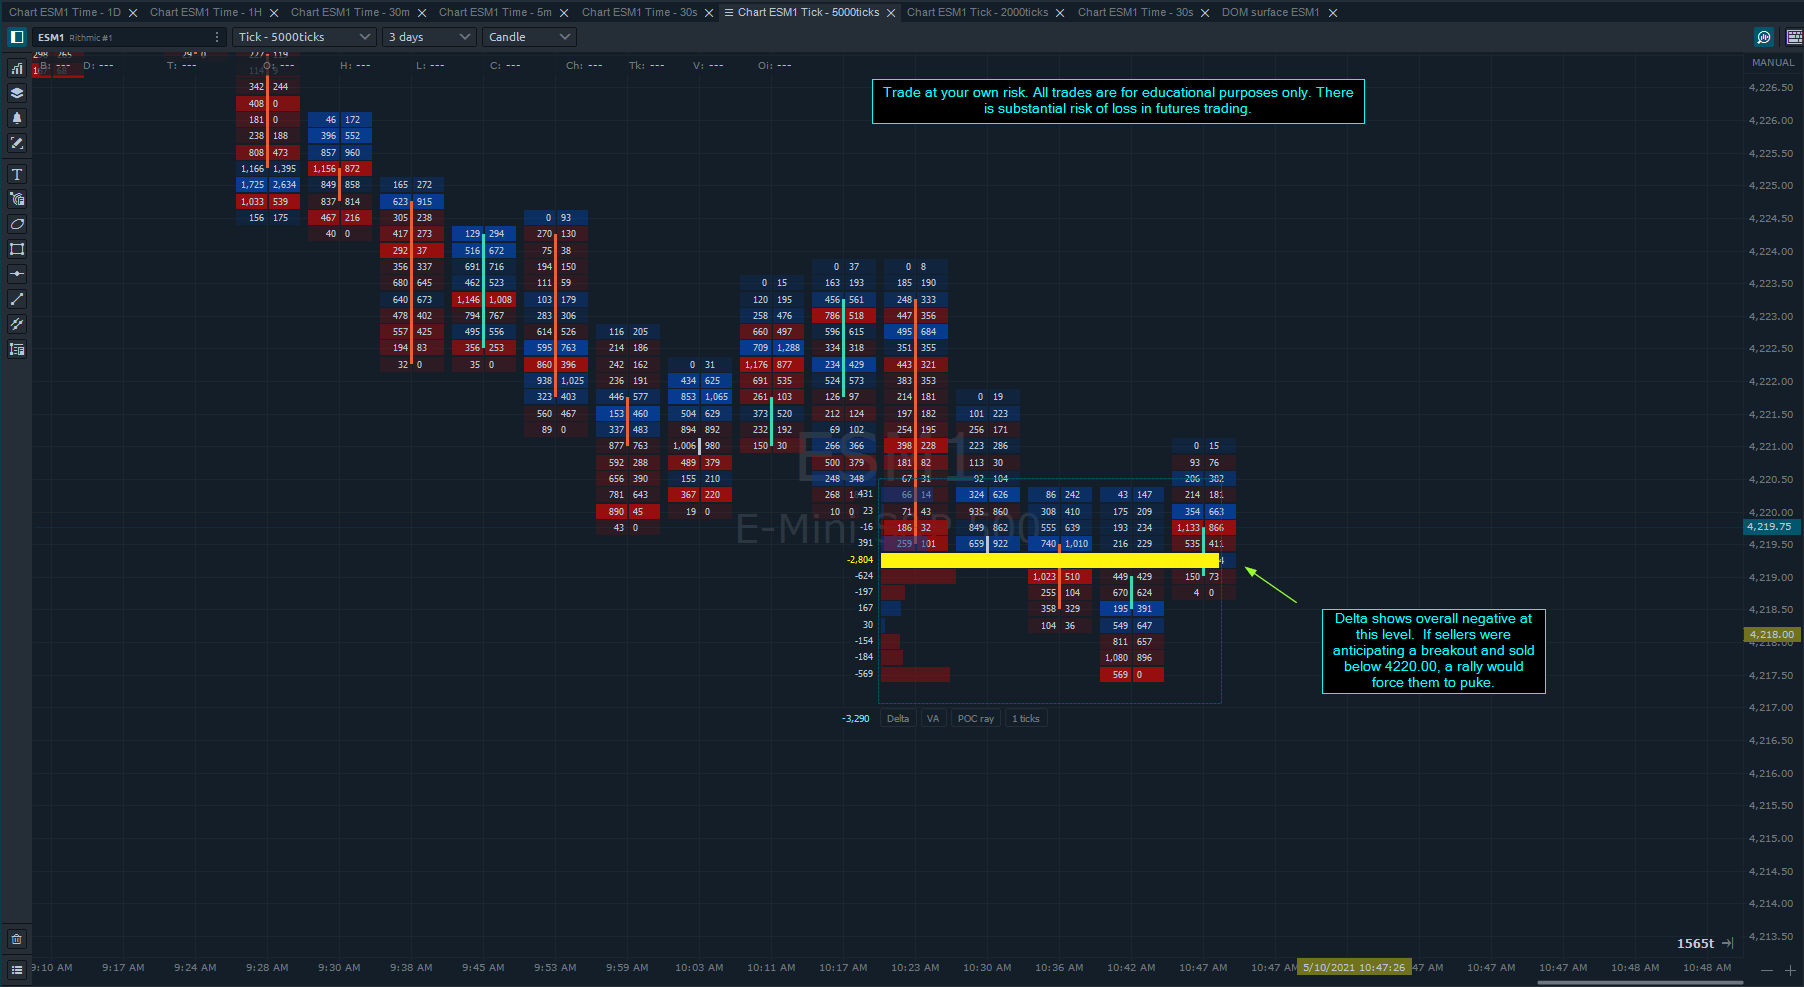
Fakeout leading to buyers puking.
It’s hard to determine when a level will break or when participants will puke their positions. It’s a lot of, “if this then that” scenario. With any order flow data, it’s still very important to take into consideration the most likely situation.
In this case, there was a pattern forming that appeared to be a fake breakout to the downside. Sellers gained momentum below support, yet price held just below support without continuation.
Price started to travel back above support, potentially forcing sellers to buy. The moment buyers started to lift offers, sellers came in and the bids backed off, driving price down.
Here it is on a 30 second chart:
As we all know, there’s no way to tell. I didn’t trade this, but I did think it was a short-trap and it would go back into the range and rally. The market felt strong and it seemed that buyers were dominating early trade.
Once the buyers couldn’t push it back into the range, I should have shifted gears and gone to the short side. I also forgot that I spotted this at the open:
It very well could have gone up from here, but if I was quick to react I could have seen the short potential.
Not only would we have new traders entering the market on the pattern, but there would also have been existing long traders needing to puke their positions. This ignited the sell-off today.
There is a substantial risk of loss in futures trading. Past performance is not indicative of future results. The figures here represent an opinion. The placement of contingent orders by you or broker, or trading advisor, such as a “stop-loss” or “stop-limit” order, will not necessarily limit your losses to the intended amounts, since market conditions may make it impossible to execute such orders. Please conduct your own due diligence if Futures are an appropriate instrument for you.
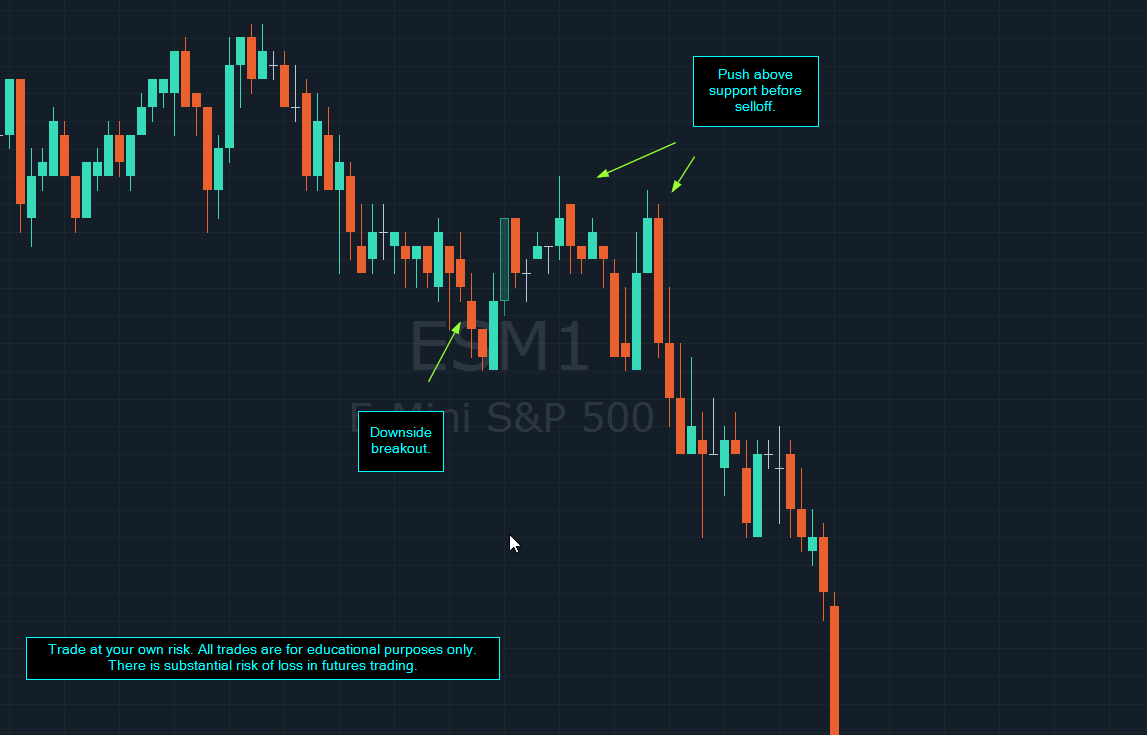
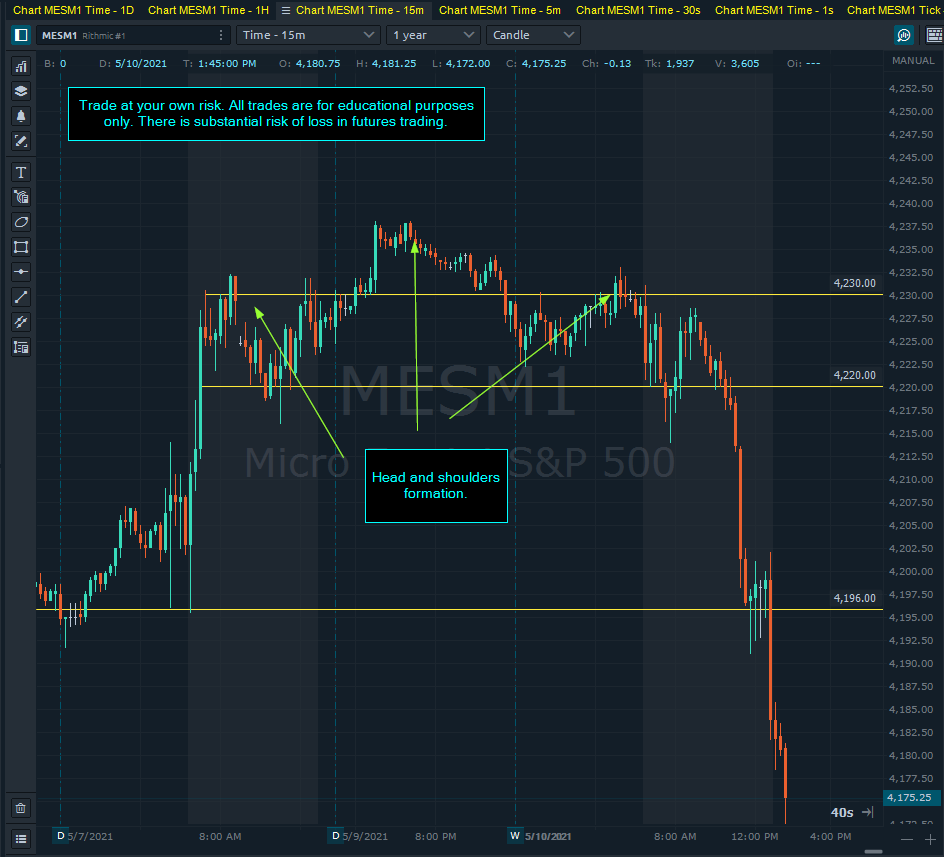
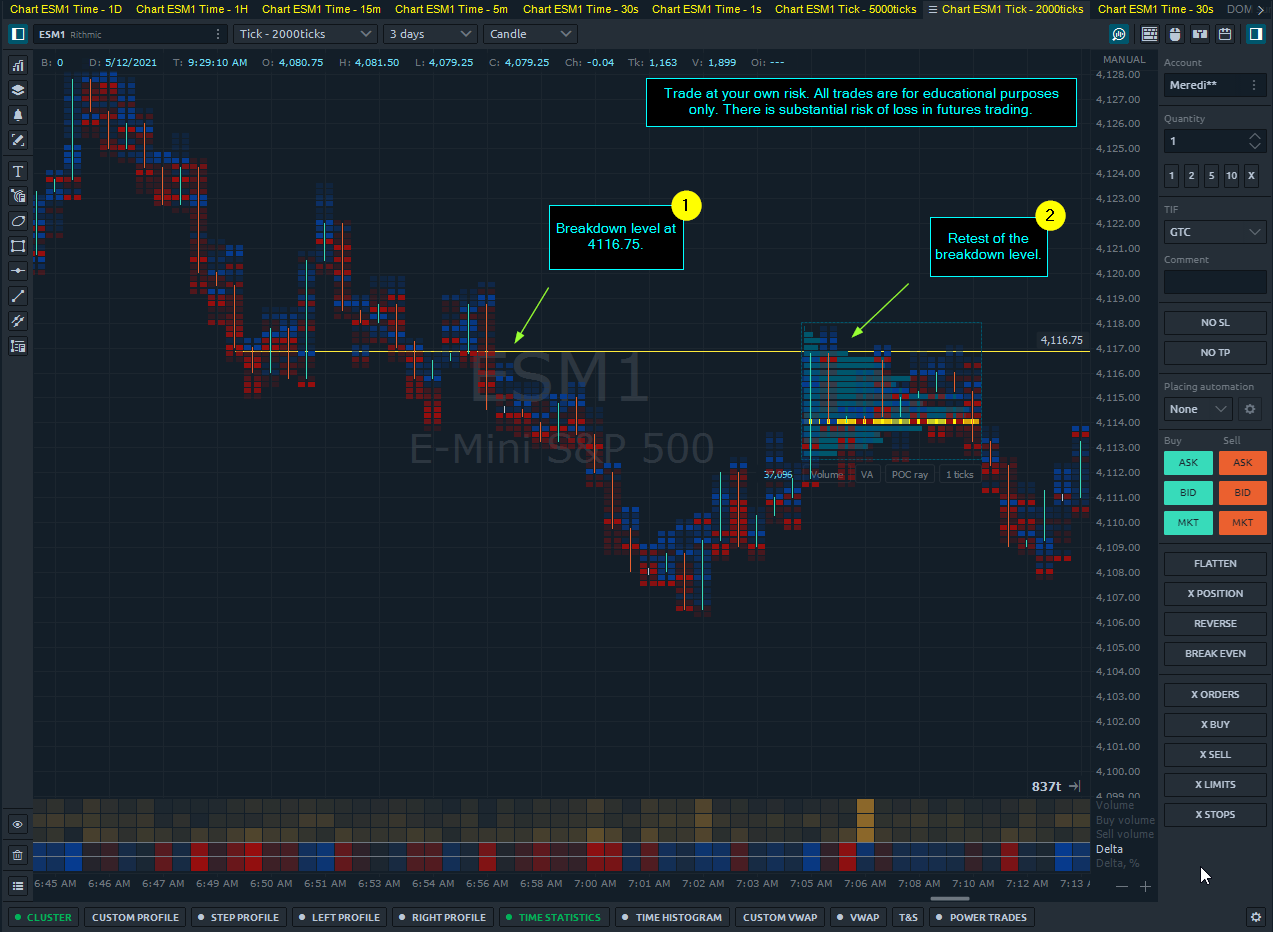
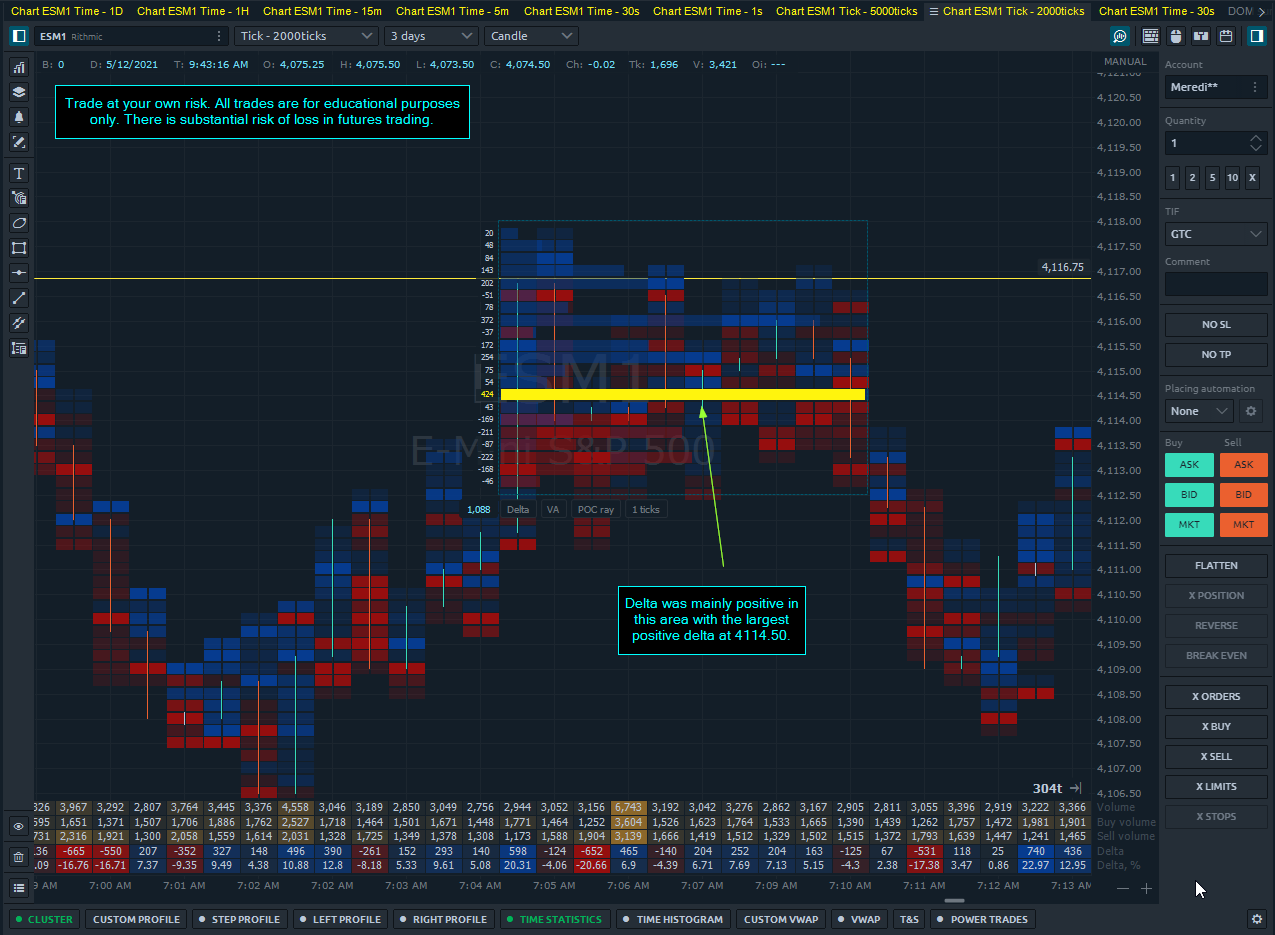
Breakdown of support and retest - Volume analysis.
Here’s a level from 5/12 that was broken to the downside and then retested about 20 minutes later. I want to look at the volume profile and delta of the buyers coming up to the retest.
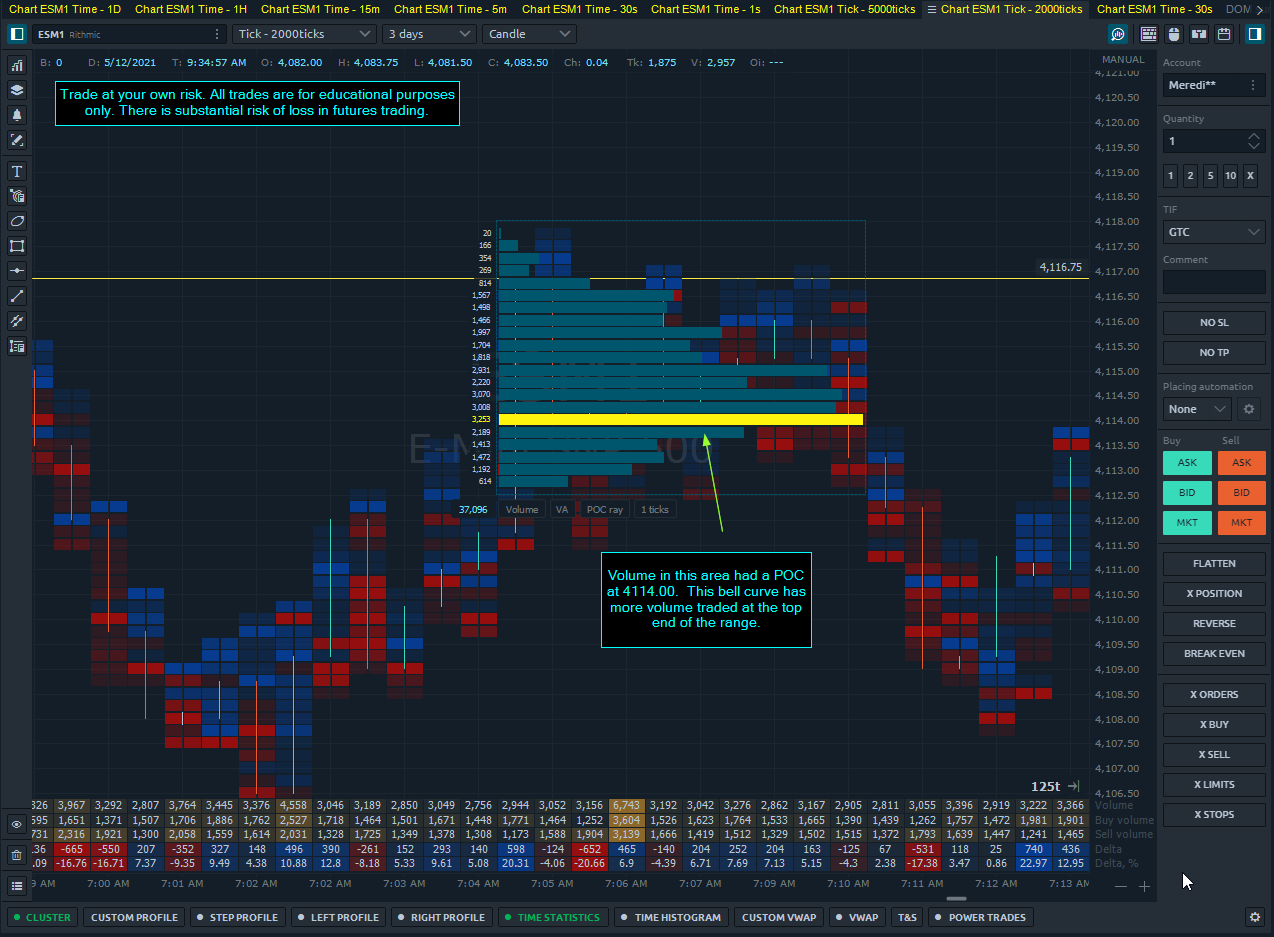
Looking more closely at the volume profile we can see that there is a bell curve but it is weighted more to the top of the range.
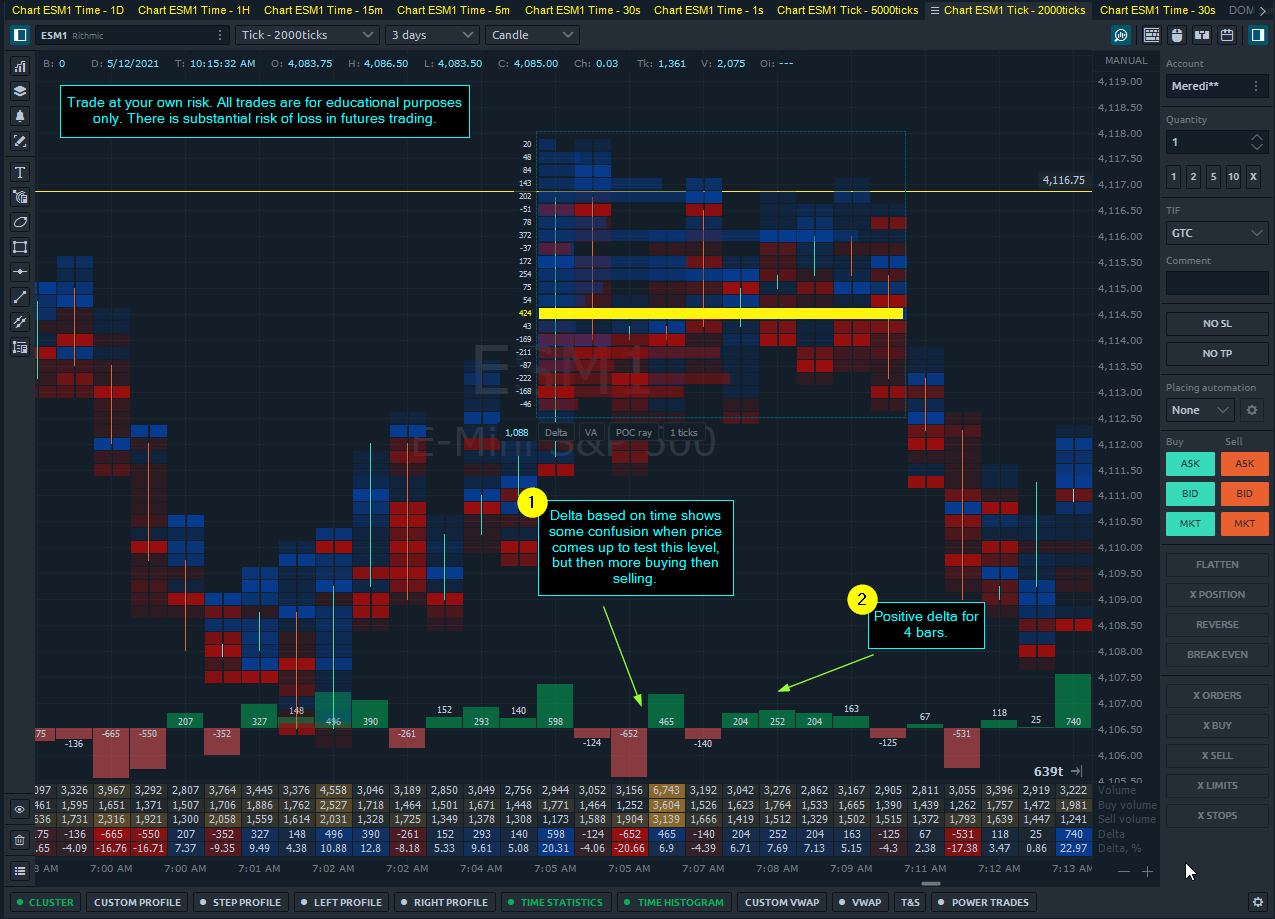
Here is the delta profile for that same time:
On a time basis, we do see more buying than selling at this level.
The decision becomes:
Now we have a clear point at which we are wrong (if we are short and sold the retest), and if we are wrong we can always enter at higher prices at resistance.
If we are right, we ride the price down as buyers puke and then we cover at next support.
There is a substantial risk of loss in futures trading. Past performance is not indicative of future results. The figures here represent an opinion. The placement of contingent orders by you or broker, or trading advisor, such as a “stop-loss” or “stop-limit” order, will not necessarily limit your losses to the intended amounts, since market conditions may make it impossible to execute such orders. Please conduct your own due diligence if Futures are an appropriate instrument for you.
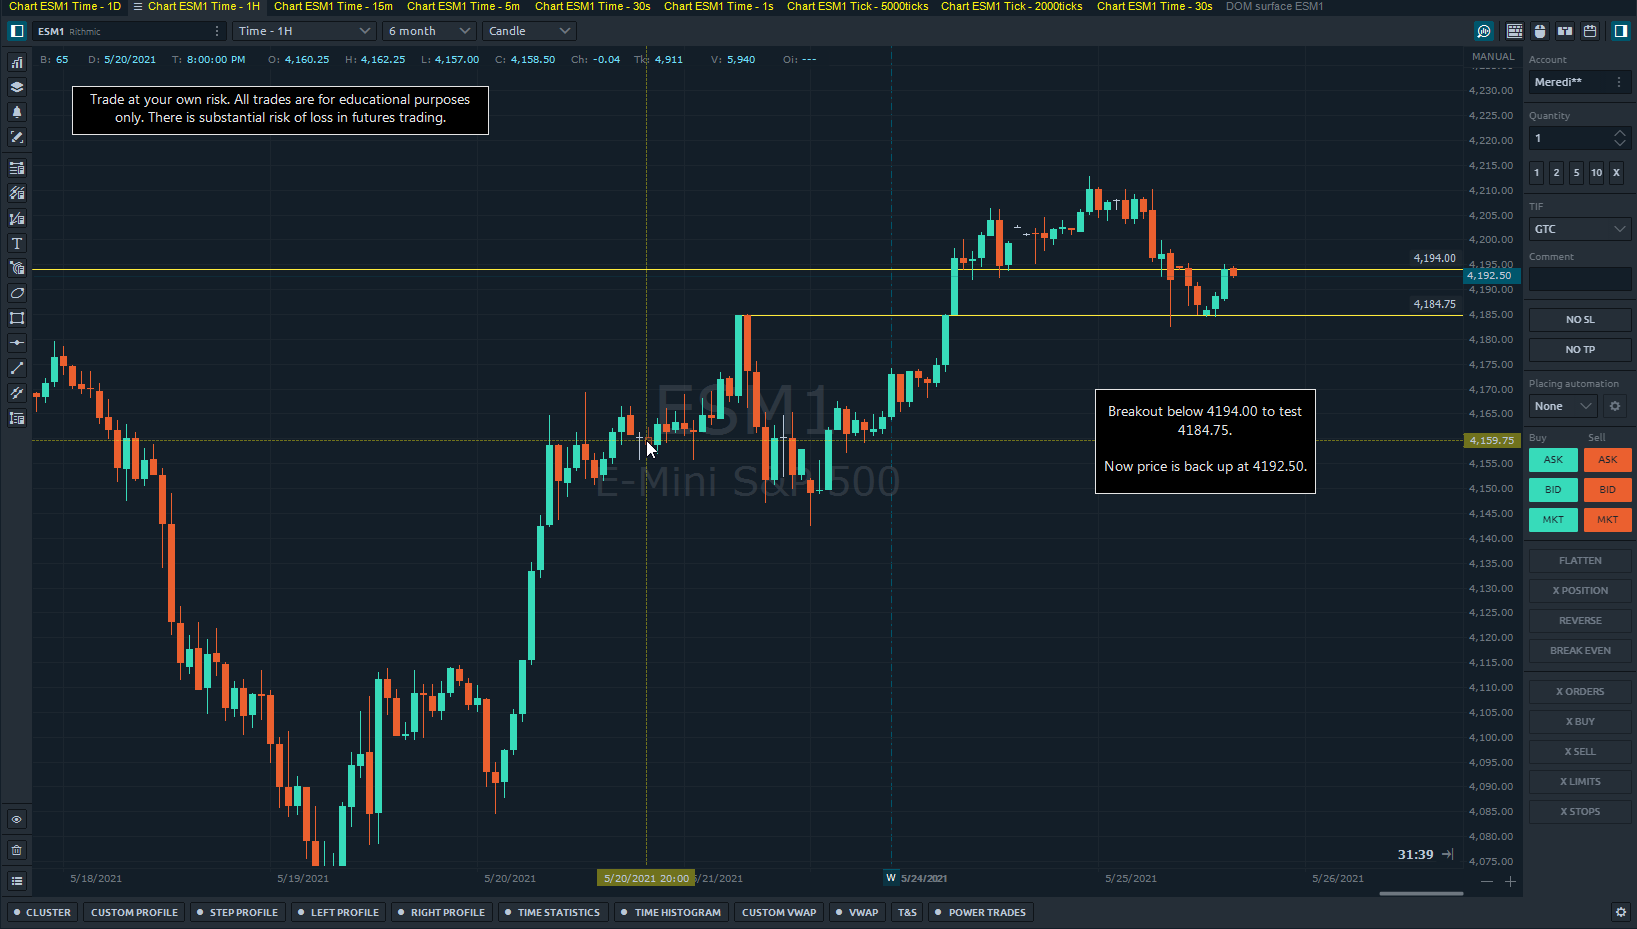
Huge levels of support being absorbed by buyers. ES Mini Futures May 25th
Today we saw a quick sell-off then ranges being formed. The thing that prompted this post is a few things:
Here’s the hourly from today.
There are two major levels here at 4194.00 and 4184.75.
Let’s take a look at the time price came down to breakthrough 4194.00.
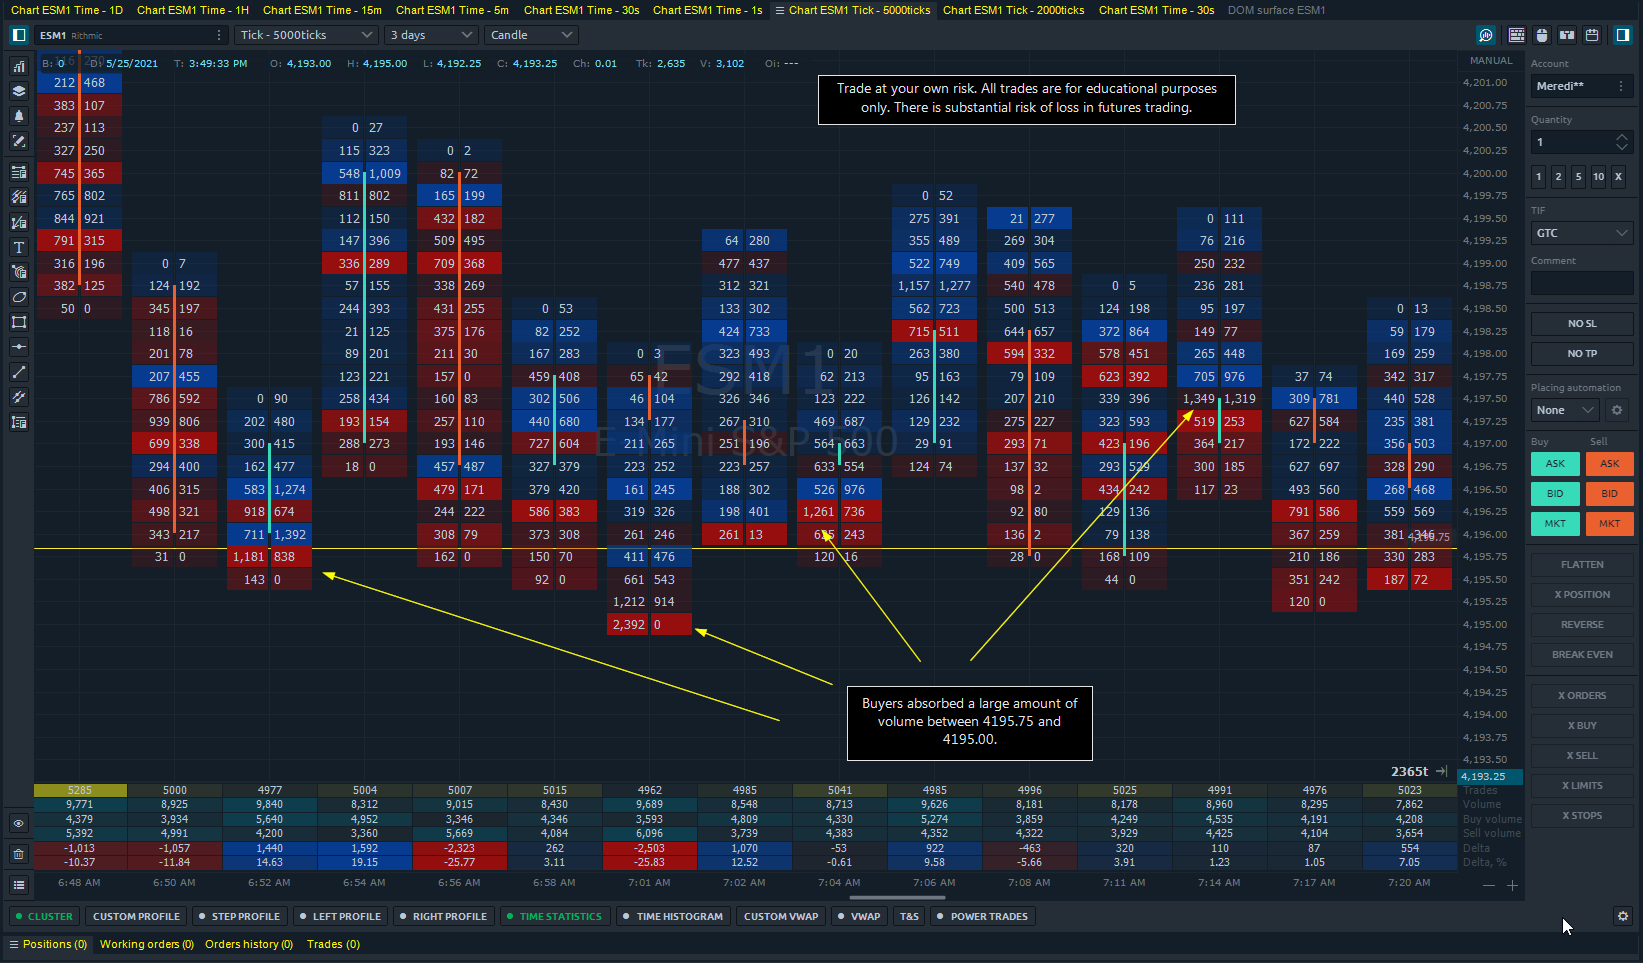
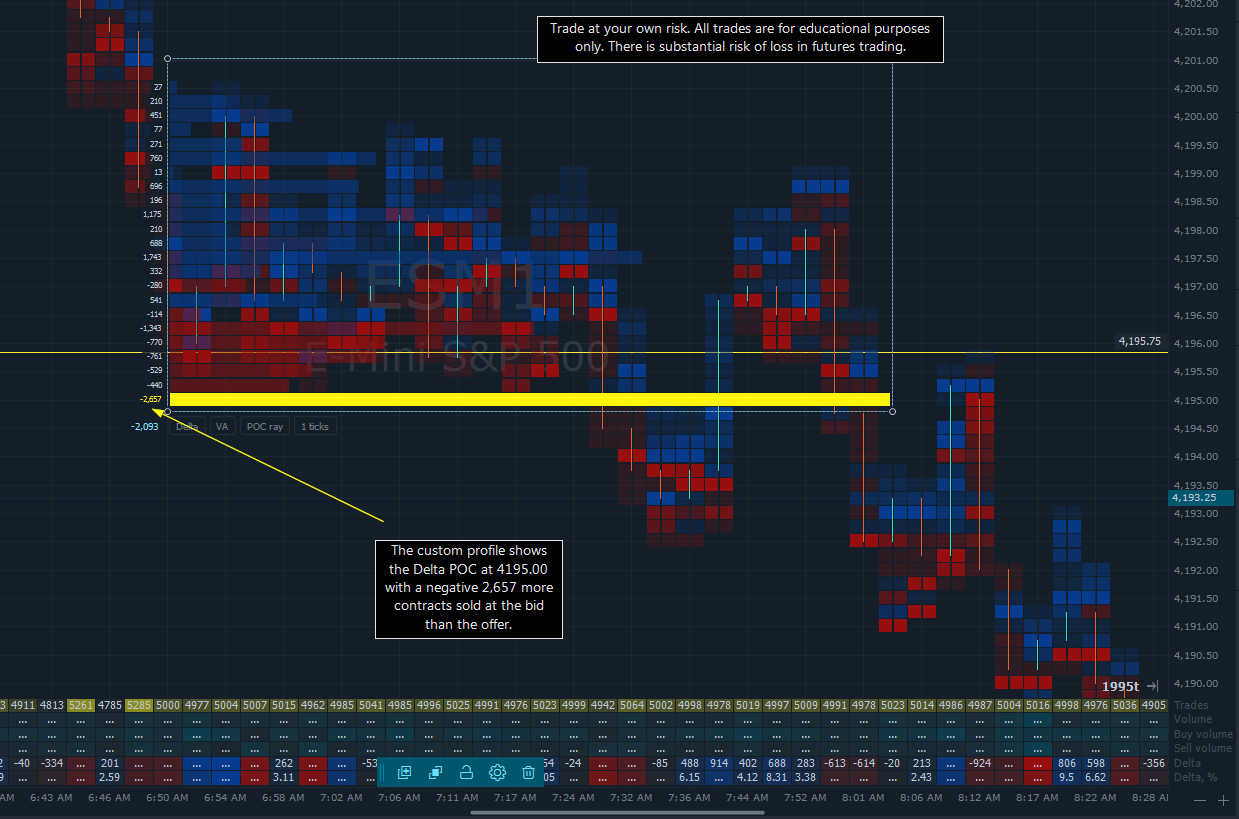
Correction - Another major level at 4195.75 as well.
Here is the 5,000 tick Footprint chart.
There is a huge amount of absorption at this level and it was very obvious as it was happening.
This was a good place to reassess the market structure and determine if this level would hold or eventually break further.
Here is a custom profile showing Delta based on price.
Initially, I was long when price first tested this area. We saw the absorption and it bounced accordingly.
I was quick to get flat because the market felt heavy. I was saying this throughout the trade here, which we see with the huge negative delta in this range.
Point is, a long trade worked here just as a short trade did if the plan was to sell the top of the range and stop out above it.
The only difference is the perception of that market at a particular time. It’s different to be biased short than it is to observe the market is experiencing aggressive selling and heavy offers, saying that out loud.
Biased would be:
“I think… I want… It should…”
Observant would be:
“I see sellers being absorbed by lots of bids… I see buyers not being able to make higher highs… This retest of support is currently holding…”
Being able to see both sides but still have an idea of where the market is going has been very very very difficult for me. Observing, being objective yet confident (where’s the line drawn between the two?), observing my emotions, etc…
However, that is the time where I feel most in line with the market when I’m unbiasedly watching the market.
There is a substantial risk of loss in futures trading. Past performance is not indicative of future results. The figures here represent an opinion. The placement of contingent orders by you or broker, or trading advisor, such as a “stop-loss” or “stop-limit” order, will not necessarily limit your losses to the intended amounts, since market conditions may make it impossible to execute such orders. Please conduct your own due diligence if Futures are an appropriate instrument for you.