Feature Request: Copy and Paste Drawing Tool Objects to different chart windows.
I’m using the Trendline and Price Channel tools which are very helpful. Both set a time and price and in the case of the price channel, 3 times and prices. It would be awesome to be able to copy them to other charts and save a little time. Thanks for a great product.
Hi. I upgraded to 1.62.1 and templates seem to be saving okay now, thanks.
I’m having an issue. When I save a DOM as a template then click on the template icon in the menu, a new window opens but the Buy and Sell columns are missing.
I have to select a different instrument from a different family of instruments (e.g. if the DOM has MES saved, I can’t just click MESU0 so I click CL) to get the columns to appear.
Not a huge deal because I have it linked to my watchlist so it’s easy to say, select CL then click MES to get the DOM to display correctly.
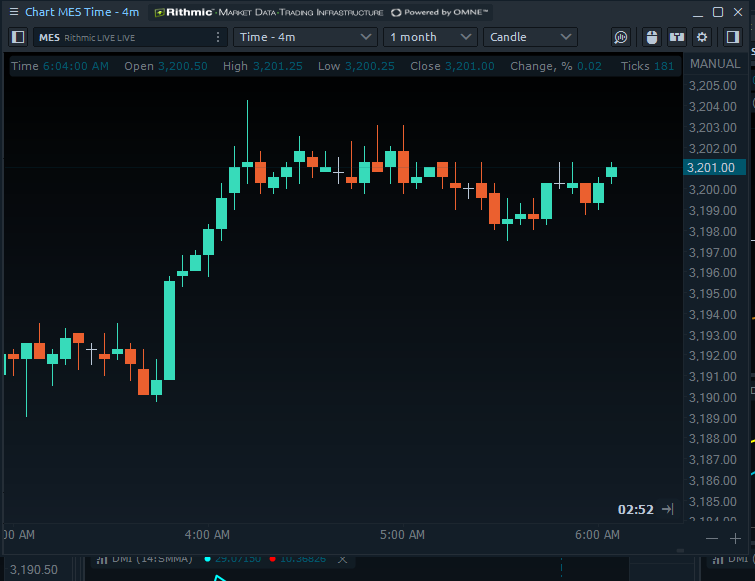
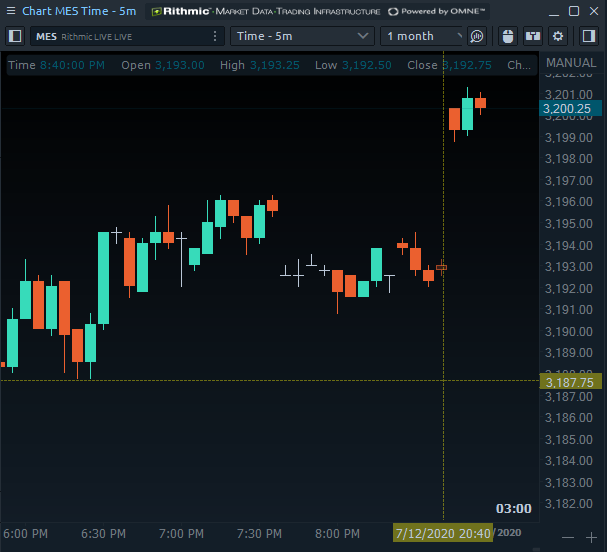
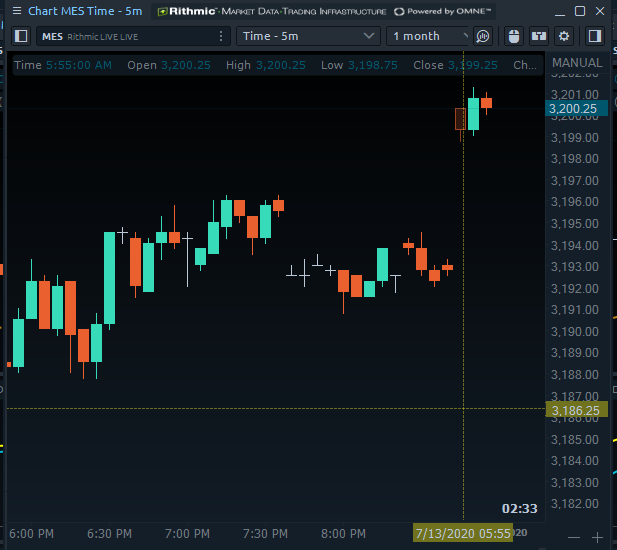
I’m not sure if this is a Rithmic or OptimusFlow issue. This morning, for MES, some chart timeframes have a time gap from 20:40 to 05:55. If I choose any other time like 4 minute, all the data appears normally. Same thing happens on the Cluster chart.
Thanks for bringing this to our attention. Quite a few of our live traders reported issues to us this morning in regards to Rithmic data on Charts. This was actually a Rithmic data issue that extended across multiple platforms.
Apparently, there was an issue with their charting server which resulted in time gaps and incomplete data, but this has apparently now been resolved.
If you are still having issues, please Right Click your chart > Reload History (server).
Keep us updated on this if issues persist!
Also:
Thanks for mentioning template issues on DOMs as well. We will bring this to the attention of our developers.
Thanks,
Jake
Optimus Futures Support
[(800) 771-6748]
Disclaimer: Trading futures and options involves substantial risk of loss and is not suitable for all investors. Past performance is not necessarily indicative of future results. You should therefore carefully consider whether such trading is suitable for you in light of your financial condition.
For Rithmic, allow connections to an account that has order routing but no market data. Currently, if the Rithmic account does not have market data, Optimus Flow will not connect.
Thanks for bringing this to our attention and I believe this is on the software end, not Rithmic. Not many users have the same configuration as you (live accounts without market data). Have you successfully logged into other platforms with this same account?
Please allow us to address this with our developers!
Yes, it is working well with data from IQFeed and placing orders over Rithmic.
Trailing limit orders aren’t working (trailing stops are) but I’m not sure if this is a general bug or directly related to this configuration. I’ll keep you updated.
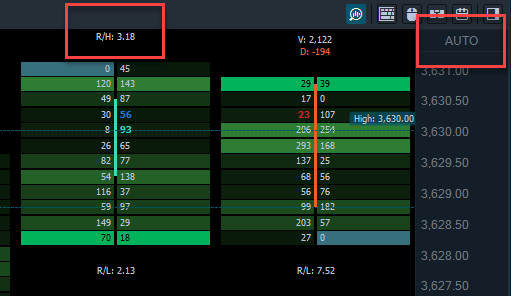
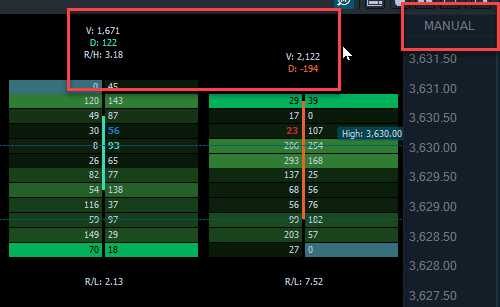
On the Imbalance cluster chart type, the text above the bar for Volume, Delta, R/H etc. is off the top and bottom of the screen for bar(s) that hit the edges. Would it be possible to bring those back into the visible chart area?
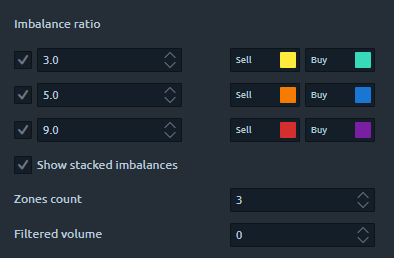
For Cluster -> Imbalance Ratio : Multiple Ratios Checked
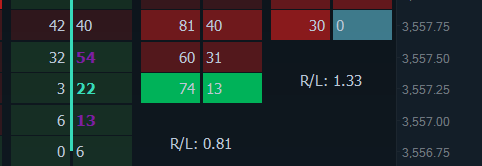
Currently, a zone is shown on the chart only for matching colors. If one imbalance color is in or next to another color and they total the Zones Count collectively but not each individual color, no zone is displayed on the chart.
This actually would have helped me exit a trade because a price dropped down and entered what would have been a strong buy imbalance support. Pics below hopefully illustrate what I would like.
Cluster settings Note colors.
Note buy imbalance Purple, Cyan, Purple. No region was shown.
What I would like is a cyan region shown on the chart since 3.0 is encompassed in the two 9.0 imbalances. Even better would be each colors lines show but that might be confusing.
(This is the exit I mentioned. I got out at $3558.00 and had I known about the buy imbalance region, I may have held out for another 2-3 ticks).
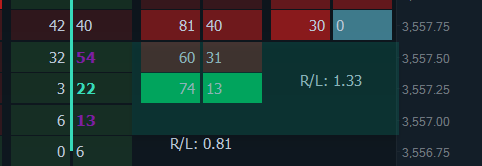
Note 5 red imbalances shown above a yellow one but the yellow price was excluded from showing in the red region. Using above logic, the whole region would be yellow but that’s a little misleading. I’m really not sure how to do this one other than to show just the yellow region.
So, maybe a checkbox to paint varied color imbalances or a select box with choices None, Color of least imbalance, Color of greatest imbalance. Just a thought.
I really like this platform overall. I would like to see an option to change the sizes of the subwindows for the indicators. They take up a lot of real estate on the chart. I can manually resize them and have even updated the template after doing so but the next time I use the chart, it always reverts to the default size.
It would also be very helpful if the indicator and candle information located at the top of the chart (Open, Hi, Low, etc.) were larger and/or highlighted. This screenshot will be nearly illegible and that is the problem.
In Object Manager, it would be helpful to have the line you are working with highlighted. When going to clean up a chart, it would be quicker to do it from Object Manager than clicking on each individual line. I thought the magnifying glass icon, “Show on Chart” would highlight it on the chart. Most times it instead opens a blank chart at some random time interval.
Feature Request
-I would like to see a baseline chart type added as one of the chart options. Trading view has one but I am not a fan of their execution. Should this be considered and implemented, it would be incredibly useful to be able to set the baseline at your desired location, but for it remain anchored if you would like. Say for instance, the previous day’s close. With Tradingview you can set the baseline where you like, but once you begin to move the chart, especially if you have unlocked the price scale and can freely pan it, it no longer stays anchored to the desired location. It would be extremely useful for me to have this as an option as it would allow me to reduce the size of my market heatmap and therefore have more screen real estate for my general market overview panel/chart.
Feature Request
-I know that once you close stop the simulator, all of the trade data is gone and will reset when you start it back up. I would REALLY like to be able to at least have an option to retrieve the data from the previous session for journaling purposes. I had to force quit most applications on my computer earlier today, including Optimus Flow. I was not able to export any trade data and I have now lost the entire day’s worth of data.
So fun little fact. After about an hour of looking, I was able to find the log file that held the day’s trade data from the simulator! This may not be new news to some, but it’s a win for me. That being said, it has been incredibly difficult to get the data to delineate into a useful spreadsheet within excel that will be the same format needed to upload to the trading journal without losing any data. I’d rather not do them all by hand, but I just might have to.
Awesome platform and great grouping capabilities (love the Binds). My recommendations are as follows:
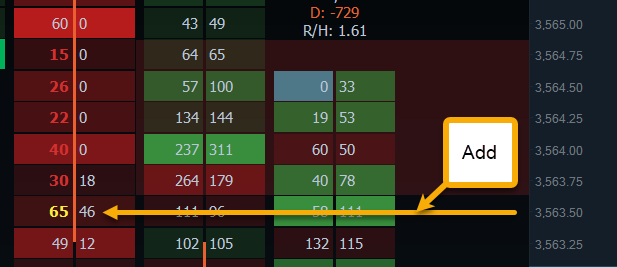
The DOM is a bit slow to center. I know you can keep it centered (this is an issue as you can’t see the movement in price), keep in view is what I have now but you have to wait for price to get all the way down or up for the recenter to happen. I recommend a setting where you can choose the number of ticks until it centers. I.E. If price moves ten ticks down then the ladder moves back to center. Customizable based on market volatility.
Footprint charts (or any) should have a setting to keep price completely within (and the Delta, R/H, R/L) within view. I recommend a setting to where you can set the top and bottom of a chart to have a blank space for on-chart statistics such as a setting for 6 ticks buffer at top and bottom.
Backup manager should be able to save the backups to any location not the default. Important for those of us using an emulator to run windows.
News: Currently there are no news connections in Optimus Flow. Could allow an RSS reader for economic calendars or fundamental news.
Big One: Chart trading: You can trade from the chart but have to click a button in the far top right of the chart. Once your order is set you have to go to the far left of the chart to adjust entry, SL, PT. I would recommend a setting so you can have the adjustment buttons for entry, SL, or PT on the right leading edge of the chart as I’m sure most pay attention to the right edge and not the left.
I primarily use western bars on my long term chart and would love to see a thickness adjustment setting.
Thank you for your feedback and suggestions. I wanted to make a few points that may help you:
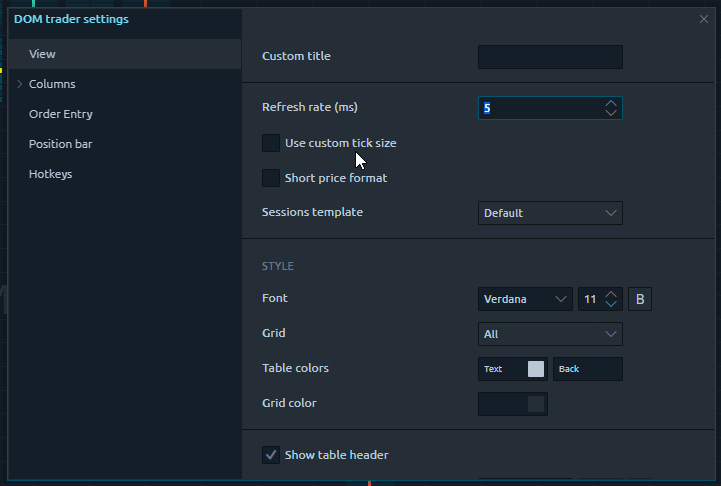
Have you considered entering a lower refresh rate for your DOM? This may put more of a strain on our latency with Rithmic, but it will update the DOM faster. In turn it may also center your DOM faster. The lower the number, the faster.
You can lower this by right clicking your DOM > Settings > View > Refresh rate (ms)
You can choose any location on your device to save a backup file to. You can even save it to a USB and transfer it between devices if you’d like.
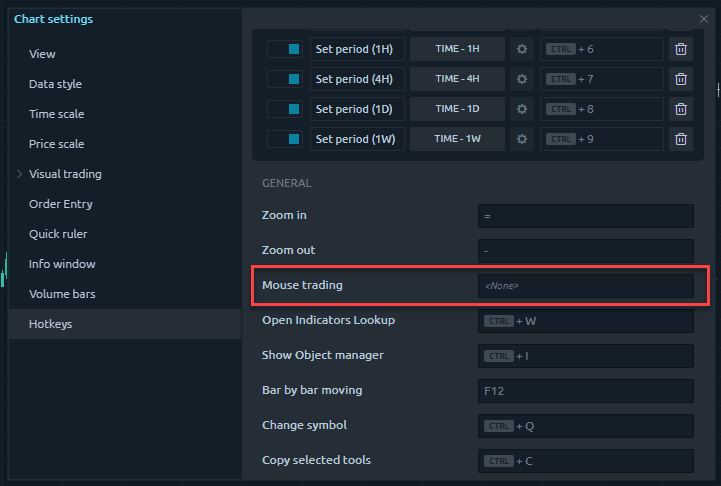
You can actually setup a hotkey to re-enable/disable chart trading. This still requires a press of a button, but it is much more convenient than moving your mouse to the top right of your chart each time you need it enabled.
Right click your Chart > Settings > Hotkeys > Mouse Trading
Unfortunately, there are no hotkeys at this time to adjust your working orders, but we can suggest this along with having the ability to display your orders on the right side of your chart rather than the left.
I hope these points help and thanks again for the feedback!
Thanks,
Jake
Optimus Futures
Thanks for your feedback. We receive a lot of requests, but we do try to implement every suggestion that aligns with our software plans. The hardest part is knowing which changes will help most users or the community as a whole. In the future, we might use surveys to better gauge the priority of implementation.
Development is not cheap, and neither is carrying free software.
I do like the news part and wondering if this Economic Calendar would be something we should use? If there are others with APIs, I would be willing to explore them, ideally, they are free.
I have another request. API access for developing custom indicators and panels. Seeing as Optimus Flow is essentially a reskinned version of Quantower with certain things enabled/disabled. They provide access to the API for free.
I have some ideas for indicators and panels that I would like to code and test. Should they show some promise (or not, lol) I would gladly share them (along with the source code) with no expectation of reimbursement of any variety except for constructive criticism and modification recommendations in a vein similar to useThinkScript.com.
Ok, fair enough. I will reach out and give you access to the API, once we talk to the developers.
But, also realize that we have added important features such as Profit and Loss target alerts and Time in Trade alerts that QT does not have. Also, we are working on new APIs that would be available to Optimus Futures customers only. We will do whatever is necessary not to just have a white label but keep developing features that would help our traders.
I appreciate your willingness to share this development with the community and if these indicators prove to be popular, we will integrate them directly into the platform.