Thanks for the response Jake!
This is great and looks like it’s very similar to the ATM feature I’m used to on NT8. Am looking forward to seeing it successfully implemented.
Thanks for the response Jake!
This is great and looks like it’s very similar to the ATM feature I’m used to on NT8. Am looking forward to seeing it successfully implemented.
I do have a follow up though; would you be able to place orders directly (while also using the bracket ATM strategy) on the chart by clicking an exact point on the chart?
Hi @saarboi,
Glad to hear this is what you were looking for! I know many other users, including our team, have been looking forward to this.
It’s still in development, but I hope to add this feature to chart trading as well. As of right now, bracket orders are only available through order entry or the DOM.
I suspect this is the next big feature we’ll be adding!
Thanks,
Jake
Optimus Futures
Great platform. Multi-threaded, well done. The interface is beautiful. Super easy to find things, muted colors by default, ability to disable auto-center. So many things to like.
I do have a request and that’s to add a Zero line to the MACD indicator.
Right now I add a horizontal trend line at 0.00 manually but I have to do it on all the futures I look at.
Thanks!
@Miya, I had the same issue when I was watching my order ticket, I felt something was off lol. But then I played around with it and realized you could change font and color, size, etc. I’ve been using the platform for a week now and it’s honestly the best platform I’ve ever traded on.
I used to trade at a prop firm in Chicago, we used TT for order entry and Market Delta for seeing trades hit the bid or lift the offer. This platform has both and it’s extremely easy to set up.
Hello, while trading the MES/MESU0 2000 tick chart i cannot use drawing tool on the chart… the mini tool bar appear at the bottom of the screen when I try to use them but they do not appear.
Any help would be appreciated
an unrelated request would be for the lock button for chart drawings to allow you to chart trade on top of said drawings.
Many times i have try to click and drag or close/open a trade only to move a drawing!
Thanks
Liam
Hello @Monny,
Thanks for your post and welcome to the community forum!
We have discovered the same issue you are experiencing and have determined it only occurs on non-time based charts. Our developers are aware and are working on a solution to have this fixed.
Thank you for your feedback with the ability to lock drawing tools, I agree that would be a good feature!
We will keep you updated on the drawing tool fix.
Thanks,
Jake
Optimus Futures Support 
Hi again, sometimes my stop loss reverses my position instead of closing it… very sketchy… i thought perhaps it was user error at first but it appears to be a bug of some sort since it has happened multiple times now. luckily it made me some money today but it could have easily blown up my account had i been away from my computer for longer.
it seems to happen when i scale into a position and/or modify a stop loss to scale out… not exactly sure what action precedes the position reversal but its pretty scary
let me know if i can helo solve this issue
thanks
Liam
Beautiful UI. Nice job making it attractive to look at all day.  . I’d love to see the following features.
Multiple OCO to scale out. With ability to save templates of OCO setup so I can recall different setup for different instruments.
Smart order in DOM - Currently, the DOM places limit order. It’d be great if I can just click on a higher bid to place a buy stop and lower ask for a sell stop.
Showing PNL in points/ticks as an option.
Have an option to separate RTH and Globex session in the same TPO chart
Allow showing the same drawing in multiple chart. I like to have multiple time frames up on screen and when I draw fibs, I’d like to see the fib lines on my hourly, 15 min and 5 min chart. An option to have drawing objects shown in all time frames would be great.
Indicator/study set - I tends to apply a set of study together. Being able to save a set of study and reapply selectively to different chart would be a welcome feature.
Thank you and keep up with the good work!
One more thing I noticed! while chart trading, if i am modifying a stop loss while the order is filled the number of contracts doubles…
Again let me know if I can help!
I realize these things may be circumvented with the OCO chart trading you guys are working on so thank you again for all the hard work!
Liam
Would be nice to be able to put a simple moving average on the Volume indicator. Can’t do that now. Alternatively, make the Simple Moving Average be able to source data from any subchart/data-series.
Hi @Monny,
Thanks for your feedback with this and for mentioning the issues you’ve occurred.
I personally have not seen either issue you have mentioned, so its a bit hard for me to address the issue.
I understand how it can be hard to replicate this issue nor do I encourage you to attempt to do so with a live account, but if you are still on demo, is it possible for you to record your screen while both issues (reversing position + doubling of contracts on modifying stop loss)? This would help myself and our developers fix any potential issues with this.
Also, in regards to the issue you encountered with drawing tools, we have a fix coming for this very soon!
Please keep me updated on the issues with orders you are encountering.
Thanks for your cooperation with this,
Jake
Optimus Futures Support
https://optimusfutures.com/
(800) 771-6748
Disclaimer: Trading futures and options involves substantial risk of loss and is not suitable for all investors. Past performance is not necessarily indicative of future results. You should therefore carefully consider whether such trading is suitable for you in light of your financial condition. The placement of contingent orders by you or broker, or trading advisor, such as a “stop-loss” or “stop-limit” order, will not necessarily limit your losses to the intended amounts, since market conditions may make it impossible to execute such orders. The high degree of leverage that is often obtainable in commodity interest trading can work against you as well as for you. The use of leverage can lead to large losses as well as gains.
I’ve emailed support one of the problems captured on screen record, i dont have access to a sim account so i dont know if ill be able to catch the other one but ill try. - Liam
Feature Request
It would be nice if right/left/bottom margins could be specified on autoscroll.
Reason
Sometimes I have a right profile displayed, or a Time profile displayed, and I would like to keep the candles clear of that data for clarity.
Feature Request
Send Power Trade alerts via the Telegram Messaging system.
Reason
I can be notified of Power Trades via my mobile phone.
Feature Request
Show objects on linked charts.
Reason
I like to view a smaller timeframe and a larger timeframe side-by-side, and see the same objects and alerts on both charts. Objects should continue to respect ‘show on additional timeframe’ for displaying on linked charts.
Feature Request
On a cluster chart, ability to show delta summary figure as % rather that value.
Reason
Comparing delta with previous bars would make more sense if comparing % rather than value. Volume is shown immediately above as a value, so showing volume (value) and delta (%) I think would make it easier to understand at a glance.
Feature Request
When choosing additional timeframes that objects are displayed on, the ability to choose “All inferior timeframes” and “All superior timeframes”.
Reason
Currently it is necessary to create each additional timeframe individually. This is cumbersome as I like to do analysis on 1m, 5m, 10m, 30m, 1h, 2h, 4h, 1d, 1w, 1m.
Explanation
If I draw an object anchored to the 1h timeframe and select “All superior timeframes”, that object should display on 1h, 2h, 4h, 1d, 1w, 1m.
If I draw an object anchored to the 1h timeframe and select “All inferior timeframes”, that object should display on 1h, 30m, 10m, 5m, 1m.
Bug Report
Right clicking on an alert and selecting “Remove selected” does nothing in a chart window. Instead it is necessary to left click on the alert, then choose the trashcan icon. However, the expected action does work in a TPO chart.
v1.58.1
Hi @autobahn,
Thank you for your suggestions and bug feedback. We appreciate your well-thought reasoning behind each feature request as well! Very insightful!
I’ve just removed the posting limitation you encountered previously, so this should no longer be an issue. If you have any additional requests or feedback, feel free to post them.
Thanks for your time!
Jake
Optimus Futures Support
Bug Report
When placing a limit order or modifying a limit order (e.g. changing the associated Stop Loss), Optimus Flow reports the broker has received the request multiple times. The screen is updated multiple times and the acknowledgement sound is played multiple times. The Event log shows multiple entries.
This only happens when connected directly to the Rithmic data feed. When connected via R-Trader Pro, the expected single acknowledgement is received.
This is on the 14-day demo paper trading account. v1.58.1
Bug Report
When a cluster candle timeframe is set to 2H or 4H and a Step Profile is added, the Step Profile is sometimes offset and does not sync with the candle.
To replicate:
Show candles on a 1H timeframe and enable Cluster. Enable Step Profile and set the period to 1H. Note how the step profile is displayed over the cluster exactly. This is the desired operation.
Now show candles on a 2H timeframe and enable Cluster. Enable Step Profile and set the period to 2H. Note how the step profile is displayed offset by 1 Hour and no longer matches the candles. This is not expected.
Feature Request
When dragging a stop loss or take profit on a chart window, it would be nice if a horizontal line runs all the way across the chart to show exactly where the order will be placed.
Reason
This would make it much easier to accurately place the SL or TP, for example when placing at the edge of market structure or another candle high/low.
Feature Request
When enabling a Right Profile, allow custom periods rather than the limited number of predefined selections. Alternatively, add a selector to set the period to “Last x candles”.
Reason
When monitoring a single candle or the last X candles), it would be helpful to display only those candle statistics on the right hand side. This is possible if the total time is already in the predefined selection, but otherwise the only way is to draw a custom profile around the candle and keep moving it as new candles are formed.
Feature Request
Ability to switch between netting mode and hedging mode. Currently all orders are combined, so in the Position window it shows a simple total of my net position rather than the individual entries. I would like each individual entry to be shown, and the ability to set SL/TP and close each individual entry. It would be nice if netting could be managed manually, for example highlighting specific order to combine into a netted order with an average price.
Reason
I sometimes trade multiple strategies, for example I may enter a swing position and also enter a short term day-trade. I like to monitor both positions independently, even though I may be trading both using the same asset.
Feature Request
Ability to simulate a continuous contract (auto roll-over) to allow technical analysis over a longer period. It isn’t so bad in the 2nd or 3rd month, but just after Futures rollover there is very limited past data available for Technical Analysis.
Feature Request
When displaying a Cluster with histogram, or a Step Profile, have the ability to make the bar lengths consistent across the entire chart. Currently the bars are proportional only within the candle they represent.
Reason
I like to compare histograms not just within candles, but between candles. I cannot do this at a glance; it is necessary to cross-reference overall candle volumes first. For example, if candle A displays mainly long histograms but total volume is low, and candle B displays mainly short histograms but total volume is high, this must be taken into account when guesstimating trends.
Feature Request
When displaying a step profile with 2 elements, e.g. Buy/Sell volume, ability to have the histogram displayed centrally rather than stacked right or stacked left.
Reason
This would match the way Clusters are displayed, It is easier to compare the left/right data at a glance.
Feature Request
Ability to organise favourite timeframes. Currently if I add 10m, it puts it at the bottom of the list rather than between 5m and 15m. To get around this it is necessary to delete all the timeframes and then add them one at a time, in order.
Feature Request
Fixed vertical sizing of charts when using the double-click-to-centre, auto and auto-centered modes.
Reason
When using Cluster mode, it is important to set the height of the candles so that text and histogram is visible. This is more important that showing the entire candle on the screen. However, it is still necessary to have the current price shown centred, at the top/bottom, or a percentage margin from the top/bottom. Currently if price scrolls off the screen, the height of the candle is adjusted and this messes up the display of the cluster data. The current workaround is to disable auto, and manually drag the chart to show current price.
Feature Request
Increase amount of zoom available on a candlestick cluster chart.
Reason
When viewing a 30m+ cluster chart, the current maximum amount of zoom does not provide adequate width for the histograms to be easily viewed.
Feature Request
Set a time-based alert that can play an alert/display a message/notify Telegram.
Reason
Sometimes I forget the London open is about to start and volatility is expected to increase. It would be nice to set a recurring alarm when routine events happen at a time rather than a price.
Feature Request
When trading from a chart, currently it is necessary to drag the TP/SL icons to the desired location. It would be nice if TP could be clicked once, then clicked again on the chart to set the location.
Reason
It is more difficult to move the mouse accurately while holding a button down. It also feels unnatural. On slower computers or when working in a Remote Desktop session, screen updates may be smoother and quicker if using click/click rather than click/drag/release.
Bug Report
When using an Apple trackpad, the zoom function only works in one direction.
How to replicate
Usually the mouse scroll wheel will increase or decrease the amount of zoom. If you connect through an RDP session from an Apple Macbook and use the trackpad, this behaviour is not correct and it will only zoom out regardless of the direction you try and zoom. i.e. both zoom in and zoom out actions will cause the chart to only zoom out. The current workaround is to use the +/- icons on the chart rather than using the trackpad to zoom.
Feature Request
Adjust the brightness of the outside Value Area sections.
Reason
When VA is selected, outside regions are displayed more dimly and there is no control over brightness. Currently I find the brightness setting to be too dark making it hard to see the outside areas against the dark background.
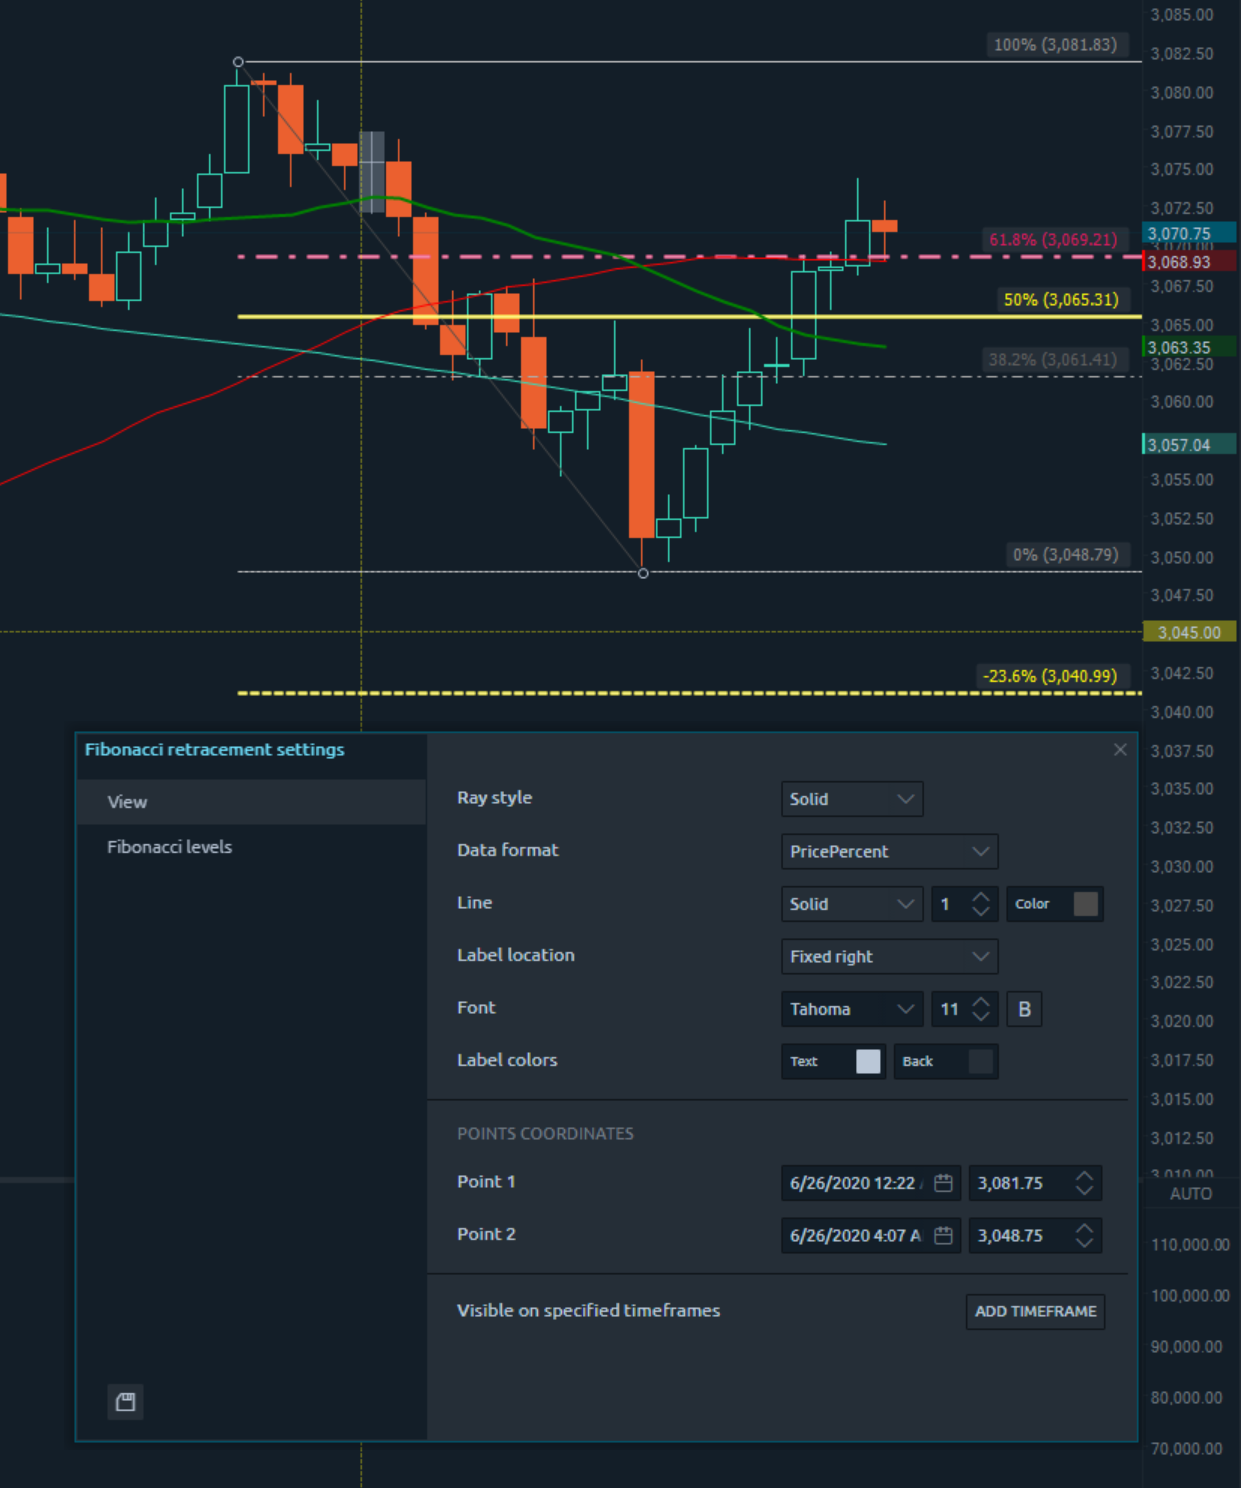
Bug Report
When drawing fib retracement on the chart, the initial anchor does not appear to snap to high/low on candle. And the second anchor appear to snap to high/low but after clicking the mouse button, the anchor to be shifted by 0.01-0.04 on the ES chart.
Please see the screenshot. As I drew on the chart, it doesn’t snap to 3082, the high of the candle. Bottom anchor is snapped to 3048.75, the low of the candle but rendered to be 3048.79.
This bug really brings out the OCD personality in me. I’m so used to having charting software snap to high/low properly that this bug is very distracting.