After spending hours customizing a new workspace, it disappeared one day when I started up OptimusFlow. Empty workspace when I started it in the morning. Just thought you might want to know that. Auto-saving workspace changes is convenient until some bug creeps in and saved an empty workspace.
Steps to reproduce bug
Create a new workspace
Customize it to your heart’s content
Right-click on OptimusFlow icon on task bar and select “Close all windows”
Restart OptimusFlow and the workspace got empty out at start-up time.
Workaround
Don’t do step 3 above. Close OptimusFlow from the application’s bar.
In my experience, this typically occurs when a user attempts to close their platform, but accidentally closed the workspace instead. I am not saying this is the case and it can definitely be a bug, but since the workspace/bind close icon and the actually platform close icon are very close together mistakes do tend to happen.
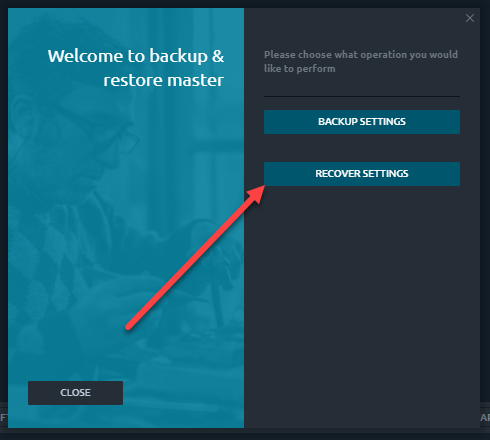
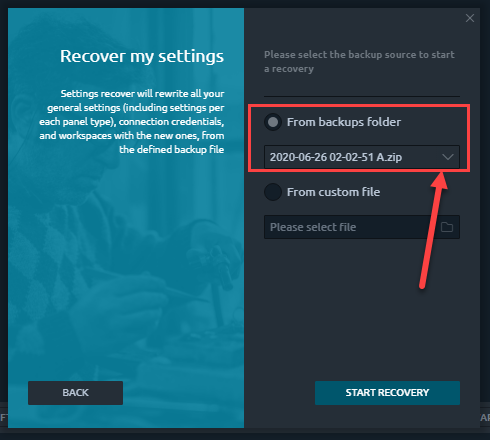
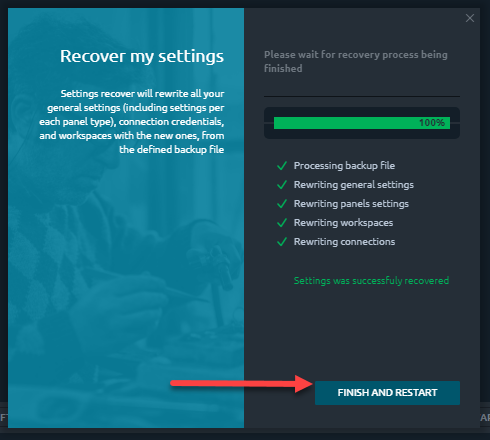
One thing I can suggest is that Optimus Flow actually has an auto-save feature that periodically saves thoughout the day whenever you make a change on the platform. If you ever encounter this issue again, I encourage you to use the backup feature to restore your platform and your lost workspace.
Use the BaM - BACKUP MANAGER found in the main menu of Optimus Flow to initiate this process.
Then choose the From backups folder option. You will likely find several save points within this section that you can refer to that were saved throughout the day.
You also have the option of choosing a Custom File. You have the ability to manually save and create your own custom file by choosing BACKUP SETTINGS option from Step 2.
Once you chose From backups folder, click on Start Recovery, and finally Finish and Restart to revert your platform back to a previous save.
I hope this helps if this issue ever happens again in the future. If you are positive this is a bug and not an accidental closure of your workspace, please keep us updated!
Thanks for the great feedback and contribution!
Jake
Optimus Futures Support
Bug Report
Optimus Flow does not always completely exit after quitting, and it is necessary to go into Task Manager and kill the remaining processes. This is on Windows Server 2019 Datacenter, untested on other OS.
Bug Report
Related to above, when doing a recovery from backup, Optimus Flow should quit and restart with the restored config. On restart it often gives an error that Optimus Flow is still running. It is necessary to wait and try again, or go into Task Manager and kill processes before reloading.
We have run into this as well and are aware of this. We’re working on a fix. If this does happen in the future, you will be able to find the Starter.Exe running in the background of the task manager on Windows.
Simply close the Starter.Exe process to close it out entirely. If you get a notification when attempting to open the platform that say “The Program is already running” the solution above is a fix for this as well.
Thanks for your feedback,
Jake
Optimus Futures Support
Jake, thank you for the details instruction on backup/restore. My reported bug was about destroyed workspace if the user close OptimusFlow via Windows close all windows on the Windows task bar. Closing OptmiusFlow via the OptmiusFlow application bar at the top of desktop works correctly. Unfortunately, I can’t take a screenshot now because I’m awaiting funding of my new account to regain access to OptimusFlow.
I use Pivot Points along with Central Pivot Range of the previous day. It would be great to add it as either an add-on of Pivot Point or its own Indicator. Thanks.
Feature Request: Copy and Paste Drawing Tool Objects to different chart windows.
I’m using the Trendline and Price Channel tools which are very helpful. Both set a time and price and in the case of the price channel, 3 times and prices. It would be awesome to be able to copy them to other charts and save a little time. Thanks for a great product.
Hi. I upgraded to 1.62.1 and templates seem to be saving okay now, thanks.
I’m having an issue. When I save a DOM as a template then click on the template icon in the menu, a new window opens but the Buy and Sell columns are missing.
I have to select a different instrument from a different family of instruments (e.g. if the DOM has MES saved, I can’t just click MESU0 so I click CL) to get the columns to appear.
Not a huge deal because I have it linked to my watchlist so it’s easy to say, select CL then click MES to get the DOM to display correctly.
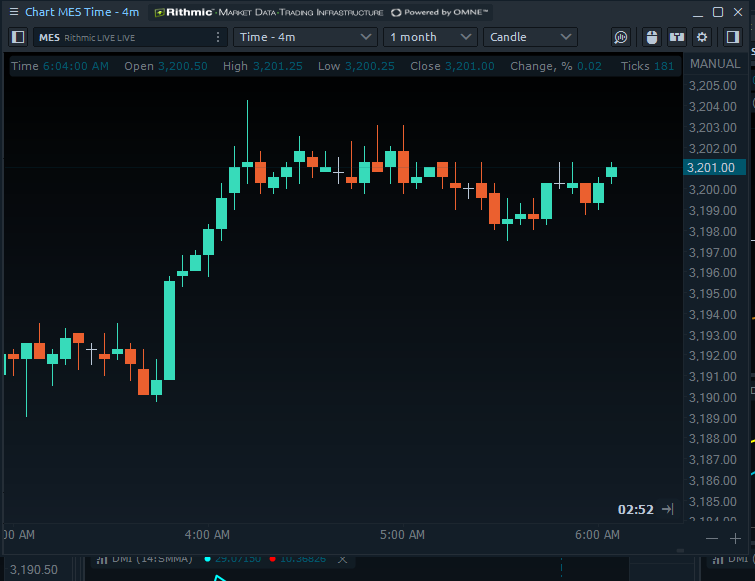
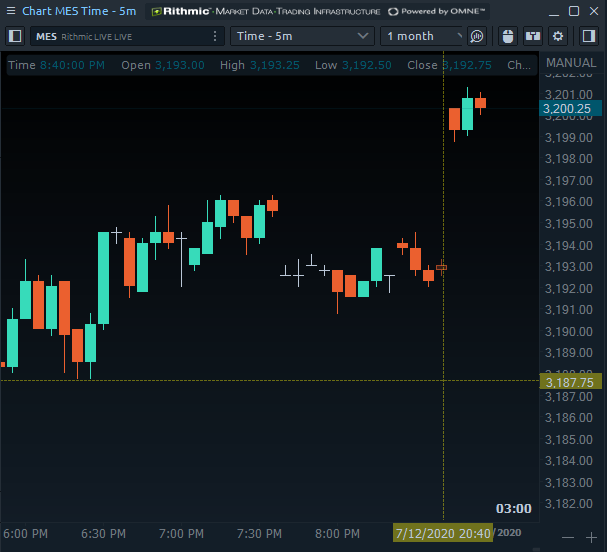
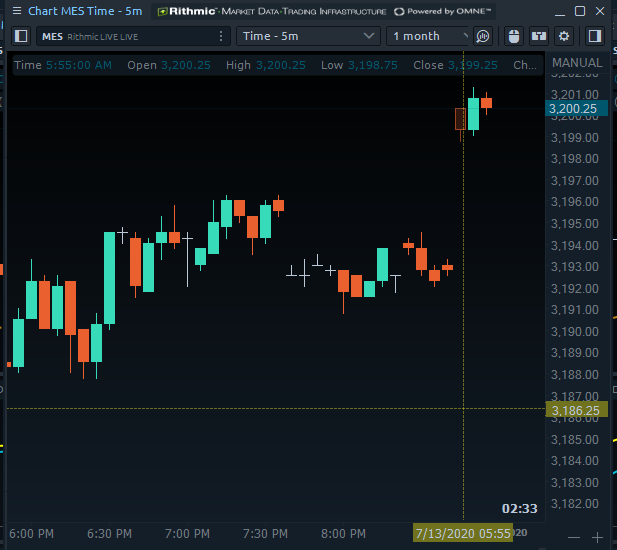
I’m not sure if this is a Rithmic or OptimusFlow issue. This morning, for MES, some chart timeframes have a time gap from 20:40 to 05:55. If I choose any other time like 4 minute, all the data appears normally. Same thing happens on the Cluster chart.
Thanks for bringing this to our attention. Quite a few of our live traders reported issues to us this morning in regards to Rithmic data on Charts. This was actually a Rithmic data issue that extended across multiple platforms.
Apparently, there was an issue with their charting server which resulted in time gaps and incomplete data, but this has apparently now been resolved.
If you are still having issues, please Right Click your chart > Reload History (server).
Keep us updated on this if issues persist!
Also:
Thanks for mentioning template issues on DOMs as well. We will bring this to the attention of our developers.
Thanks,
Jake
Optimus Futures Support
[(800) 771-6748]
Disclaimer: Trading futures and options involves substantial risk of loss and is not suitable for all investors. Past performance is not necessarily indicative of future results. You should therefore carefully consider whether such trading is suitable for you in light of your financial condition.
For Rithmic, allow connections to an account that has order routing but no market data. Currently, if the Rithmic account does not have market data, Optimus Flow will not connect.
Thanks for bringing this to our attention and I believe this is on the software end, not Rithmic. Not many users have the same configuration as you (live accounts without market data). Have you successfully logged into other platforms with this same account?
Please allow us to address this with our developers!
Yes, it is working well with data from IQFeed and placing orders over Rithmic.
Trailing limit orders aren’t working (trailing stops are) but I’m not sure if this is a general bug or directly related to this configuration. I’ll keep you updated.
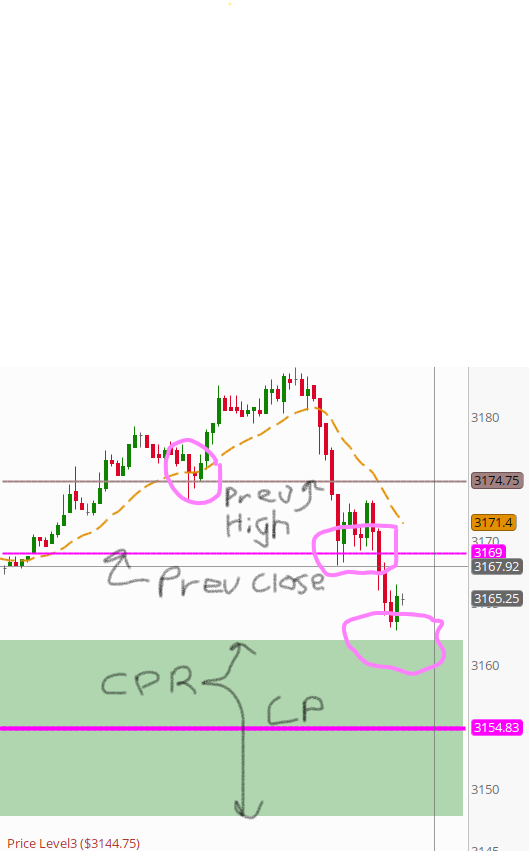
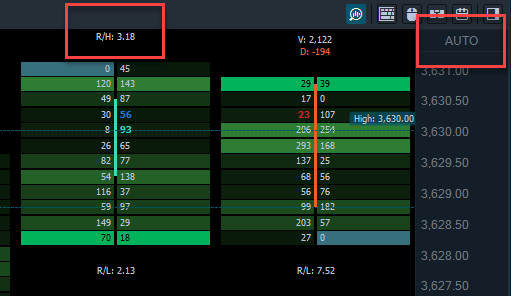
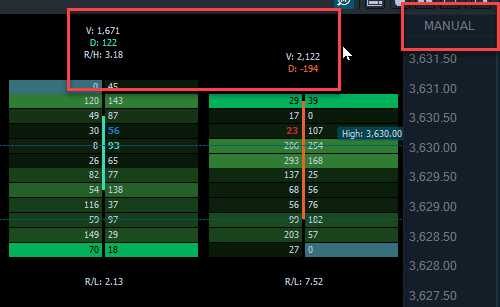
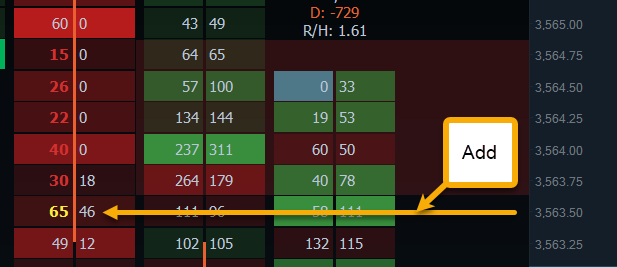
On the Imbalance cluster chart type, the text above the bar for Volume, Delta, R/H etc. is off the top and bottom of the screen for bar(s) that hit the edges. Would it be possible to bring those back into the visible chart area?
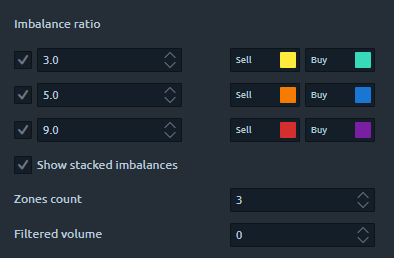
For Cluster -> Imbalance Ratio : Multiple Ratios Checked
Currently, a zone is shown on the chart only for matching colors. If one imbalance color is in or next to another color and they total the Zones Count collectively but not each individual color, no zone is displayed on the chart.
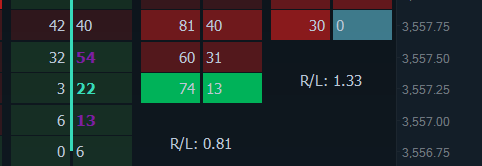
This actually would have helped me exit a trade because a price dropped down and entered what would have been a strong buy imbalance support. Pics below hopefully illustrate what I would like.
Cluster settings Note colors.
Note buy imbalance Purple, Cyan, Purple. No region was shown.
What I would like is a cyan region shown on the chart since 3.0 is encompassed in the two 9.0 imbalances. Even better would be each colors lines show but that might be confusing.
(This is the exit I mentioned. I got out at $3558.00 and had I known about the buy imbalance region, I may have held out for another 2-3 ticks).
Note 5 red imbalances shown above a yellow one but the yellow price was excluded from showing in the red region. Using above logic, the whole region would be yellow but that’s a little misleading. I’m really not sure how to do this one other than to show just the yellow region.
So, maybe a checkbox to paint varied color imbalances or a select box with choices None, Color of least imbalance, Color of greatest imbalance. Just a thought.
I really like this platform overall. I would like to see an option to change the sizes of the subwindows for the indicators. They take up a lot of real estate on the chart. I can manually resize them and have even updated the template after doing so but the next time I use the chart, it always reverts to the default size.
It would also be very helpful if the indicator and candle information located at the top of the chart (Open, Hi, Low, etc.) were larger and/or highlighted. This screenshot will be nearly illegible and that is the problem.
In Object Manager, it would be helpful to have the line you are working with highlighted. When going to clean up a chart, it would be quicker to do it from Object Manager than clicking on each individual line. I thought the magnifying glass icon, “Show on Chart” would highlight it on the chart. Most times it instead opens a blank chart at some random time interval.
Feature Request
-I would like to see a baseline chart type added as one of the chart options. Trading view has one but I am not a fan of their execution. Should this be considered and implemented, it would be incredibly useful to be able to set the baseline at your desired location, but for it remain anchored if you would like. Say for instance, the previous day’s close. With Tradingview you can set the baseline where you like, but once you begin to move the chart, especially if you have unlocked the price scale and can freely pan it, it no longer stays anchored to the desired location. It would be extremely useful for me to have this as an option as it would allow me to reduce the size of my market heatmap and therefore have more screen real estate for my general market overview panel/chart.
Feature Request
-I know that once you close stop the simulator, all of the trade data is gone and will reset when you start it back up. I would REALLY like to be able to at least have an option to retrieve the data from the previous session for journaling purposes. I had to force quit most applications on my computer earlier today, including Optimus Flow. I was not able to export any trade data and I have now lost the entire day’s worth of data.