Hi,
I was wondering if someone here knows how to setup a volume by price histogram that can be displayed on the left side of a chart?
Ayy
Hi,
I was wondering if someone here knows how to setup a volume by price histogram that can be displayed on the left side of a chart?
Ayy
Sierra Chart gets very in-depth with their price volume histogram. There are nearly endless customization options in which trades can mix and match settings to give them their ideal histogram.
For this reason I won’t go into too much depth on the settings you should select for your own histogram, each trader may need to utilize different histogram settings to achieve their desired goal.
To apply a price volume histogram to a chart:
1. Open the chart of your choice.
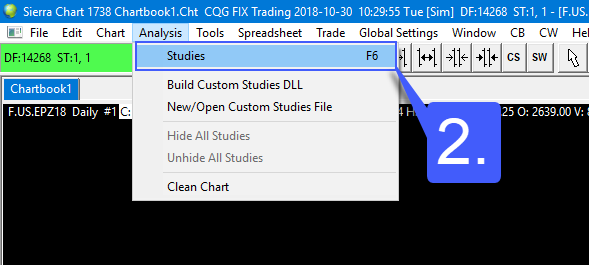
2. With the chart open, click on Analysis > Studies
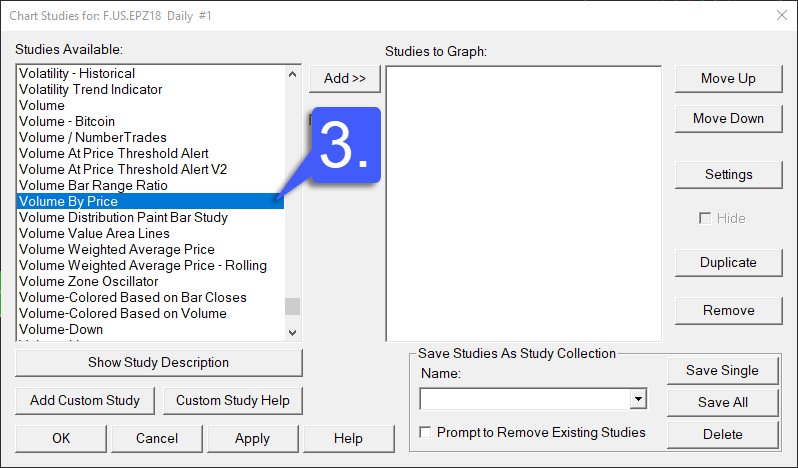
3. Studies are listed in alphabetical order. Scroll down to the V’s and select the Volume By Price study. Click the Add>> button and then settings.
4. From this point on the method will differentiate. The available settings can be used to highly manipulate and customize the Volume By Price study. I won’t go into detail here because each trader may need different settings for their own uses, but I will include documentation from Sierra Chart that may be able to assist you in finding the perfect setup for you: Sierra Chart
5. Once all settings have been entered appropriately, left click OK > Apply > OK. This will then apply the volume by price study to your chart.
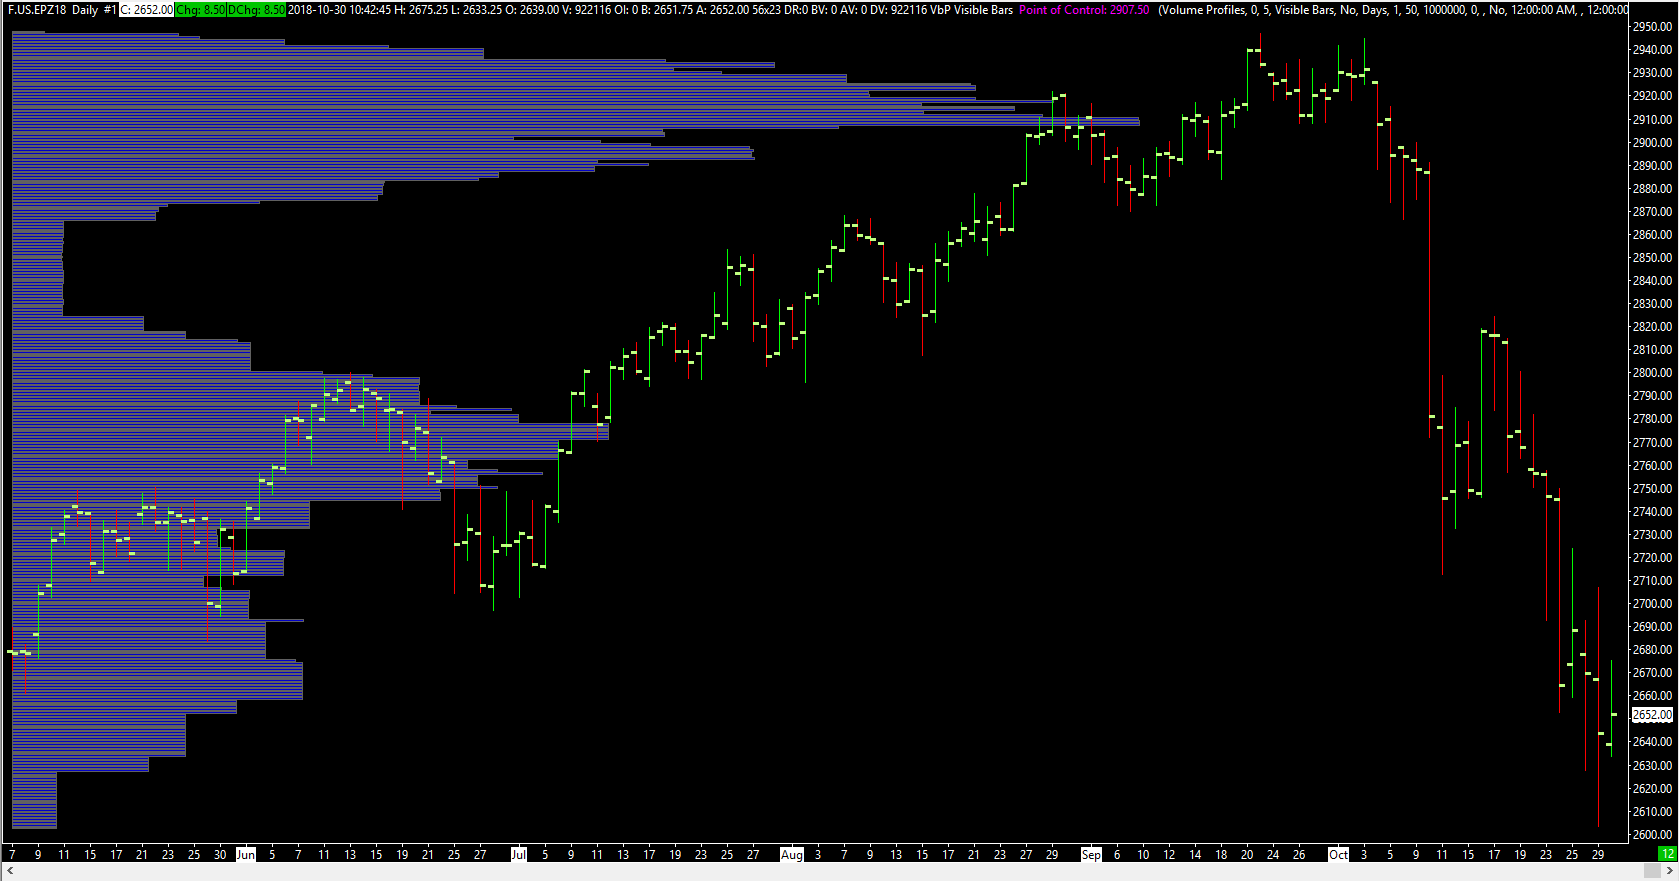
Below is an example of the default Volume By Price Study applied to a historical chart for the ESZ18.
Take a look at the Sierra Chart link I provided for various end results of how you can customize this study. There are tons of variations that can be made to create drastically different price volume histograms, technically and aesthetically speaking.
Let me know if you still have questions!
Jake
Optimus Futures Support
(800) 771-6748
Thank!
There are so many tools in Sierra Chart for futures traders I guess I missed that when I went through all the indicators. You are right about all the options it will take awhile to try all the different configurations.
I was looking at this tool to help identify supply and demand zones. Are there more tools In Sierra Chart for this purpose?
To my knowledge there are no default studies or indicators that directly implement supply and demand zones.
However, you may be able to replicate similar results using cumulative delta bars: Help topic 71: Cumulative AskVolume and BidVolume Difference Bars (Cumulative Delta) - Sierra Chart.
This study may not replicate exact results, but it may be possible to achieve something somewhat similar to your desired product although it might require tweaking the settings a bit.
Let me know if cumulative delta bars help at all, I am curious to see what the final result!