S&P 500 Futures Market Outlook - Trends and Levels ES MES

Here’s my analysis on the S & P for this coming week and the areas I’ll be watching order flow to enter my trades.

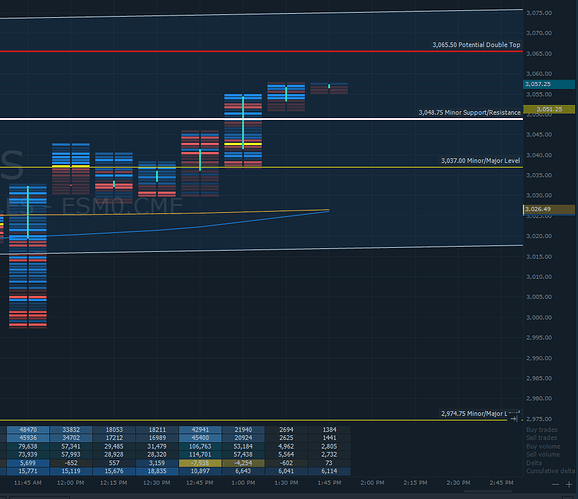
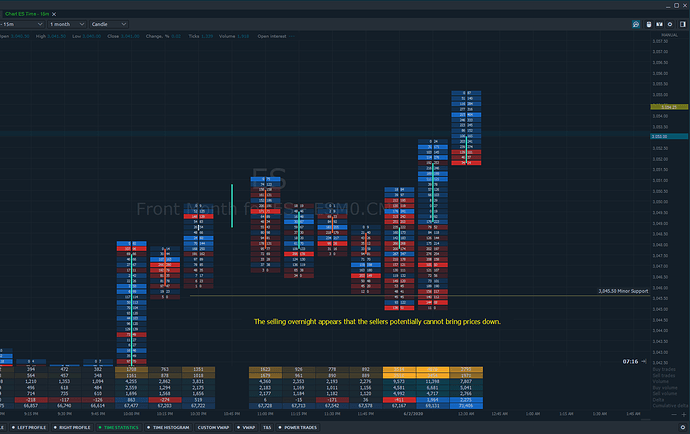
Since 5/15 we’ve been in a steady uptrend, currently trading above the 200 and 50 day moving average. Recent high is 3065.50 with minor support at 3048.75 and 3037.00.

It it trades sideways until Tuesday it will hit the bottom support of the uptrend channel at 3037.00.

There’s very minor support at 3054.75 which I don’t expect to hold but will be watching order flow at that level.

On the 15 min bar in the last hours of trading Friday, cumulative delta went from 15,771 down to 6,114 despite prices increasing which tells me the market is still strong and overall sentiment is still long.

Economic numbers to watch here:

At every level I’ll be watching order flow and how the market is behaving at those levels, will be posting live updates accordingly.

Hourly Market Delta:

Futures and Options trading has large potential rewards, but also large potential risk. You must be aware of the risks and be willing to accept them in order to invest in the futures and options markets. Don’t trade with money you can’t afford to lose. This is neither a solicitation nor an offer to Buy/Sell futures or options. No representation is being made that any account will or is likely to achieve profits or losses similar to those discussed on this web site. The past performance of any trading system or methodology is not necessarily indicative of future results.

3 Likes

6/1

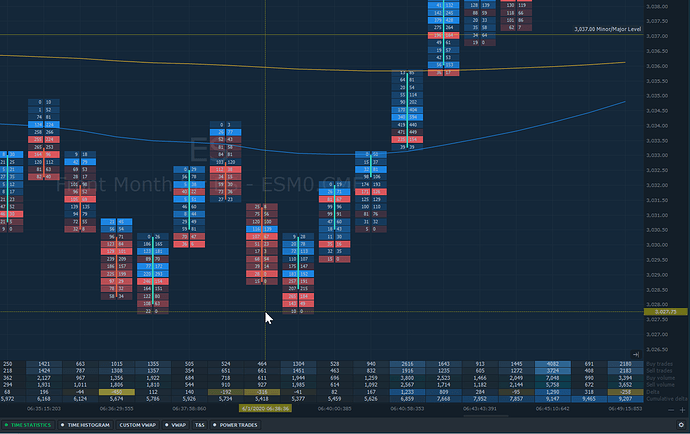
Market opened trading down and tested the 200 day MA on the 30 min chart then traded up and came back to create a double bottom at 3027.50.

On the cluster chart I changed the time frame to 10 ticks to see more detail on the buying and selling as the market was moving quick.

6:39 AM Pacific was the last time sellers had a chance to push it lower. The delta for that bar was -41 and there was some significant selling which could have provided an opportunity to take it lower. However, the multiple attempts failed and the market turned up to continue its uptrend.

1 Like

6/2 ES Mini Analysis:

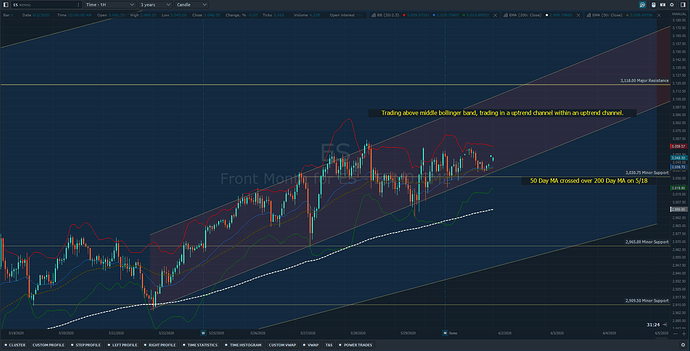
I’m liking the continued uptrend we are seeing. In my opinion, the uptrend seems to be steep, so I’m concerned about any breakouts below key levels may potentially lead the market down, potentially.

For potential long trades, I’ll be watch order flow at the middle bollinger band, 3030.75, the bottom of the bollinger band and just about the 200 Day MA.

Hourly:

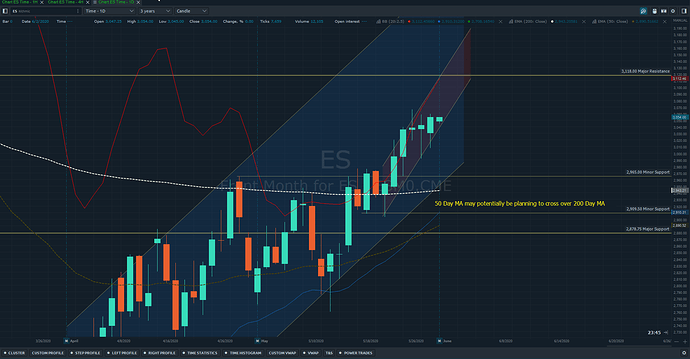
Daily:

It appears that the 50 Day MA may potentially be crossing over the 200 Day MA, which may potentially bring in new buyers.

All opinions, trades and analysis is only my perception of the market and my hypothesis of where the market may POTENTIALLY go. It is not to be taken as investment advice or recommendations to place any trade. Investing in financial markets is risky and may result in losses.

Futures and Options trading has large potential rewards, but also large potential risk. You must be aware of the risks and be willing to accept them in order to invest in the futures and options markets. Don’t trade with money you can’t afford to lose. This is neither a solicitation nor an offer to Buy/Sell futures or options. No representation is being made that any account will or is likely to achieve profits or losses similar to those discussed on this web site. The past performance of any trading system or methodology is not necessarily indicative of future results.

1 Like

On Monday, 6/8, I’ll be watching a few trends and levels that may potentially be key areas.

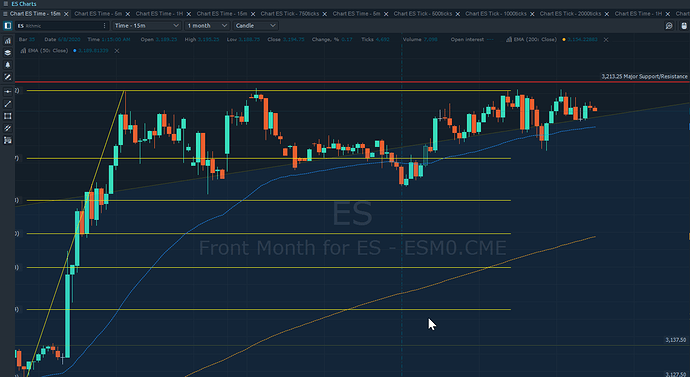
On 1/31/2020 and 2/24/2020 the market tested 3213.25 twice before the sharp sell off starting on 2/25/2020.

On Friday, 6/5/2020, the high was 3210.50 then it closed at 3185.25.

I’ll be watching for consolidation areas near recent support and resistance levels. Potentially at 3179.25, 3169.50 and 3159.75.

I’ll also be watching the 50 day MA along with recent resistance that got broken at 3127.50. Those prices may potentially be key levels to watch if the market continues its uptrend.

If the market reaches these levels, I’ll focus my attention to order flow and the cluster chart to gauge selling and buying interest.

2 Likes

Potentially forming a wedge pattern with major resistance at 3213.25 and support at 3204.74 as the upper price channel trend.

I’ll be watching how the market reacts at those levels to see if buyers can drive it up through resistance or sellers try to take it lower.

Commodity Futures Trading Commission. Futures and Options trading has large potential rewards, but also large potential risk. You must be aware of the risks and be willing to accept them in order to invest in the futures and options markets. Don’t trade with money you can’t afford to lose. This is neither a solicitation nor an offer to Buy/Sell futures or options. No representation is being made that any account will or is likely to achieve profits or losses similar to those discussed on this web site. The past performance of any trading system or methodology is not necessarily indicative of future results.

Here’s a video of my live trading session on 6/8/2020.

I took a long position after the upside breakout during a quick consolidation period.

I edited the video down to the key areas because the trade was about 30 mins.

My main focus was watching order flow on the DOM and also comparing that to the Market Delta and price action.

As the trade started to play out, there were a lot of sellers and selling was strong. However, there were buyers to back it up and absorb any selling action which prevented the price from going down.

At 2:55 in the video you can see a large trader hit the bid with 1000 lot and try to scare buyers into selling. @Mod-MattZ @Mod-JakeM

2 Likes

6/12/2020 Trading Day.

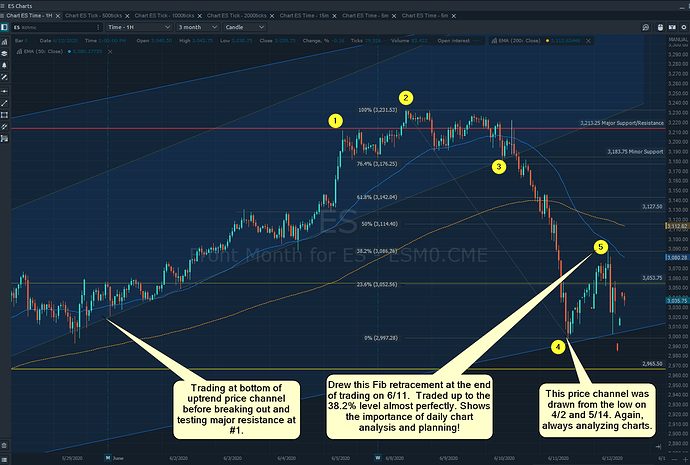
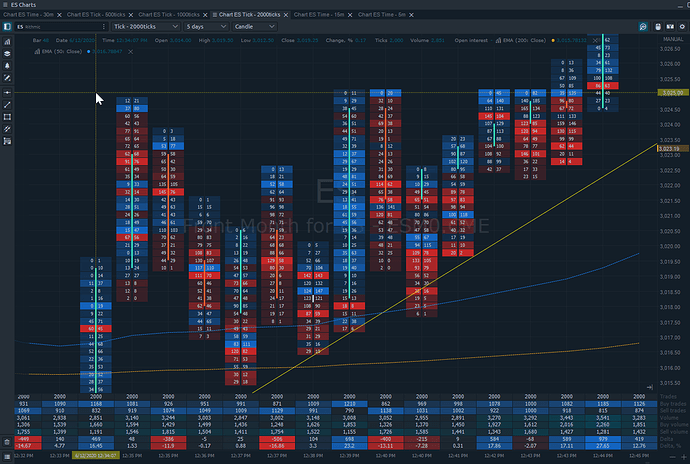
Wow. Talk about volatility. Here is my chart that I was watching throughout the day on Friday. This is an ongoing chart with many of the levels and trends drawn before the movement on Friday.

The first major point here is that constantly analyzing and marking up charts is essential in future trading. There’s so many things that play out and perfectly hit a resistance level or bottom channel price trend.

Always save your charts and don’t be afraid to mark them up with multiple levels.

The market was so volatile that the only way to really see what was going on was to reference the candle stick chart with my levels, but then switch over to the cluster chart to find entries.

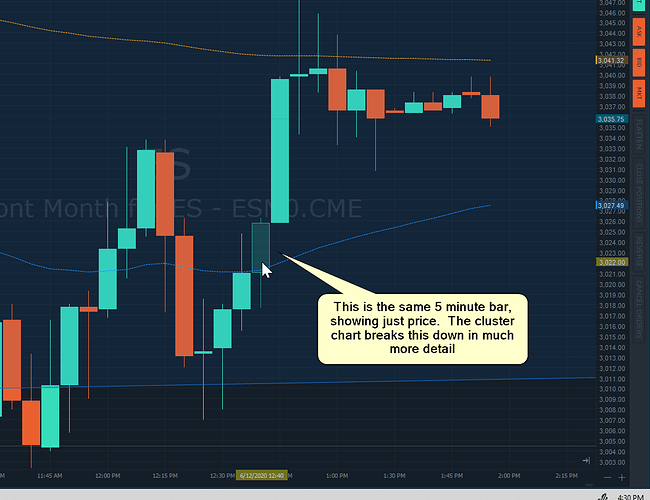
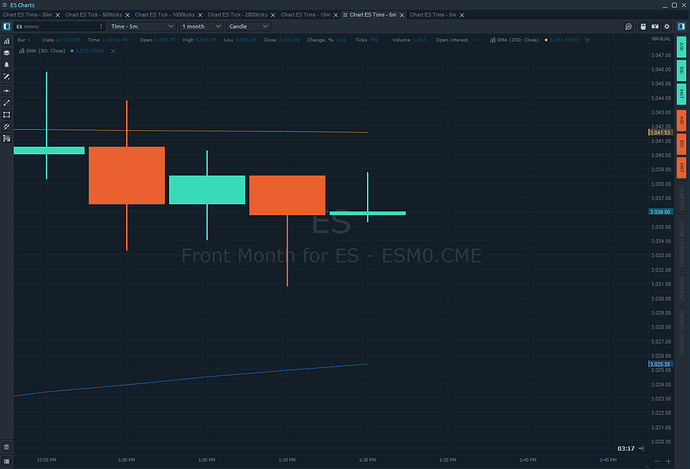
Below is the same area shown in 5 minute candle sticks.

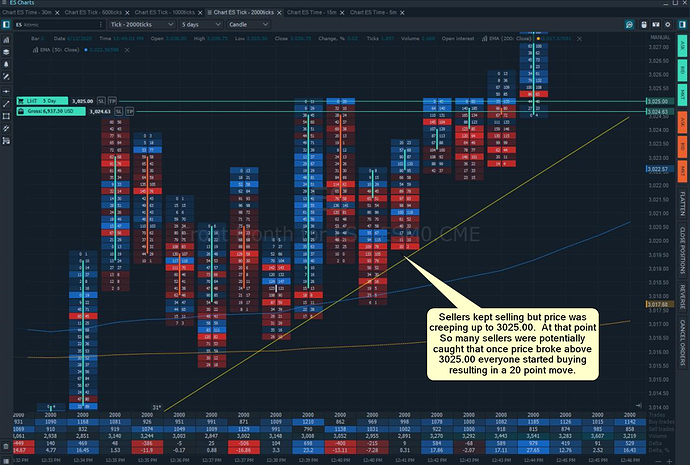
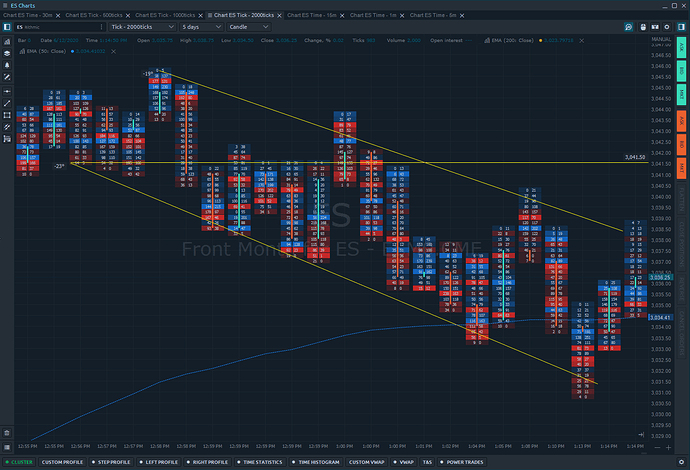
In the candle stick chart, it just shows an up bar. When it’s broken down in the cluster chart it not only shows a wedge pattern forming, but a wedge pattern where sellers are selling the lows and keep getting caught as their position slowly goes against them.

This is why cluster charts are a MUST. There’s no other way to see this kind of data. That along with watching the actual order flow on the ticket will provide a huge advantage compared to just looking at price charts.

Furthermore, during times like this wedge, you have to put yourself on both sides.

If you are long, what are you looking for to prove your trade right and prove it wrong? Same with being short, what things are you going to be looking at to validate your trade or disprove your trade.

Because of this, you can sit out of the market, analyze both scenarios and make a significantly more educated, data driven decision based on order flow.

While this was playing out, I kept watching and more importantly asking those questions. I got long at 3025.00, but I entered on the last 2000 tick bar at 12:43. The trade went against me by 2 ticks, and I exited at 3035.00.

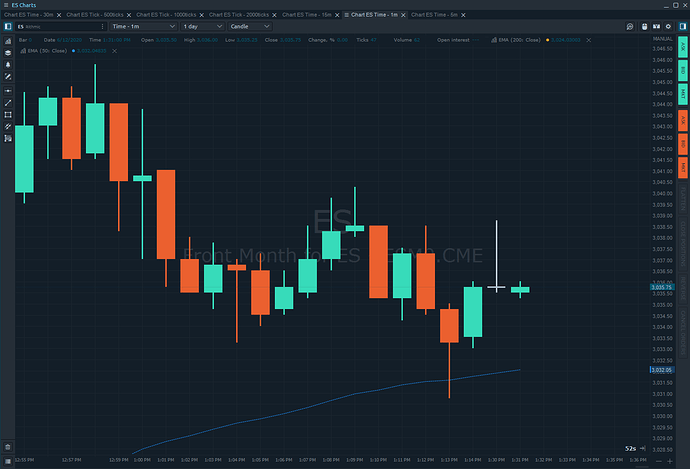
Virtually no risk ONLY because I was watching order flow. There’s no way I could have made this trade just watching candle sticks, even 1 minute sticks. They just don’t give you the full amount of information you need to perfect your entry and exits.

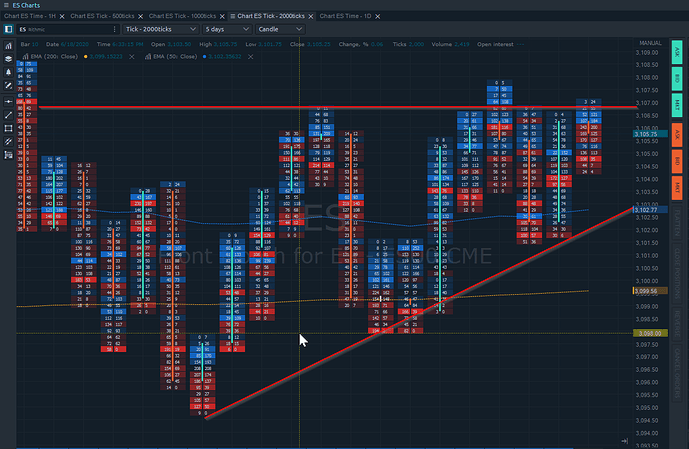
Here’s a few more examples of the same time frames showing the difference between candle sticks and cluster charts.

Risk Disclosure: Futures and forex trading contains substantial risk and is not for every investor. An investor could potentially lose all or more than the initial investment. Risk capital is money that can be lost without jeopardizing ones’ financial security or lifestyle. Only risk capital should be used for trading and only those with sufficient risk capital should consider trading. Past performance is not necessarily indicative of future results.

Hypothetical Performance Disclosure: Hypothetical performance results have many inherent limitations, some of which are described herein. No representation is being made that any account will or is likely to achieve profits or losses similar to those shown; in fact, there are frequently sharp differences between hypothetical performance results and the actual results subsequently achieved by any particular trading program. One of the limitations of hypothetical performance results is that they are generally prepared with the benefit of hindsight. In addition, hypothetical trading does not involve financial risk, and no hypothetical trading record can completely account for the impact of financial risk of actual trading. For example, the ability to withstand losses or to adhere to a particular trading program in spite of trading losses are material points which can also adversely affect actual trading results. There are numerous other factors related to the markets in general or to the implementation of any specific trading program which cannot be fully accounted for in the preparation of hypothetical performance results and all which can adversely affect trading results.

Trade Results Disclosure: All trades presented are not traded in a live account and should be considered hypothetical.

Commodity Futures Trading Commission. Futures and Options trading has large potential rewards, but also large potential risk. You must be aware of the risks and be willing to accept them in order to invest in the futures and options markets. Don’t trade with money you can’t afford to lose. This is neither a solicitation nor an offer to Buy/Sell futures or options. No representation is being made that any account will or is likely to achieve profits or losses similar to those discussed on this web site. The past performance of any trading system or methodology is not necessarily indicative of future results.

1 Like

Prep and adapt.

When the market changes, it changes, especially with today’s volatility. You have to be ready for anything and plan more than you execute. Plan for the upside, plan for the downside.

Right now it’s 11:03 PM Pacific, I started my prep around 1:00 PM today. Went through blogs (tradingview.com), looked at charts, news, etc.

With price going wild on Friday, the market still opened only slightly below the bottom uptrend channel. Could have easily closed the gap. That’s an EASY long mindset.

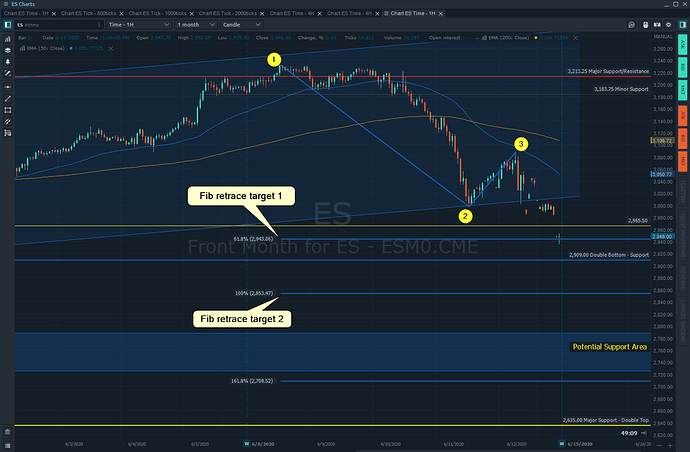
What’s difficult, is going against your hunch or intuition and trying to prove yourself wrong. So I said, what if it does go lower, what if I’m wrong. So I started with a fib extension drawing showing me levels of where it may go to.

Then I went back on the hourly and 4 hour chart to find significant levels to watch.

There were some great opportunities, but to really analyze order flow prices need to be a bit deeper. More on that to come tomorrow…

1 Like

6/17/2020

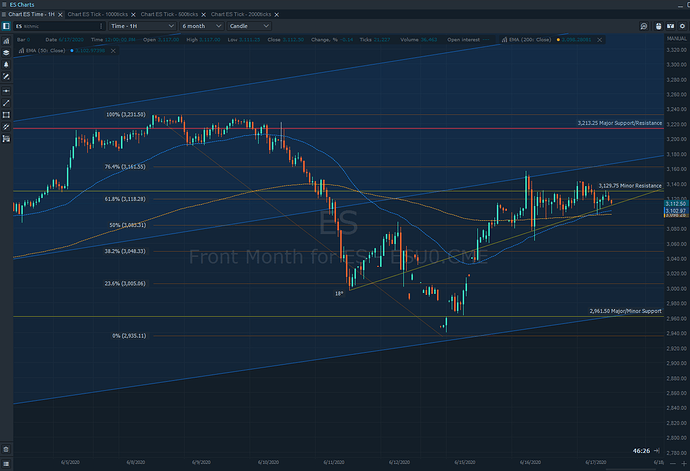
Potentially a nice wedge forming on the hourly charts.

*There is a substantial risk of loss in futures trading. Past performance is not indicative of future results. The figures here represent an opinion.

There is a substantial risk of loss in futures trading. Past performance is not indicative of future results. The figures here represent an opinion. The placement of contingent orders by you or broker, or trading advisor, such as a “stop-loss” or “stop-limit” order, will not necessarily limit your losses to the intended amounts, since market conditions may make it impossible to execute such orders. Please conduct your own due diligence if Futures are an appropriate instrument for you.
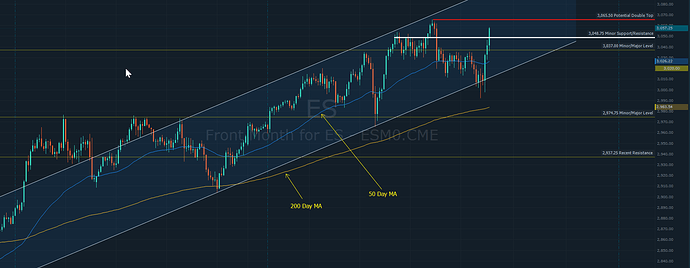
Not to mention the 50 day MA just crossing over the 200 MA.

From the large down move it’s trading just under the 61.8% Fib Retrace level.

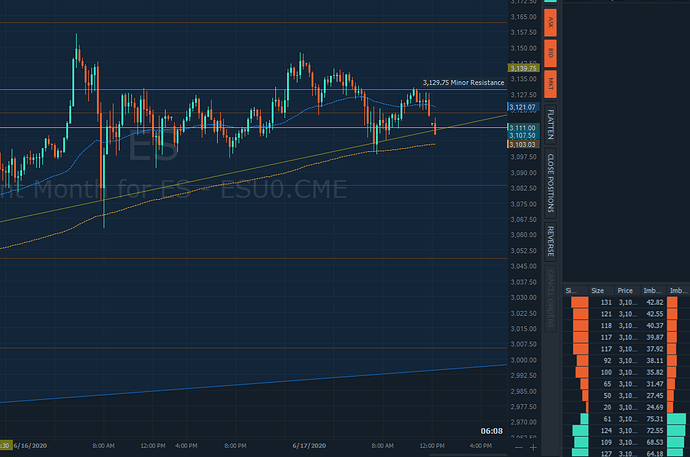
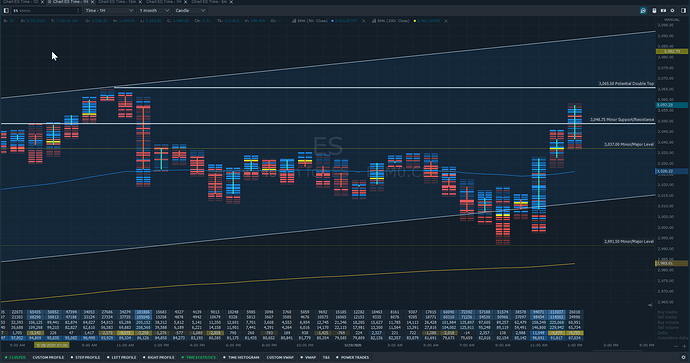
Price is coming down out of the wedge more than I thought, but there were a few other spikes down as you can see on the 15 minute chart.

There is a substantial risk of loss in futures trading. Past performance is not indicative of future results. The figures here represent an opinion.

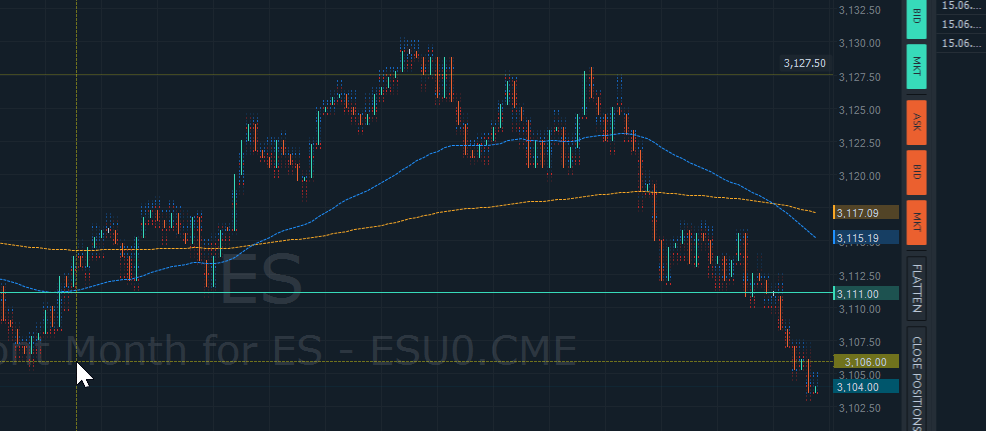
Just passed below a bottom on the 2000 tick cluster chart.

There is a substantial risk of loss in futures trading. Past performance is not indicative of future results. The figures here represent an opinion. The placement of contingent orders by you or broker, or trading advisor, such as a “stop-loss” or “stop-limit” order, will not necessarily limit your losses to the intended amounts, since market conditions may make it impossible to execute such orders. Please conduct your own due diligence if Futures are an appropriate instrument for you.
1 Like

Prep for 6-18.

There’s a lot going on in this chart and also tomorrow.

Initial jobless claims
Jobless claims 4 week average
Continued jobless claims
Philly fed
Lots of commodities numbers as well

So lots to be on the lookout for.

There is a substantial risk of loss in futures trading. Past performance is not indicative of future results. The figures here represent an opinion. The placement of contingent orders by you or broker, or trading advisor, such as a “stop-loss” or “stop-limit” order, will not necessarily limit your losses to the intended amounts, since market conditions may make it impossible to execute such orders. Please conduct your own due diligence if Futures are an appropriate instrument for you.
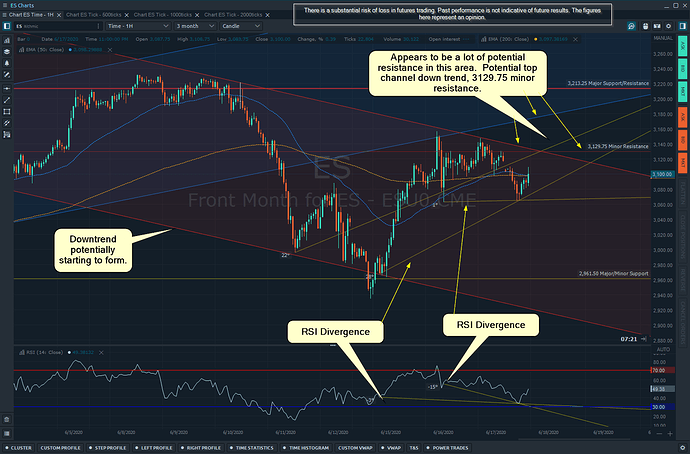
A few things to note on this chart. There two RSI divergences happening. One is slightly negative on RSI while very positive on price, the other is more negative on RSI and less on price.

It appears that a potential downtrend may be forming after today’s movement. This potentially could lead price up to some key resistance levels where I’ll be watching order flow and cluster charts to analyze my entries.

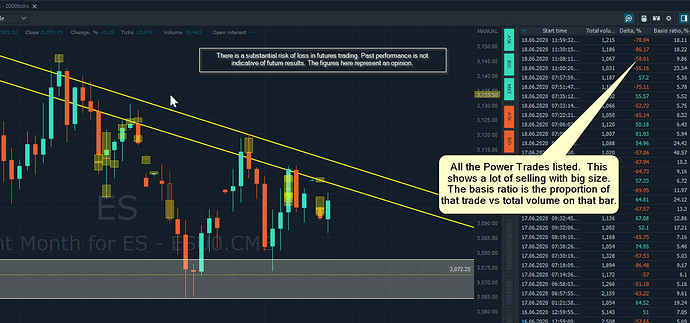
Tomorrow I’ll be posting charts with “Power Trades” which are large amounts of volume in a short period of time. I usually have it set on at least 800 contracts within 3 seconds. Those will show up in yellow boxes that I’ll point out.

2 Likes

As mentioned last night, here are some updated charts on what is happening in the markets today.

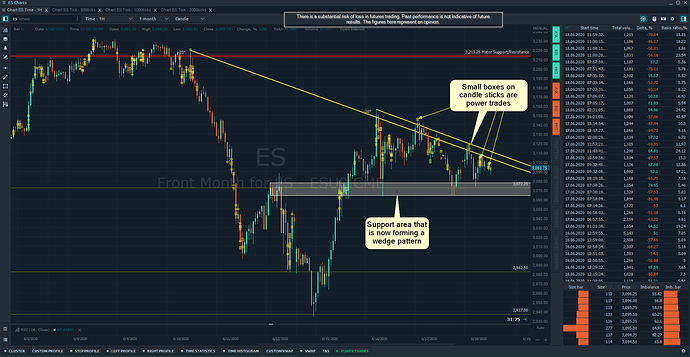
It seems price is not breaking above the two downtrend lines while staying above support at 3072.25.

Normally, this is all you have to work with. You see where it goes and what happens. But we have something that others don’t.

Power Trades!

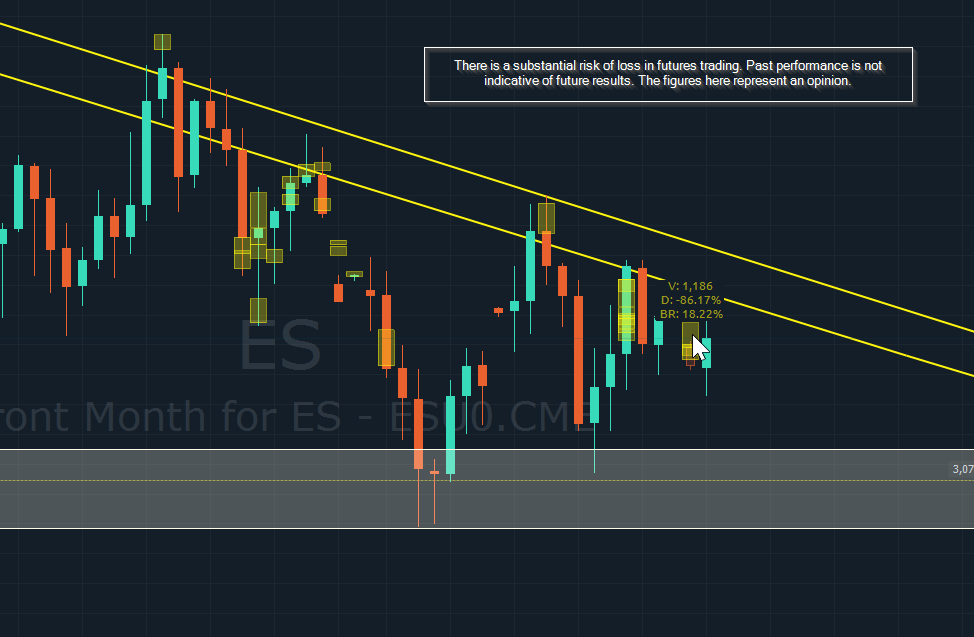
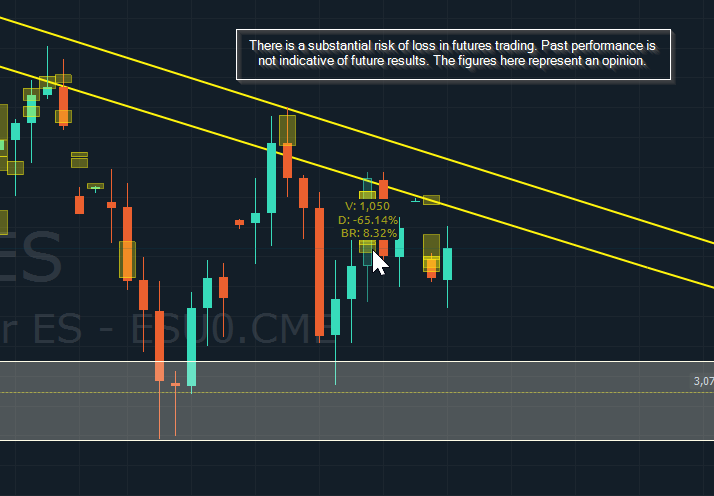
Power trades are areas of large volume in a certain time period. I have mine set to 1000 contracts within 3 seconds.

Take a closer look.

Watching the support level and how sellers and buyers are reacting may potentially give an indicator on where this goes.

There is a substantial risk of loss in futures trading. Past performance is not indicative of future results. The figures here represent an opinion. The placement of contingent orders by you or broker, or trading advisor, such as a “stop-loss” or “stop-limit” order, will not necessarily limit your losses to the intended amounts, since market conditions may make it impossible to execute such orders. Please conduct your own due diligence if Futures are an appropriate instrument for you.
1 Like

Pattern Recognition.

With anything we do, there’s always a snap judgement decision made behind the scenes in our subconscious. Trading is trading, there are charts and indicators and patterns, feelings, etc, etc, etc. The list goes on forever.

But behind all those things is one thing. Human emotion. The markets move from buying and selling. That’s it. They don’t move because moving averages cross over or it’s trading outside the top bollinger band.

Those might be things that people look at to create a trade idea, but it’s not the main reason. This is why so many times you see something so obvious and say “there’s no way it can break this support with the current uptrend”. Then it breaks it out of all logic and reasoning, trades back up, then down, sideways, and finally up. Or maybe down for that matter.

Just like people, markets are sometimes irrational, frustrating, hopeful, predictable, unpredictable and all the other emotions humans have.

So how do you break through this? How do you not get reversed so many times and carried away like a leaf floating in a fast moving current with no direction.

You get out. Get out and watch. Watch for hours every day and do that for a year. Don’t try to explain anything or prove anything, just observe.

When you don’t have a bias or a position in the market you can start to see patterns that you can pick up on. You may not be able to explain these though.

But don’t you have to “know” why things happen? Shouldn’t you be able to explain why the market did what it did?

Yes and No I say. Take Vic Braden for instance. He was a professional tennis player for year then coached and counseled tennis players. In his seventies, he started to notice something odd.

When a player was serving and faulted, they get a second serve. He started to notice that he could predict, before they even hit the ball, if they would double fault. In some matches he could accurately predicted 16 out of 17 double faults. Sometimes he was getting 20 out of 20 right. Despite his efforts to look for indicators, the player stumbling or being off balance, he could not explain how he could do this with such accuracy. (Came from the book Blink by Malcolm Gladwell - Highly recommended).

He was taking small slices of information and making a decision based on that in a split second. We all have this ability.

Telling if a car is going to run a red light, if we like someone within 30 seconds of meeting them, etc.

So how does this intertwine with trading? Well first I’d say if you’re struggling, sit on the sidelines for a bit and just observe. Not only the markets but also your feeling or gut instinct.

Ask yourself:

  1. If I was a buyer why would I buy right now? Same with selling.
  2. If I was long or short, what would I want to see? What would I NOT want to see?
  3. What’s the market doing? Literally say it out loud. “It’s going up fast and there are small consolidation periods with little down movement”. “It’s trading in a channel”. “It’s moving down quickly”.

While there are patterns that you may not be able to make tangible but they work for you, great, use them.

If you have a hunch, use the best tool that you understand the most and that makes the sense to YOU. Everyone processes information differently.

For anyone who plays chess a lot, you’re probably like me. I have to have a certain board or type of set that I can see best. I don’t like modern boards because it takes longer for me to tell the difference between the pieces.

Like this:

This looks like a collection of different vases from 2045. Beautiful, but doesn’t make sense to me.

Chess is a game of perfection information, meaning both players have the exact same information at their disposal. However, as with chess boards, the way that players interpret that information varies greatly depending on multiple factors.

My setup and charts make sense to me and they also allow some tangibility in terms of explaining or justifying an idea. This took a lot of time of trial and error.

For the intangible pattern recognition, that’s my Order Entry ticket.

Watch this and just observe. Write down or just say what you see.

When I was watching this, I saw someone buy 157 lots on the low side of the channel. Before it broke up a point I saw someone sell 29 lots into the bid. I saw lots of trading back and forth. I saw some bold trades.

Then you start asking yourself what you would do if you were that trader, like mentioned above.

If you watched that for months and months, for short term trades you wouldn’t even need a chart (not recommended just trying to emphasize a point). This is why markets move.

The tangible side of this is Cluster Charts. It records everything and you can see any imbalance or bias.

I saw a pattern form that I liked and made a trade from it. A few days later, I saw the same pattern form, made the same trade. Same result.

There is a substantial risk of loss in futures trading. Past performance is not indicative of future results. The figures here represent an opinion.

That happened on the 12th. Here’s a screenshot from the 18th:

Not as noticeable on the second one, but the same mechanics were present.

What do you see here?

If you were long do you like what you see? How about if you’re short?

If you have questions about this chart I’d love to answer them. It’s my go to.

There is a substantial risk of loss in futures trading. Past performance is not indicative of future results. The figures here represent an opinion. The placement of contingent orders by you or broker, or trading advisor, such as a “stop-loss” or “stop-limit” order, will not necessarily limit your losses to the intended amounts, since market conditions may make it impossible to execute such orders. Please conduct your own due diligence if Futures are an appropriate instrument for you.
1 Like

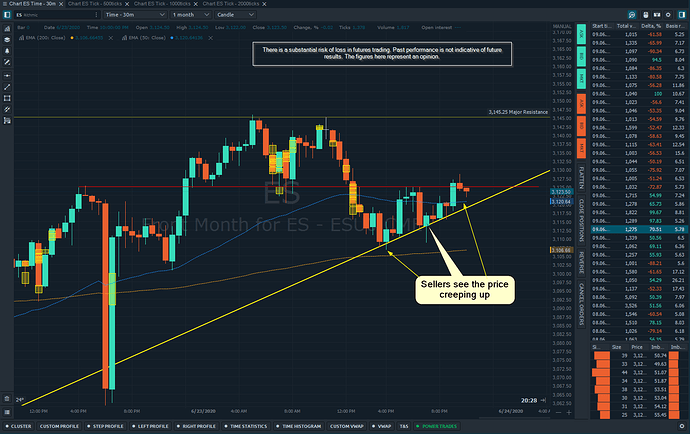
Adding to the topic of pattern recognition, another of the same pattern for me came up tonight:

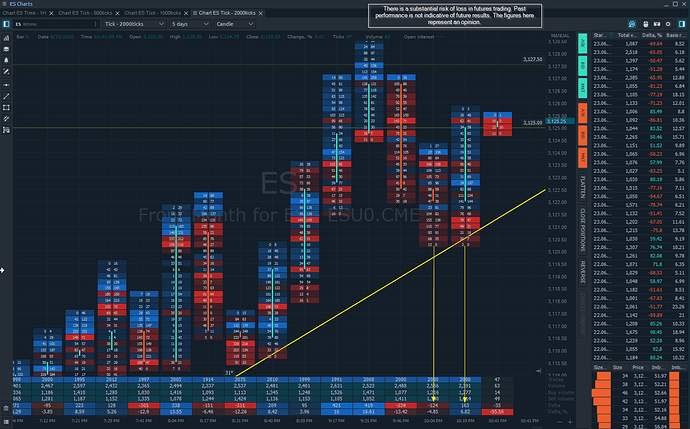
So we can see that line plays a significant role there. But how do we tell what people were doing on that uptrend support?

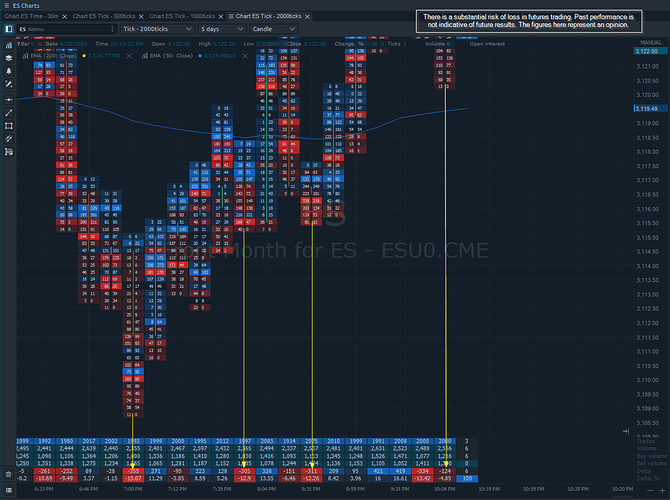
Cluster Chart.

There’s a few things going on here:

  1. On every significant price move down, selling is not increasing. They are all about -320 Delta (shown with the arrows).
  2. On the last significant down move, the Delta was only at -124. So less selling on the down moves.
  3. Despite heavy selling on the down moves, we see higher lows and higher highs.

Instead of quickly choosing a position, let’s ask ourselves the questions in the previous post.

  1. If I was a seller where is my exit? What do I want to see, what don’t I want to see.

I’d answer that as:

  • My exit is when it breaks the most significant resistance.

  • I want to see lower lows and buyers start to dry up.

  • I don’t want to see price continuing to go up and I don’t want to see reduced selling over time.

Do the same with a buyer persona and really think, but more importantly feel, how it is to be a buyer right now.

What emotions or gust instincts do you feel, what’s your gut say?

And then, you pick a spot and a direction and then leave it… NO!

You start trying to see if you can disprove the trade. Let’s say you’re a buyer. What is going to show you your trade is wrong? What’s your target? Why is that your target? Does it make sense for other people to think of that as a target where they might start selling or exiting the position?

Always asking, always debating and always be flexible. It’s easy to fall into the trap of stubbornness. You’re long and you have to believe it and commit. Maybe, sometimes you need to. But not in all cases.

That’s why you keep asking and asking and be your own devil’s advocate. Within reason of course, we don’t want to argue ourselves out of every trade. What we want is to be able to articulate the technical and fundamental reasons you got in the trade. Then trust your gut, which remember no one can explain fully.

So now, another 2000 tick bar formed:

Next bar it didn’t make new lows and there were actually more buyers on that bar.

As a seller are you happy? Is that what you wanted to see? What about as a buyer?

None the less, same patterns show up all the time. The key is to dive into Cluster Charts and see what the people are doing.

There is a substantial risk of loss in futures trading. Past performance is not indicative of future results. The figures here represent an opinion. The placement of contingent orders by you or broker, or trading advisor, such as a “stop-loss” or “stop-limit” order, will not necessarily limit your losses to the intended amounts, since market conditions may make it impossible to execute such orders. Please conduct your own due diligence if Futures are an appropriate instrument for you.
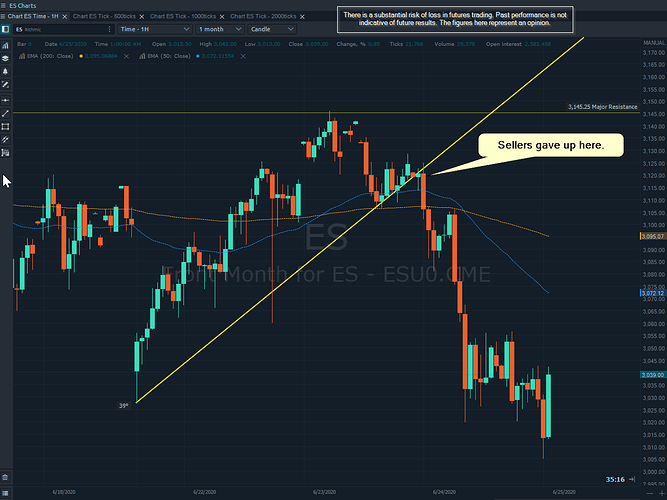
6/24/2020

As we were watching that wedge pattern form on the last post, we said there’s a point where it will have to give. Depending on who wins? That’s the path of least resistance. If there are less sellers, sellers that don’t have a conviction on their decision, etc, they could turn to buyers along with the other buyers, taking the market up.

In this chart, you’ll see where it finally broke down through that support line.

We saw that moving up along the line on Monday.

I’ll have the cluster charts up tomorrow morning so we can see exactly what happened and when.

1 Like

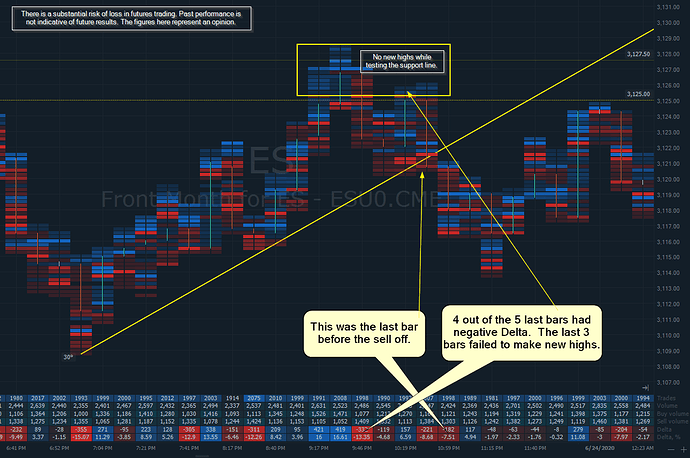
Here’s the cluster chart of that same move.

There were fewer and fewer buyers near the sell off. Additionally the price failed to make new highs.

As a buyer, the failure to make new highs would be an indicator by itself. However, it’s extremely relieving to also see what buyers and sellers are doing. If I was long here and started to see this I would not like the feeling it gave me.

Being short you can see people “on your side” or pushing to sell it and move price down.

1 Like

Always keeping my charts up to date. I mentioned this a few weeks ago but wanted to remind myself that it’s crucial to having your “feelers” on the market.

Here’s my look at the hourly charts:

There is a substantial risk of loss in futures trading. Past performance is not indicative of future results. The figures here represent an opinion.

Perfect, we have our levels, key price levels and hopefully an overall sentiment of market. Watch an indicator to cross over then make our trade right?

No! We have MORE information we can get into. Information that you should always study and consider before you think about trading.

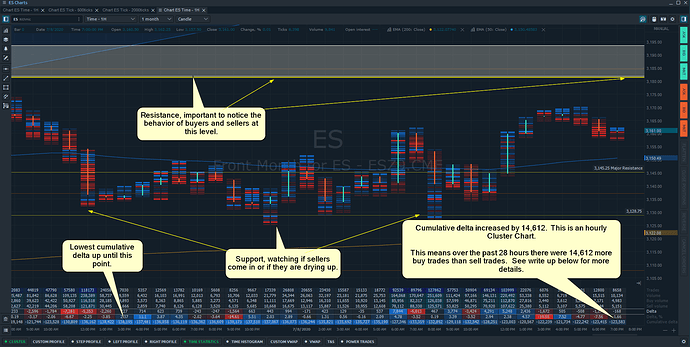
Order flow. By opening a cluster chart for the same time frame, we can see what buyers and sellers are doing every step of the moment.

There is a substantial risk of loss in futures trading. Past performance is not indicative of future results. The figures here represent an opinion.

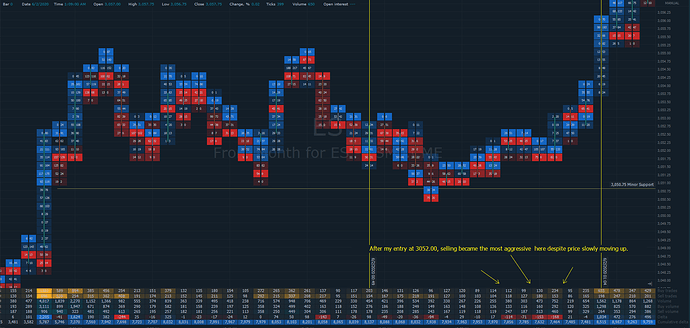
If you look at the cumulative delta at 3:00 PM on 7/7 it’s at -138,858. Don’t get too caught up in this number. It can grow to extreme levels on either side. I’m more focused on what’s happening around these extremes.

So I look out to the current time, 7:00 PM 7/8. The cumulative delta has increased by 14,612. That means there were that many more buyers than sellers.

Why? I’ll save you the frustration of trying to answer that. You’ll never know. Could be banks, individuals or people covering short trades from the previous high of about 3,182.00.

But, we don’t need to know why, we just need to observe that’s what’s happening in the market during a consolidation period near key levels.

So we watch and observe how the players trade the lows and highs of that channel.

More information to make better decisions with your trades.

Happy trading!

There is a substantial risk of loss in futures trading. Past performance is not indicative of future results. The figures here represent an opinion. The placement of contingent orders by you or broker, or trading advisor, such as a “stop-loss” or “stop-limit” order, will not necessarily limit your losses to the intended amounts, since market conditions may make it impossible to execute such orders. Please conduct your own due diligence if Futures are an appropriate instrument for you.
1 Like

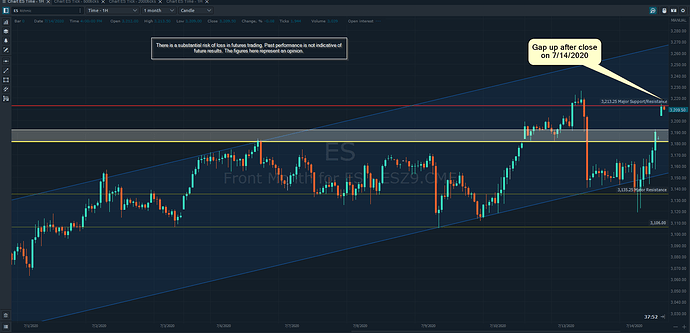
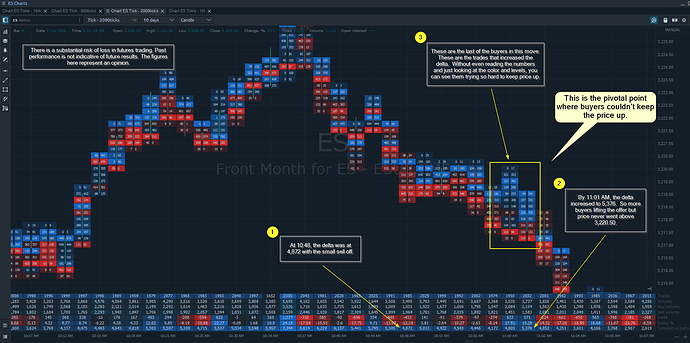
I’m seeing a lot of opinions whether or not the S & P is Bullish or Bearish. Pivotal times on any chart can be nerve racking. It’s hard to stay objective, which is why we try to gather as much information as possible before making a decision.

Here is an hourly chart after the close today (7/14/2020).

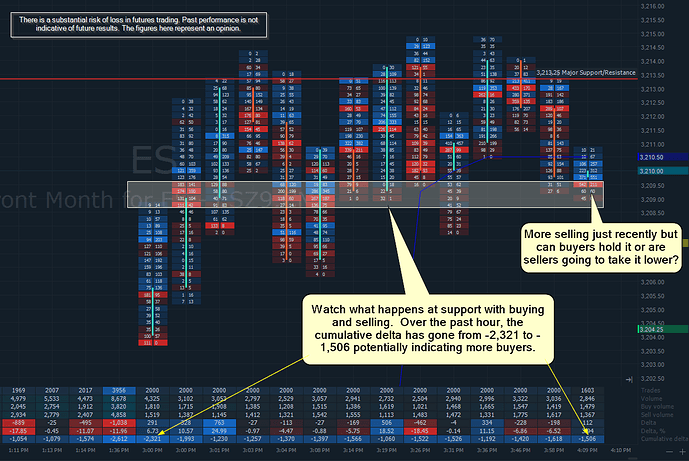
Now taking a look at the cluster chart on a 2000 tick time frame:

So this is saying there are potentially more buyers coming in. This may mean that they can take it up, or that despite there being more buyers, the sellers may be able to hold it and get a sell off. However it’s trading near key levels and this is where decisions are made.

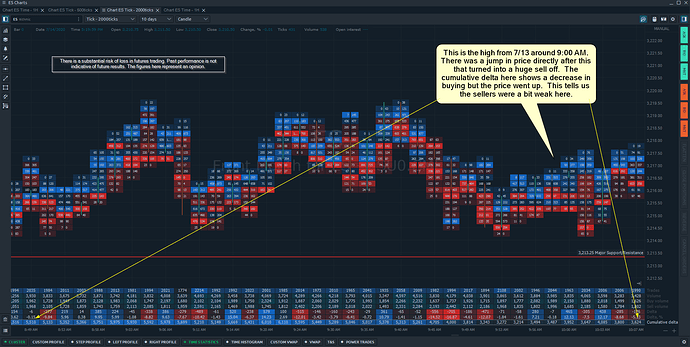
The next chart is taken from 7/13 around 9:00 AM. This was right before the spike then hard sell off. This section shows there were potentially more sellers during this time but the price spiked then sold off. Why? With this you have to keep looking forward in time (see second chart below).

Directly above you can see where the buyers are aggressively buying but the price doesn’t seem to be able to move up. In one of the previous posts, I say always ask yourself what you would want and not want to see if you were a buyer or a seller.

It puts it in perspective and hopefully provides a more objective look at the market.

There is a substantial risk of loss in futures trading. Past performance is not indicative of future results. The figures here represent an opinion. The placement of contingent orders by you or broker, or trading advisor, such as a “stop-loss” or “stop-limit” order, will not necessarily limit your losses to the intended amounts, since market conditions may make it impossible to execute such orders. Please conduct your own due diligence if Futures are an appropriate instrument for you.

2 Likes

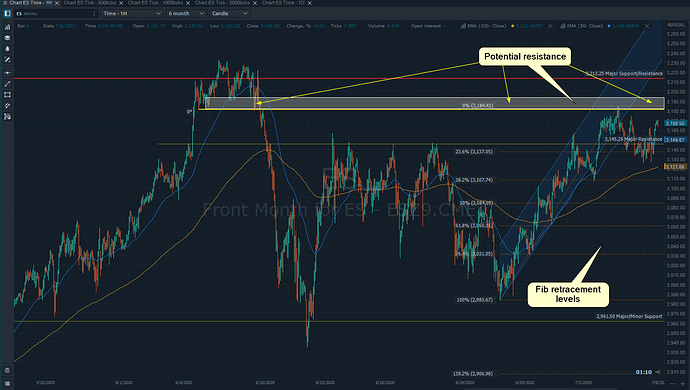
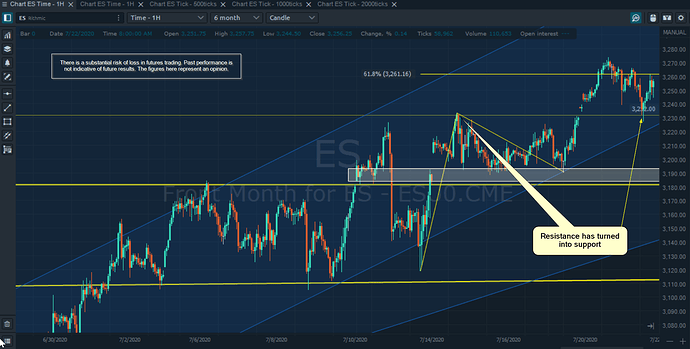
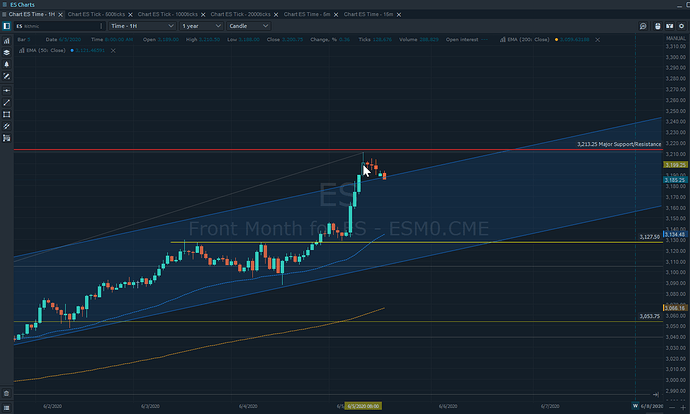
The ES Mini has continued to follow the rules of it’s current uptrend validated by breaking through resistance that turns into support.

There appears to be an upward price trend within the longer term price channel. From it’s last move up it respected the 61.8% Fib Extension then traded back down to previous resistance that is now support.

There’s potentially opportunity for continued upward momentum if buyers continue to validate and respect key levels.

Beware of price movement to the downside that could attract sellers for downside movement.

There is a substantial risk of loss in futures trading. Past performance is not indicative of future results. The figures here represent an opinion. The placement of contingent orders by you or broker, or trading advisor, such as a “stop-loss” or “stop-limit” order, will not necessarily limit your losses to the intended amounts, since market conditions may make it impossible to execute such orders. Please conduct your own due diligence if Futures are an appropriate instrument for you.
Optimus Flow

2 Likes

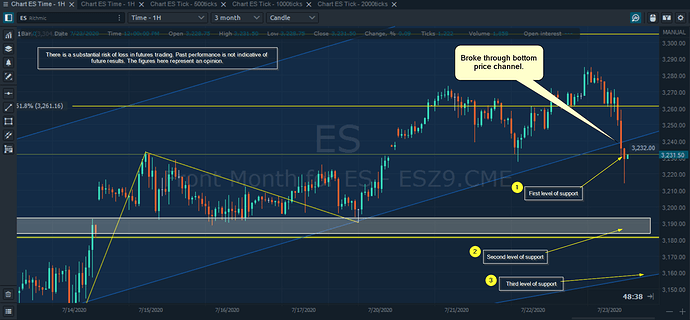
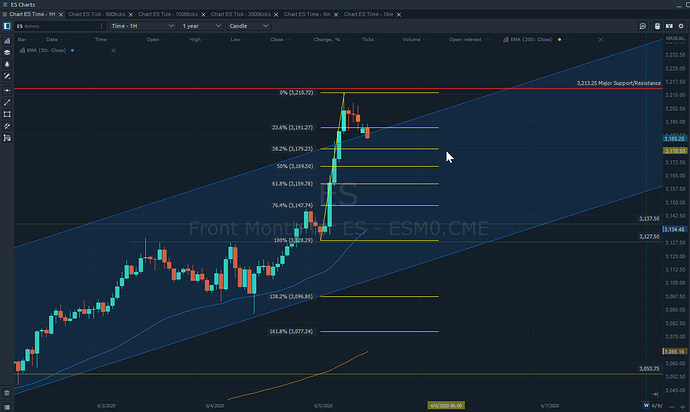
As we pointed out yesterday, the ES Mini was following an internal uptrend channel within a larger price channel.

Today price broke through the bottom of the internal price channel and appears to be testing the first level of support:

The uptrend has the potential to continue despite a possible short term pull back. Using the Fib Retracement & Extension tool may help shed light on potential levels while monitoring overall market sentiment.

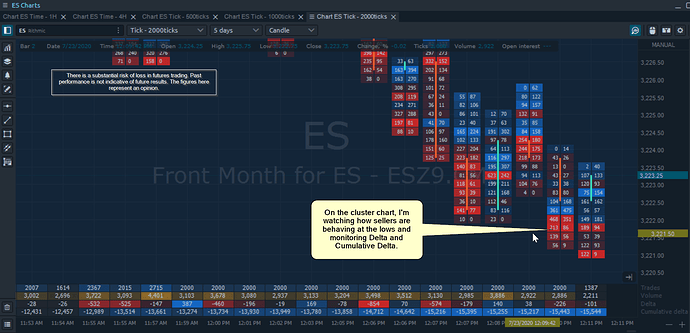
Moving to the cluster chart to see buying and selling, watch how sellers are interacting with the lows as it may potentially indicate their ability to push it lower or if buyers are absorbing their selling.

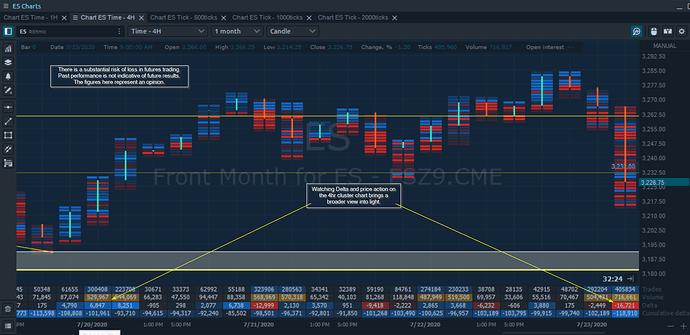
Cluster charts can make it slightly more challenging to see the bigger picture with buyers and sellers, so I refer to my 4hr cluster chart:

There is a substantial risk of loss in futures trading. Past performance is not indicative of future results. The figures here represent an opinion. The placement of contingent orders by you or broker, or trading advisor, such as a “stop-loss” or “stop-limit” order, will not necessarily limit your losses to the intended amounts, since market conditions may make it impossible to execute such orders. Please conduct your own due diligence if Futures are an appropriate instrument for you.
Optimus Flow

1 Like