Pattern Recognition.
With anything we do, there’s always a snap judgement decision made behind the scenes in our subconscious. Trading is trading, there are charts and indicators and patterns, feelings, etc, etc, etc. The list goes on forever.
But behind all those things is one thing. Human emotion. The markets move from buying and selling. That’s it. They don’t move because moving averages cross over or it’s trading outside the top bollinger band.
Those might be things that people look at to create a trade idea, but it’s not the main reason. This is why so many times you see something so obvious and say “there’s no way it can break this support with the current uptrend”. Then it breaks it out of all logic and reasoning, trades back up, then down, sideways, and finally up. Or maybe down for that matter.
Just like people, markets are sometimes irrational, frustrating, hopeful, predictable, unpredictable and all the other emotions humans have.
So how do you break through this? How do you not get reversed so many times and carried away like a leaf floating in a fast moving current with no direction.
You get out. Get out and watch. Watch for hours every day and do that for a year. Don’t try to explain anything or prove anything, just observe.
When you don’t have a bias or a position in the market you can start to see patterns that you can pick up on. You may not be able to explain these though.
But don’t you have to “know” why things happen? Shouldn’t you be able to explain why the market did what it did?
Yes and No I say. Take Vic Braden for instance. He was a professional tennis player for year then coached and counseled tennis players. In his seventies, he started to notice something odd.
When a player was serving and faulted, they get a second serve. He started to notice that he could predict, before they even hit the ball, if they would double fault. In some matches he could accurately predicted 16 out of 17 double faults. Sometimes he was getting 20 out of 20 right. Despite his efforts to look for indicators, the player stumbling or being off balance, he could not explain how he could do this with such accuracy. (Came from the book Blink by Malcolm Gladwell - Highly recommended).
He was taking small slices of information and making a decision based on that in a split second. We all have this ability.
Telling if a car is going to run a red light, if we like someone within 30 seconds of meeting them, etc.
So how does this intertwine with trading? Well first I’d say if you’re struggling, sit on the sidelines for a bit and just observe. Not only the markets but also your feeling or gut instinct.
Ask yourself:
- If I was a buyer why would I buy right now? Same with selling.
- If I was long or short, what would I want to see? What would I NOT want to see?
- What’s the market doing? Literally say it out loud. “It’s going up fast and there are small consolidation periods with little down movement”. “It’s trading in a channel”. “It’s moving down quickly”.
While there are patterns that you may not be able to make tangible but they work for you, great, use them.
If you have a hunch, use the best tool that you understand the most and that makes the sense to YOU. Everyone processes information differently.
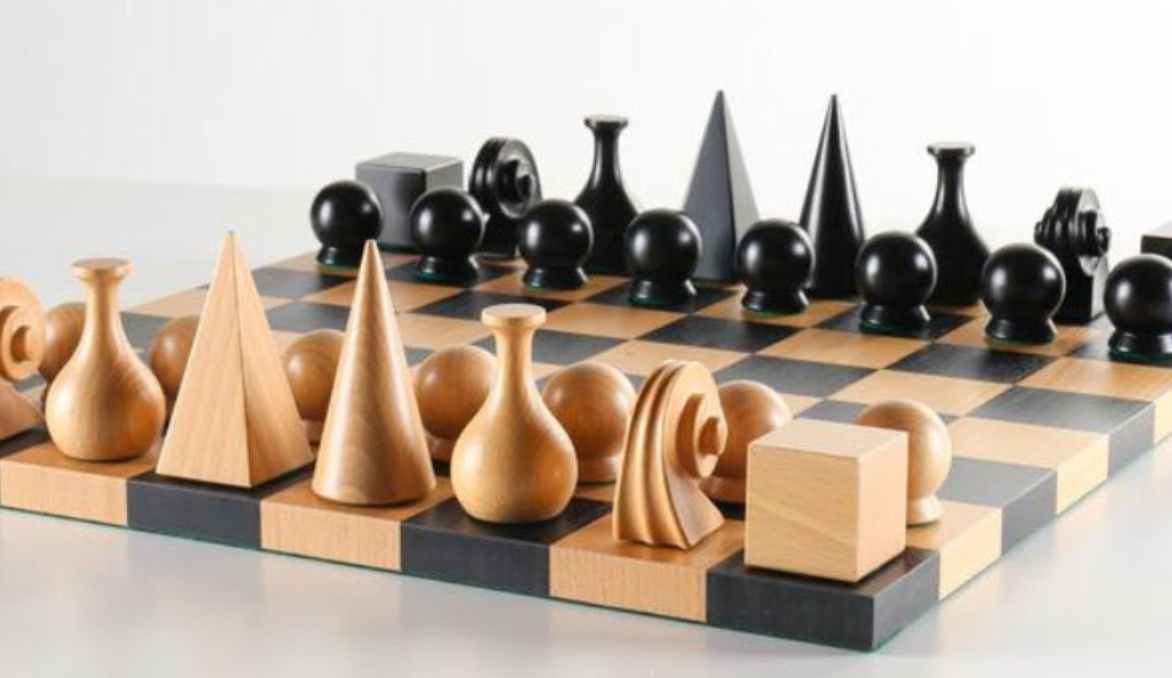
For anyone who plays chess a lot, you’re probably like me. I have to have a certain board or type of set that I can see best. I don’t like modern boards because it takes longer for me to tell the difference between the pieces.
Like this:
This looks like a collection of different vases from 2045. Beautiful, but doesn’t make sense to me.
Chess is a game of perfection information, meaning both players have the exact same information at their disposal. However, as with chess boards, the way that players interpret that information varies greatly depending on multiple factors.
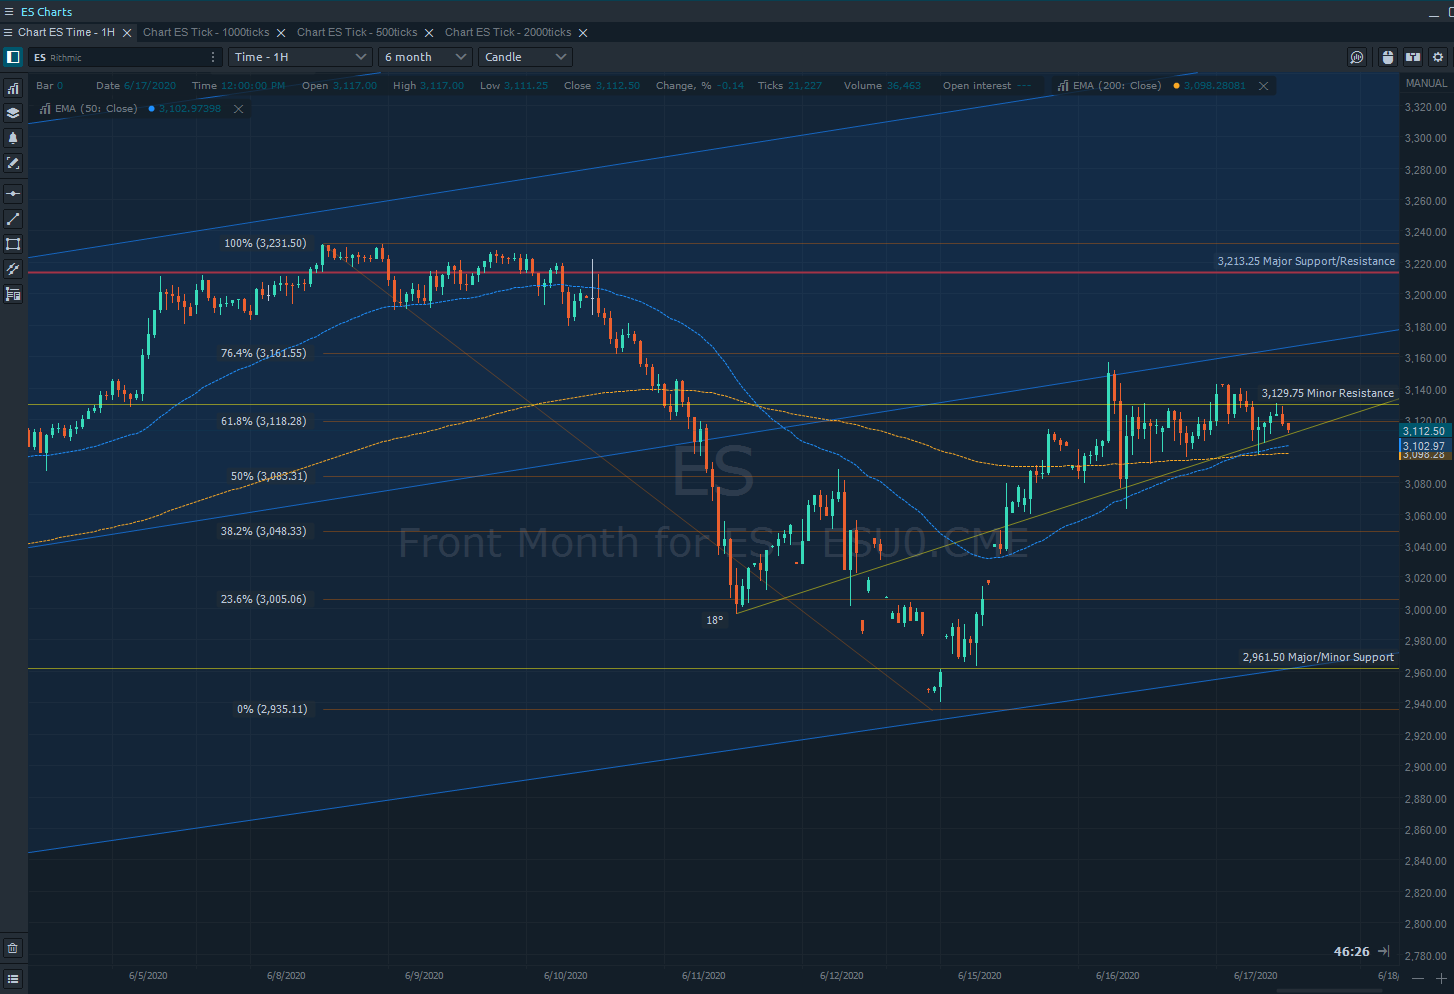
My setup and charts make sense to me and they also allow some tangibility in terms of explaining or justifying an idea. This took a lot of time of trial and error.
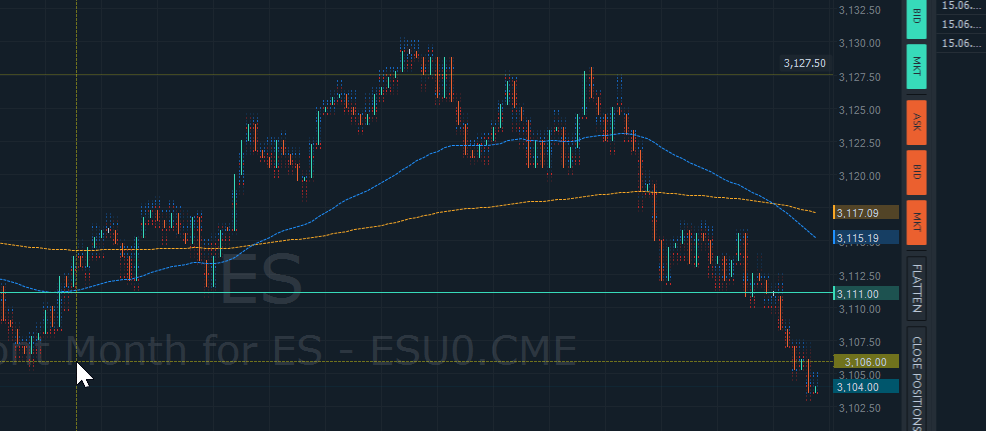
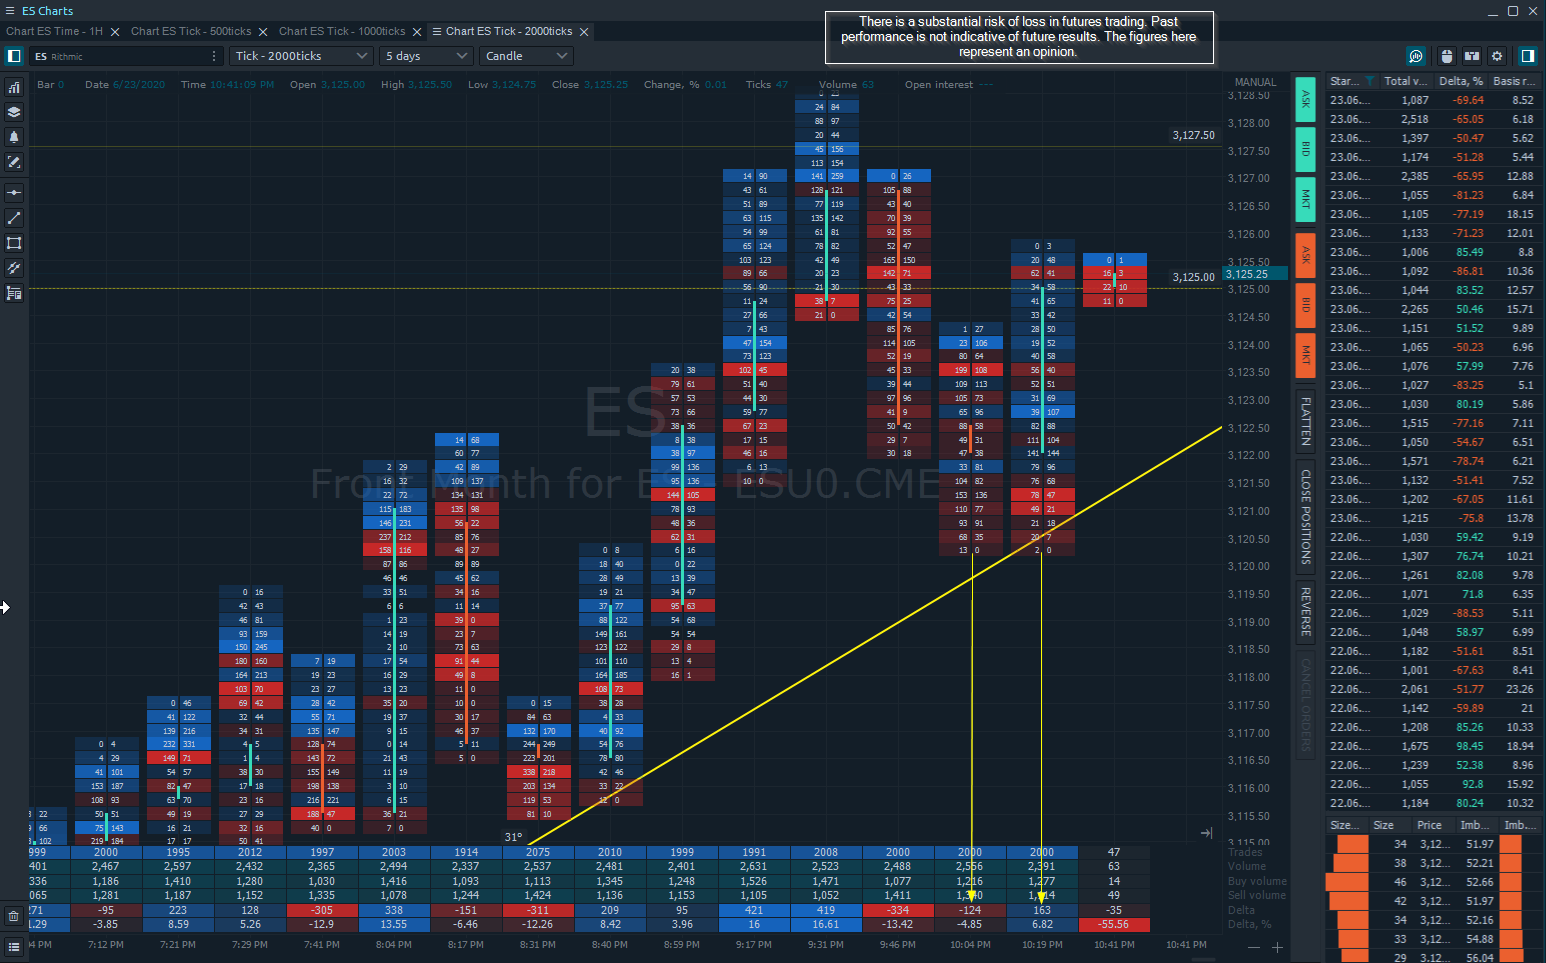
For the intangible pattern recognition, that’s my Order Entry ticket.
Watch this and just observe. Write down or just say what you see.
When I was watching this, I saw someone buy 157 lots on the low side of the channel. Before it broke up a point I saw someone sell 29 lots into the bid. I saw lots of trading back and forth. I saw some bold trades.
Then you start asking yourself what you would do if you were that trader, like mentioned above.
If you watched that for months and months, for short term trades you wouldn’t even need a chart (not recommended just trying to emphasize a point). This is why markets move.
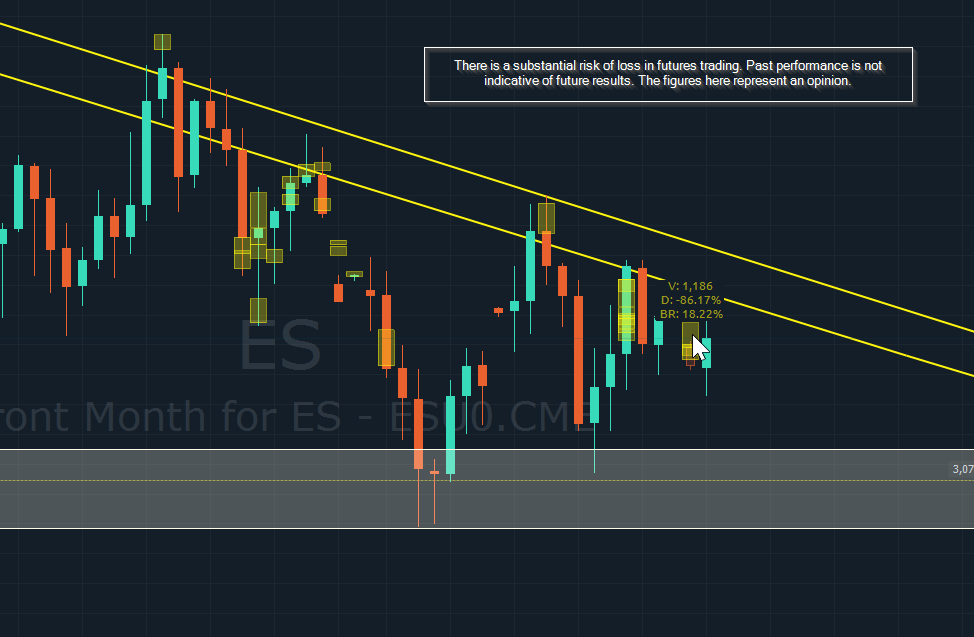
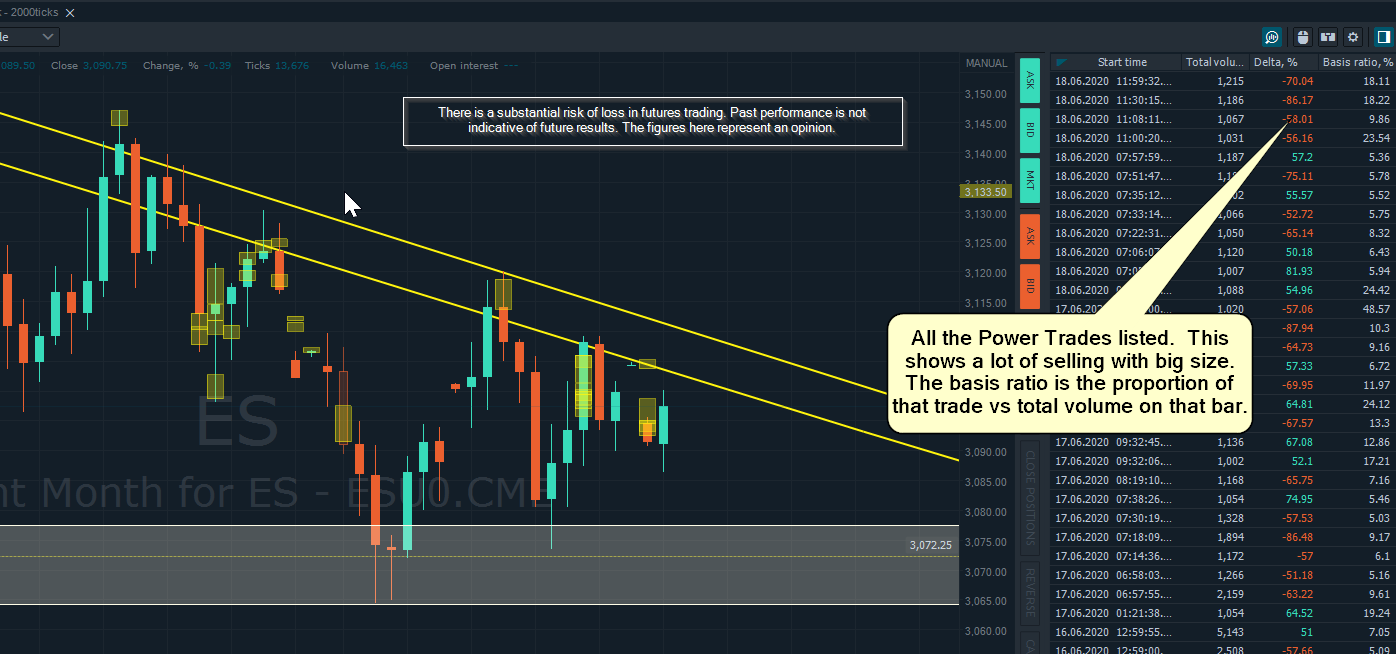
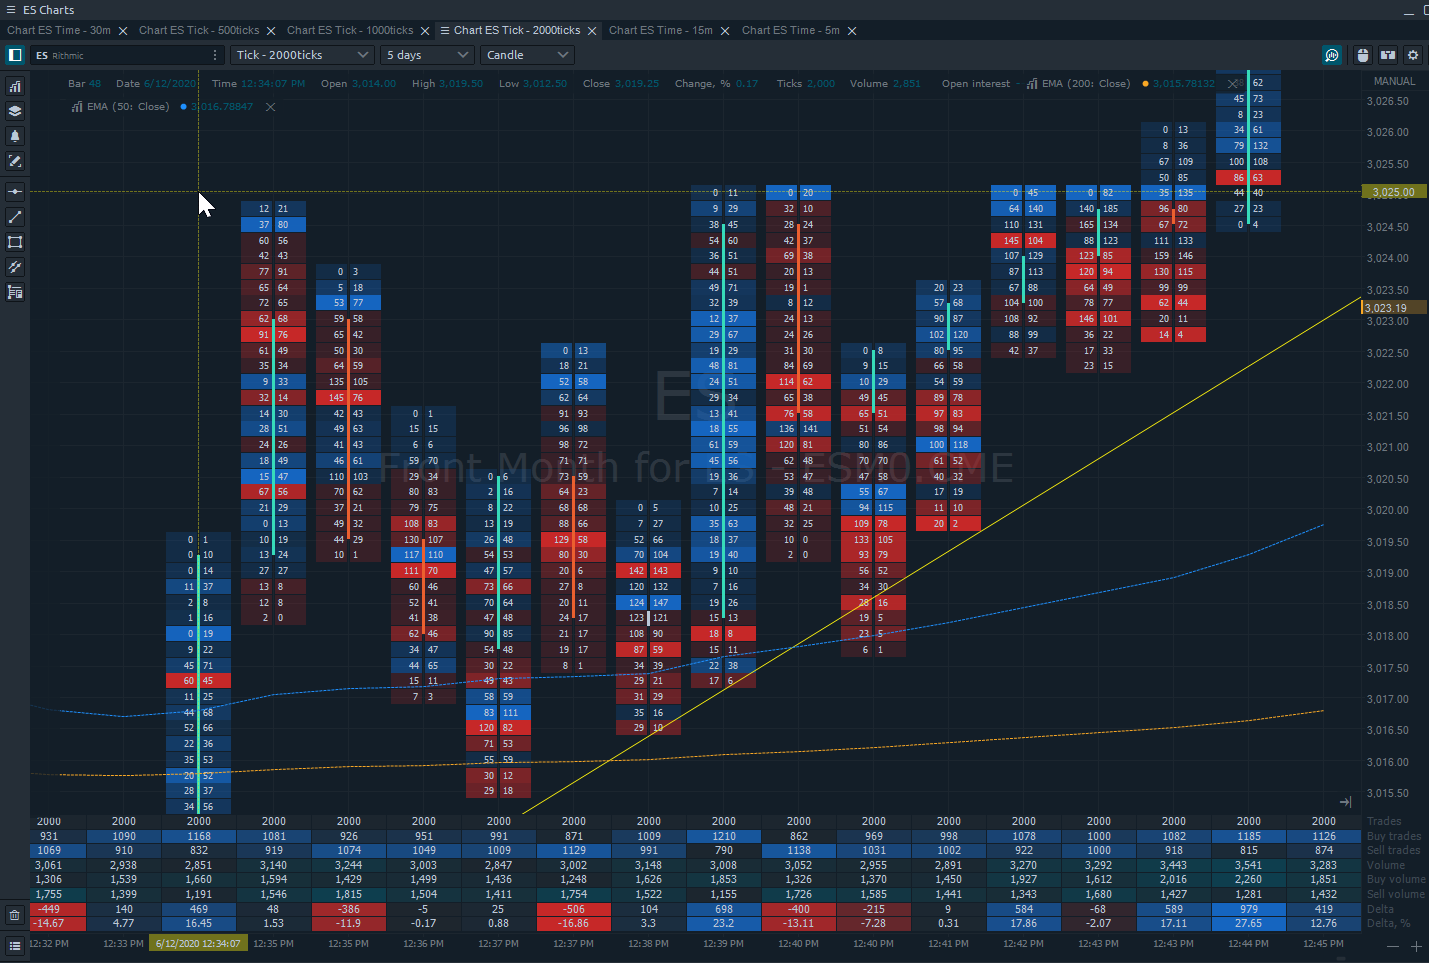
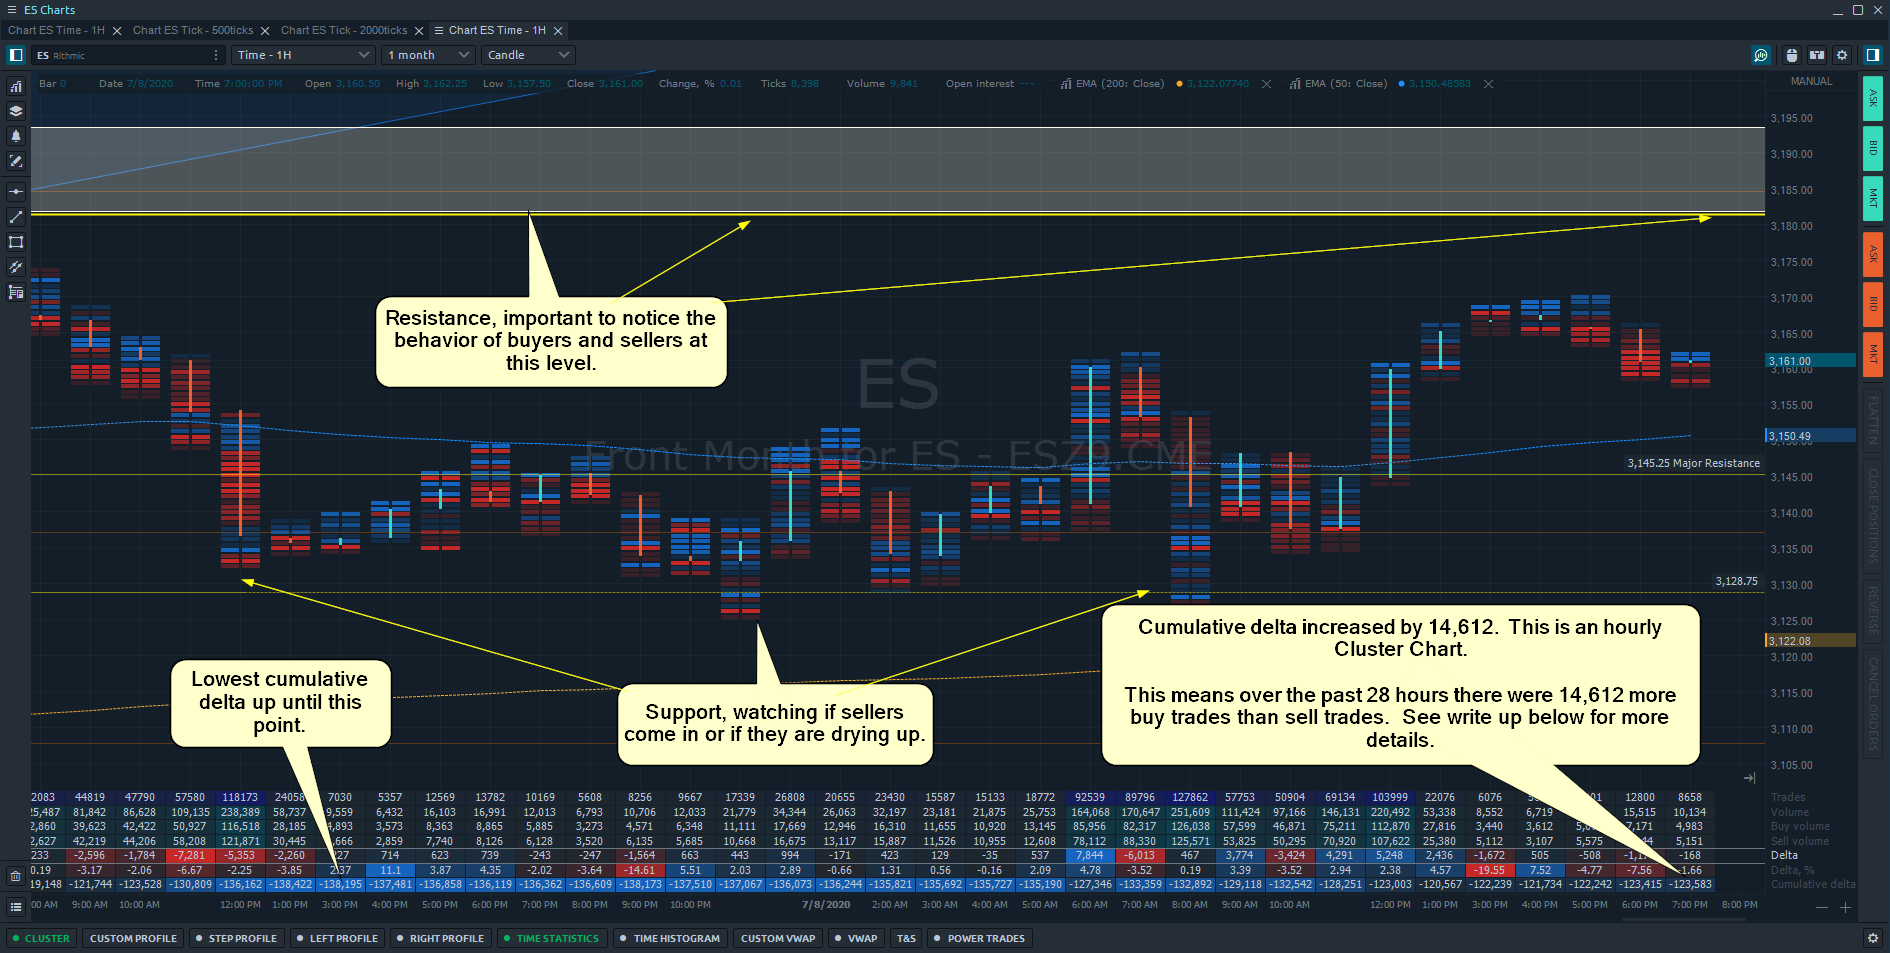
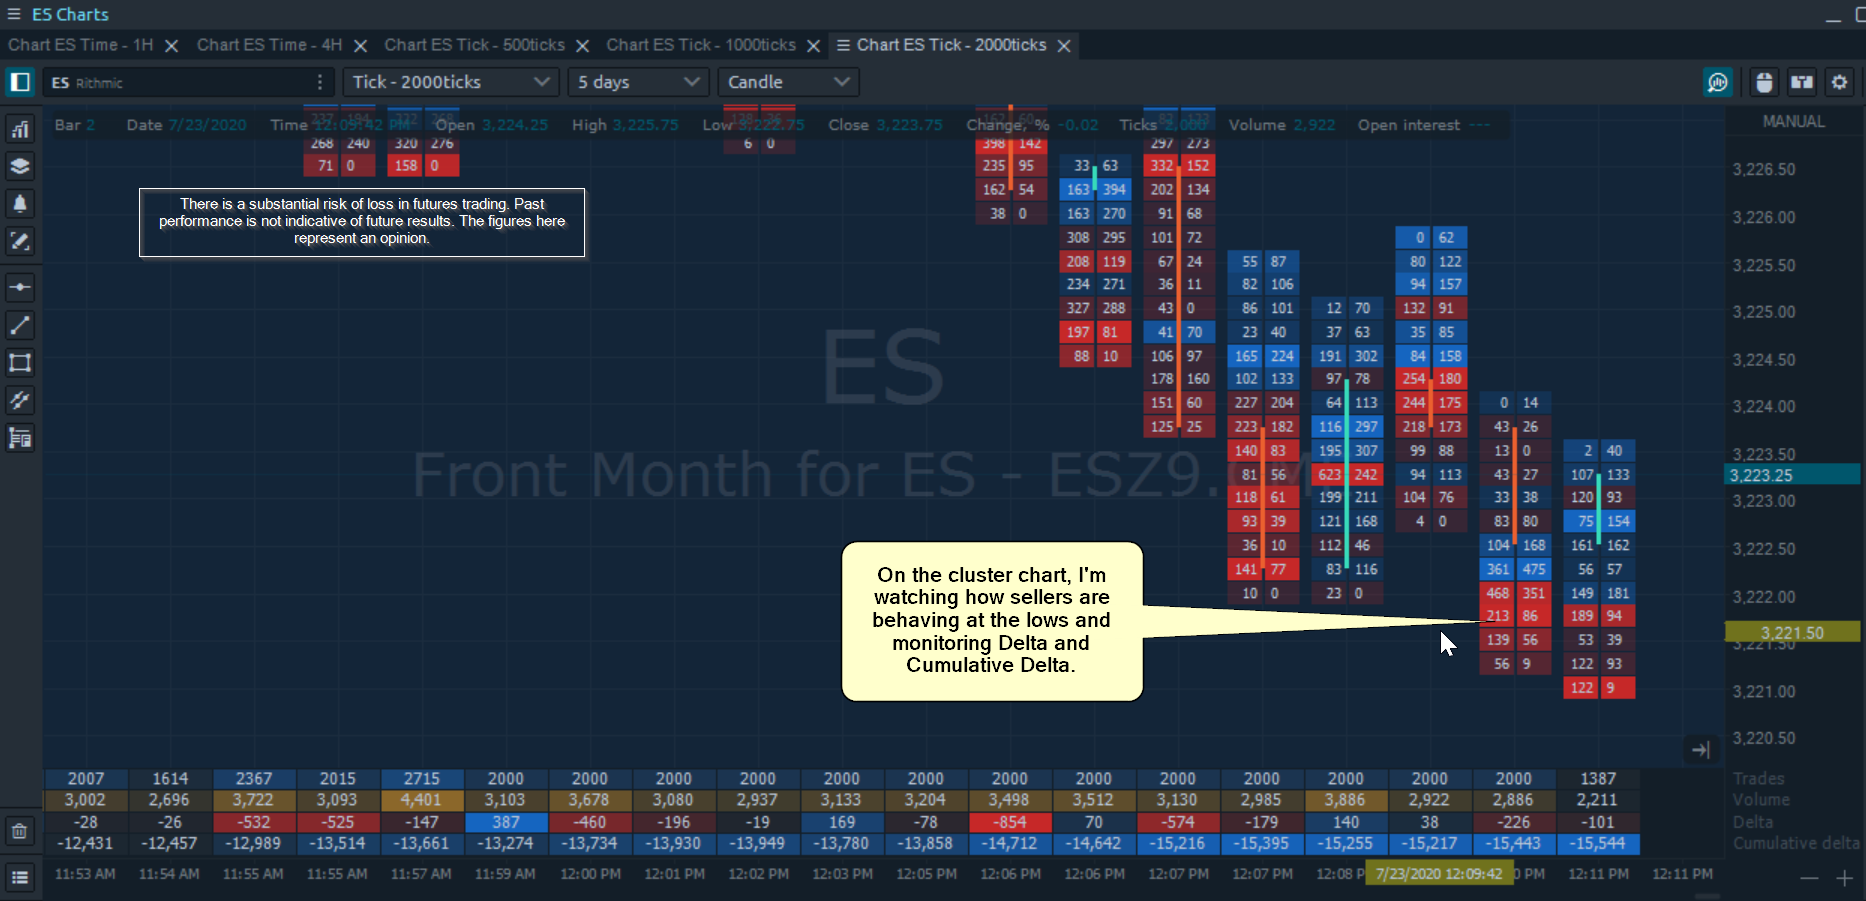
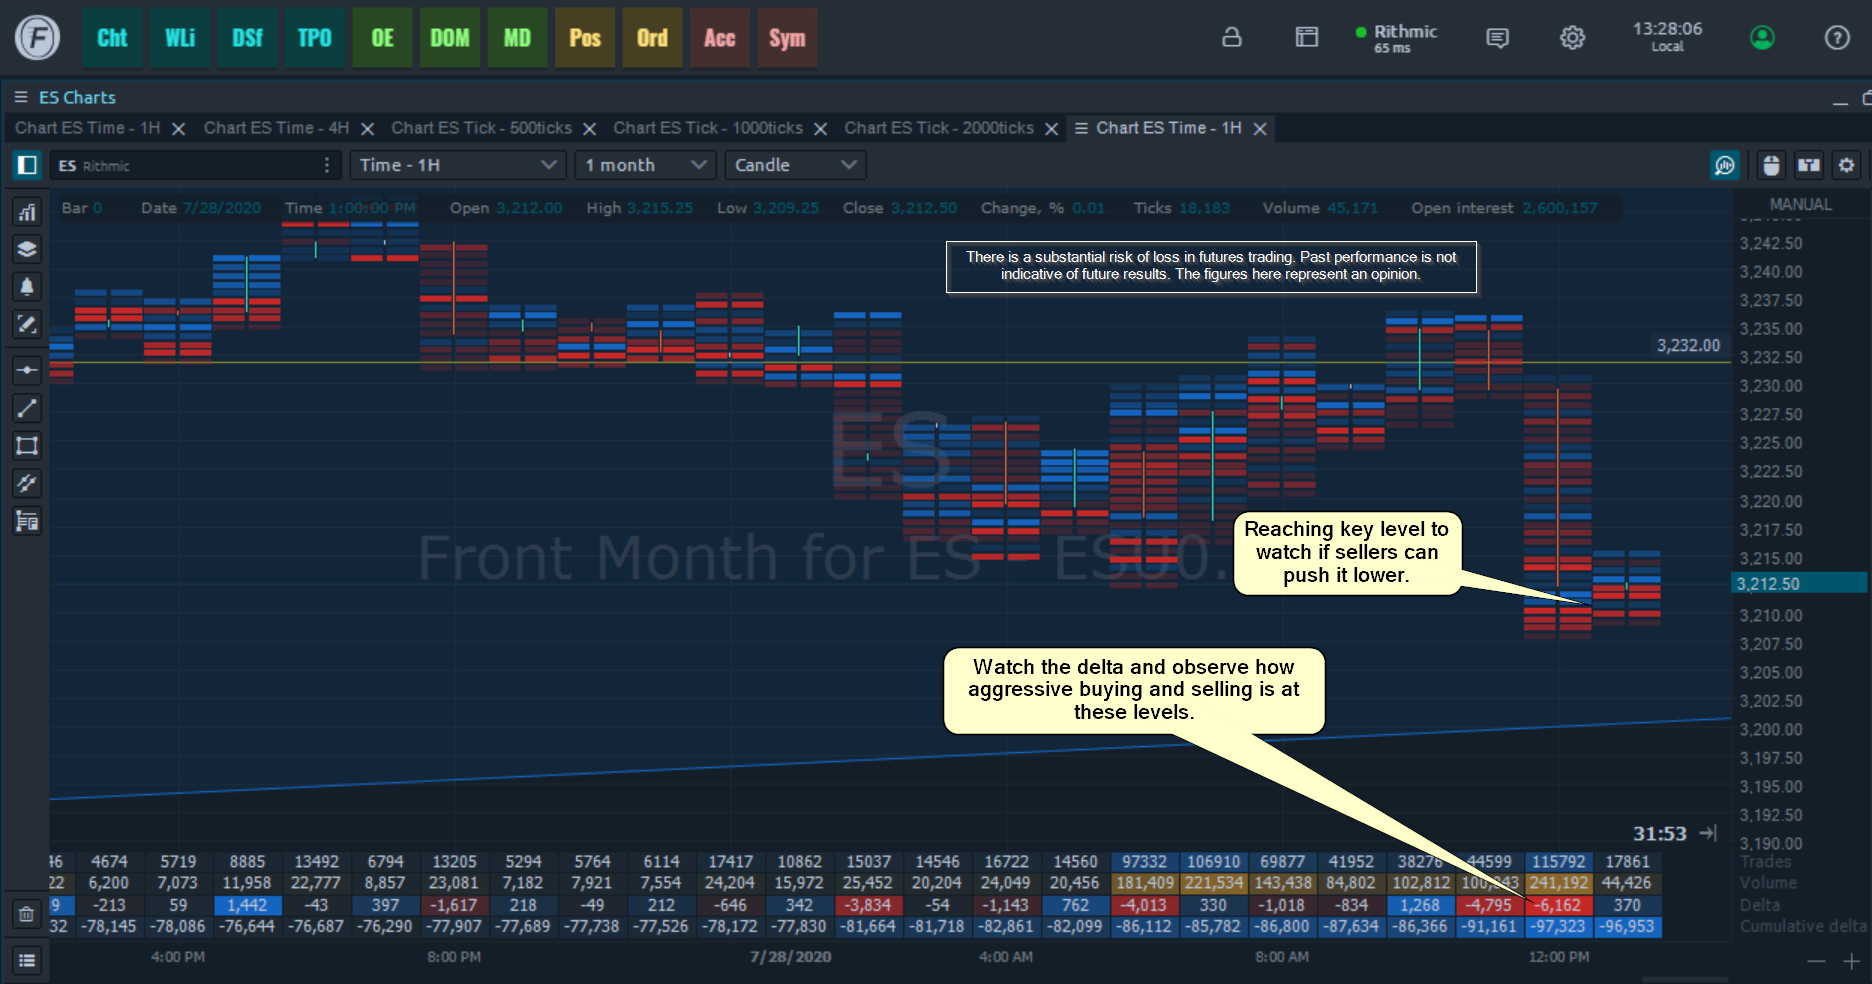
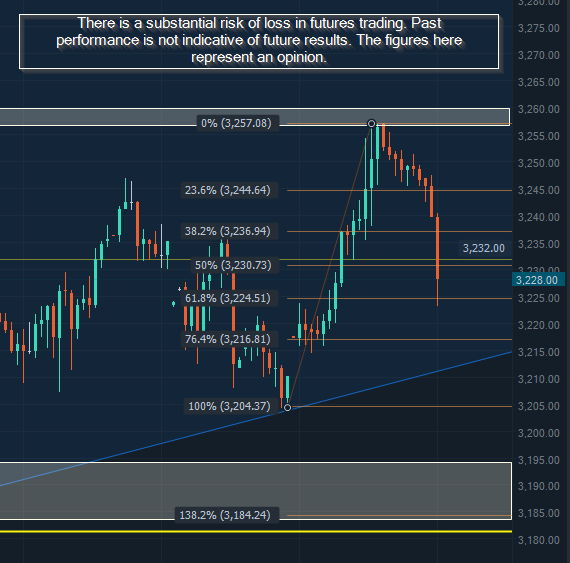
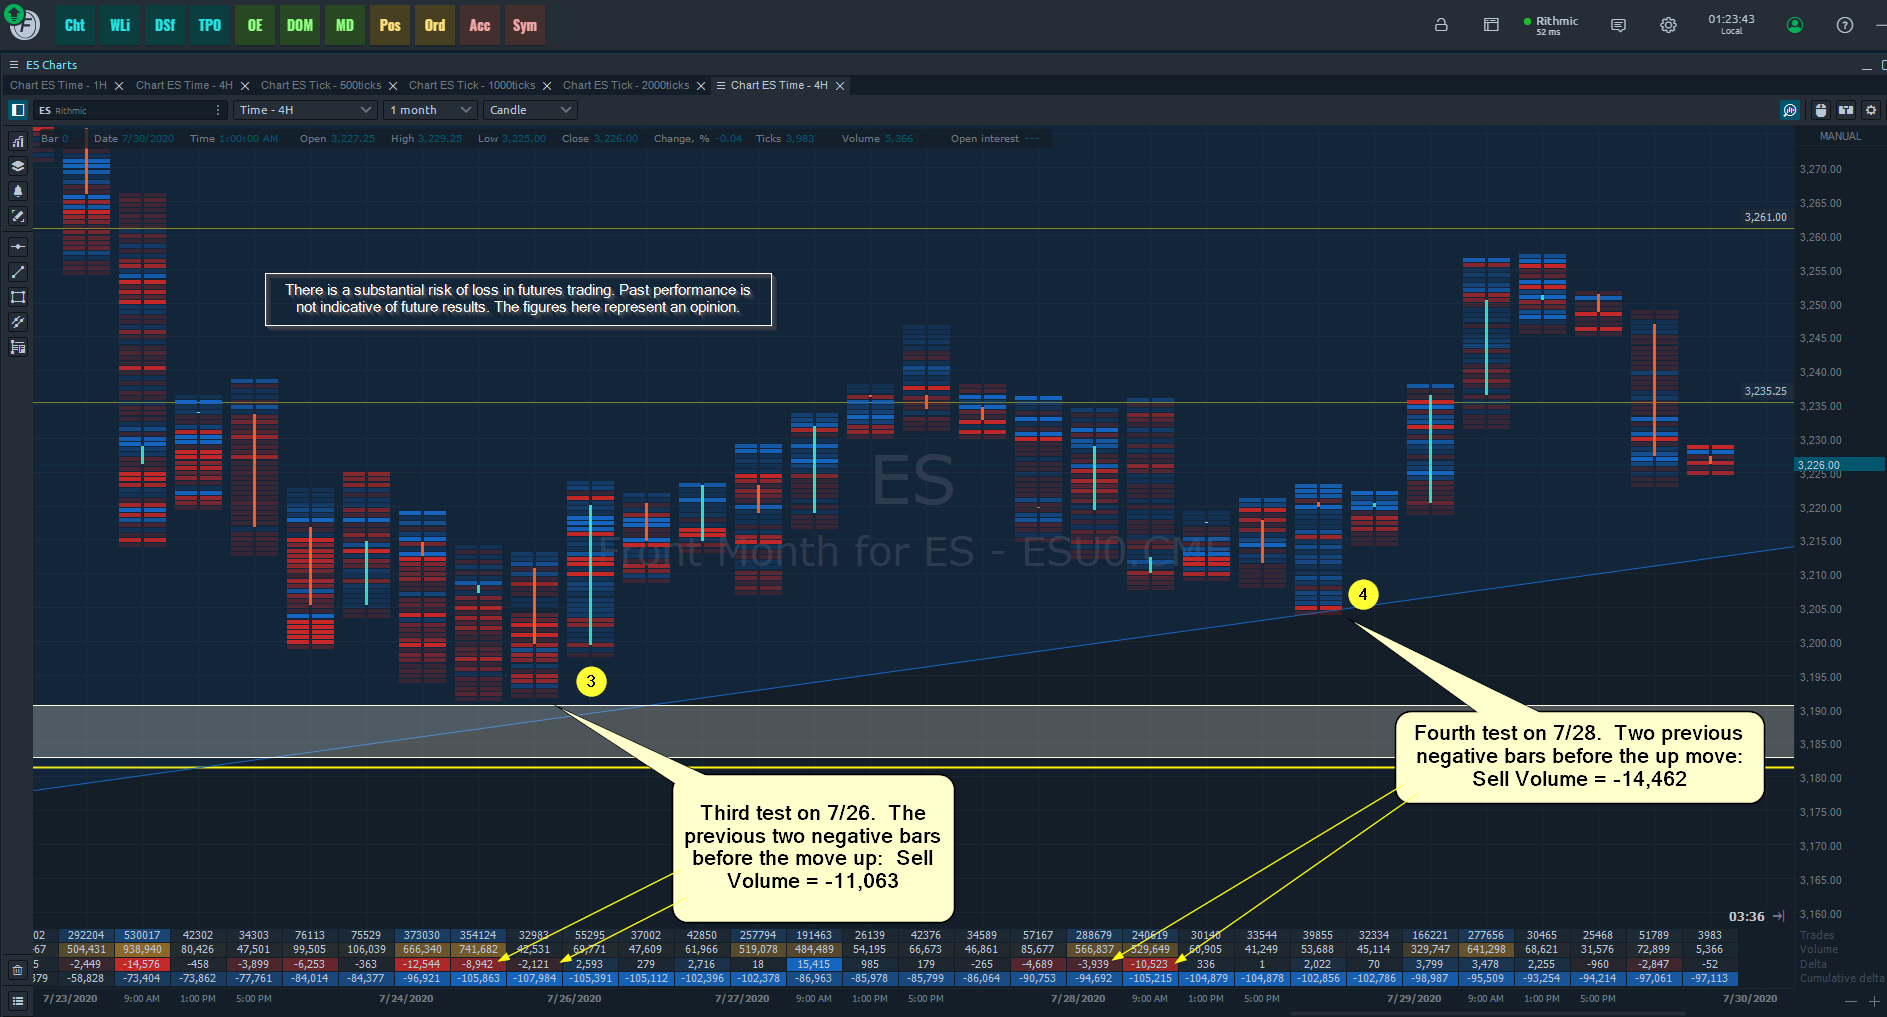
The tangible side of this is Cluster Charts. It records everything and you can see any imbalance or bias.
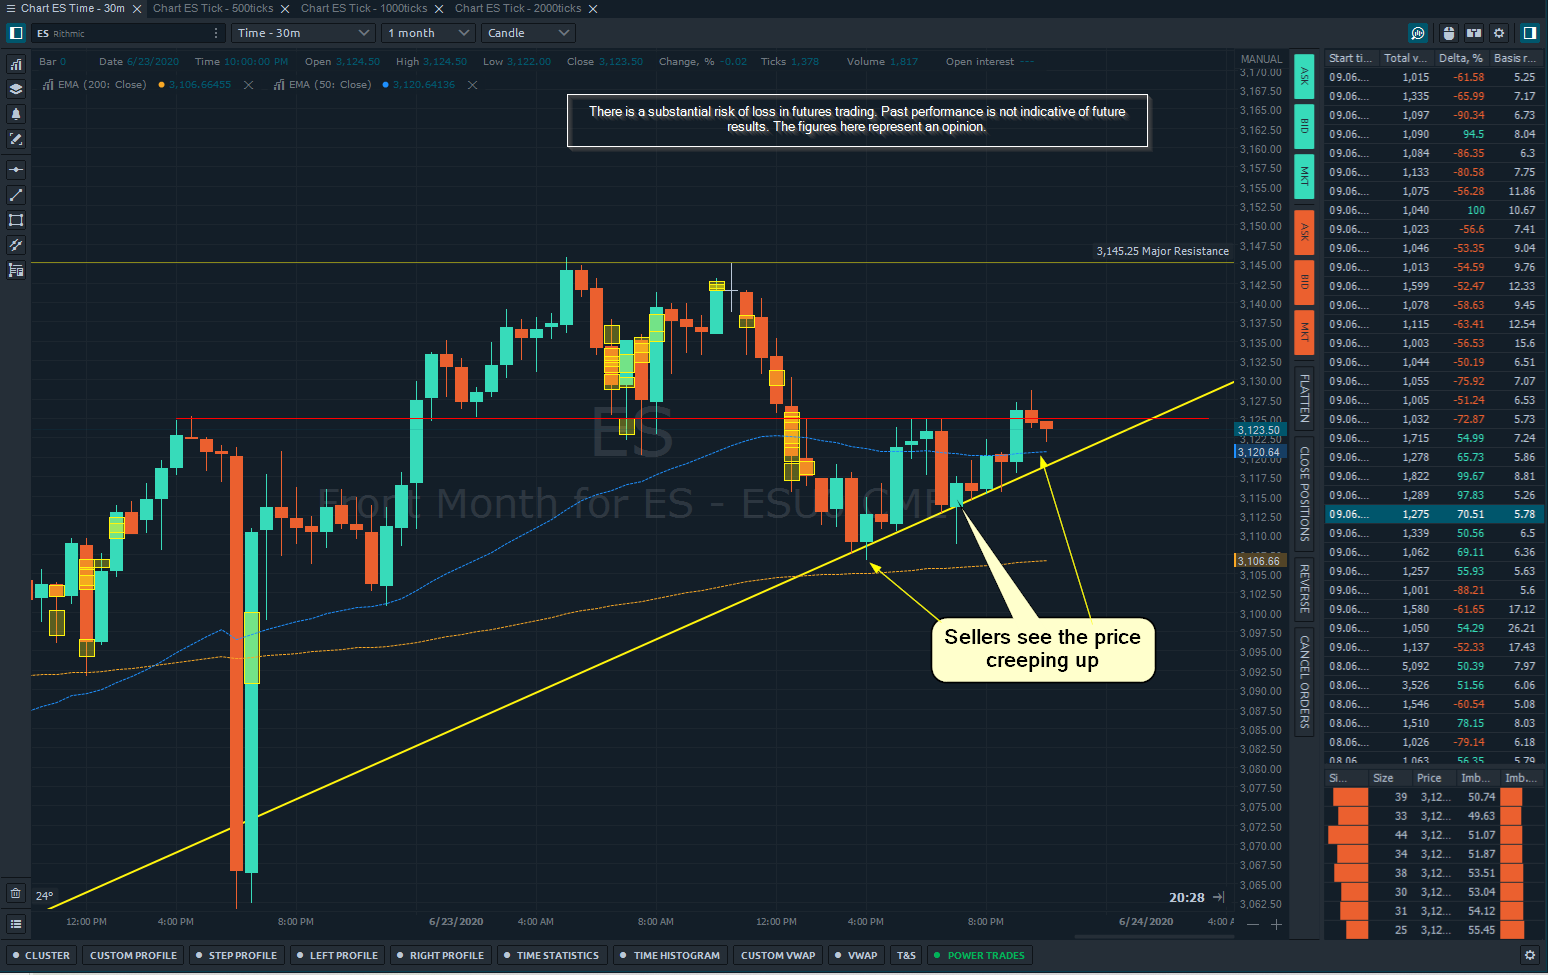
I saw a pattern form that I liked and made a trade from it. A few days later, I saw the same pattern form, made the same trade. Same result.
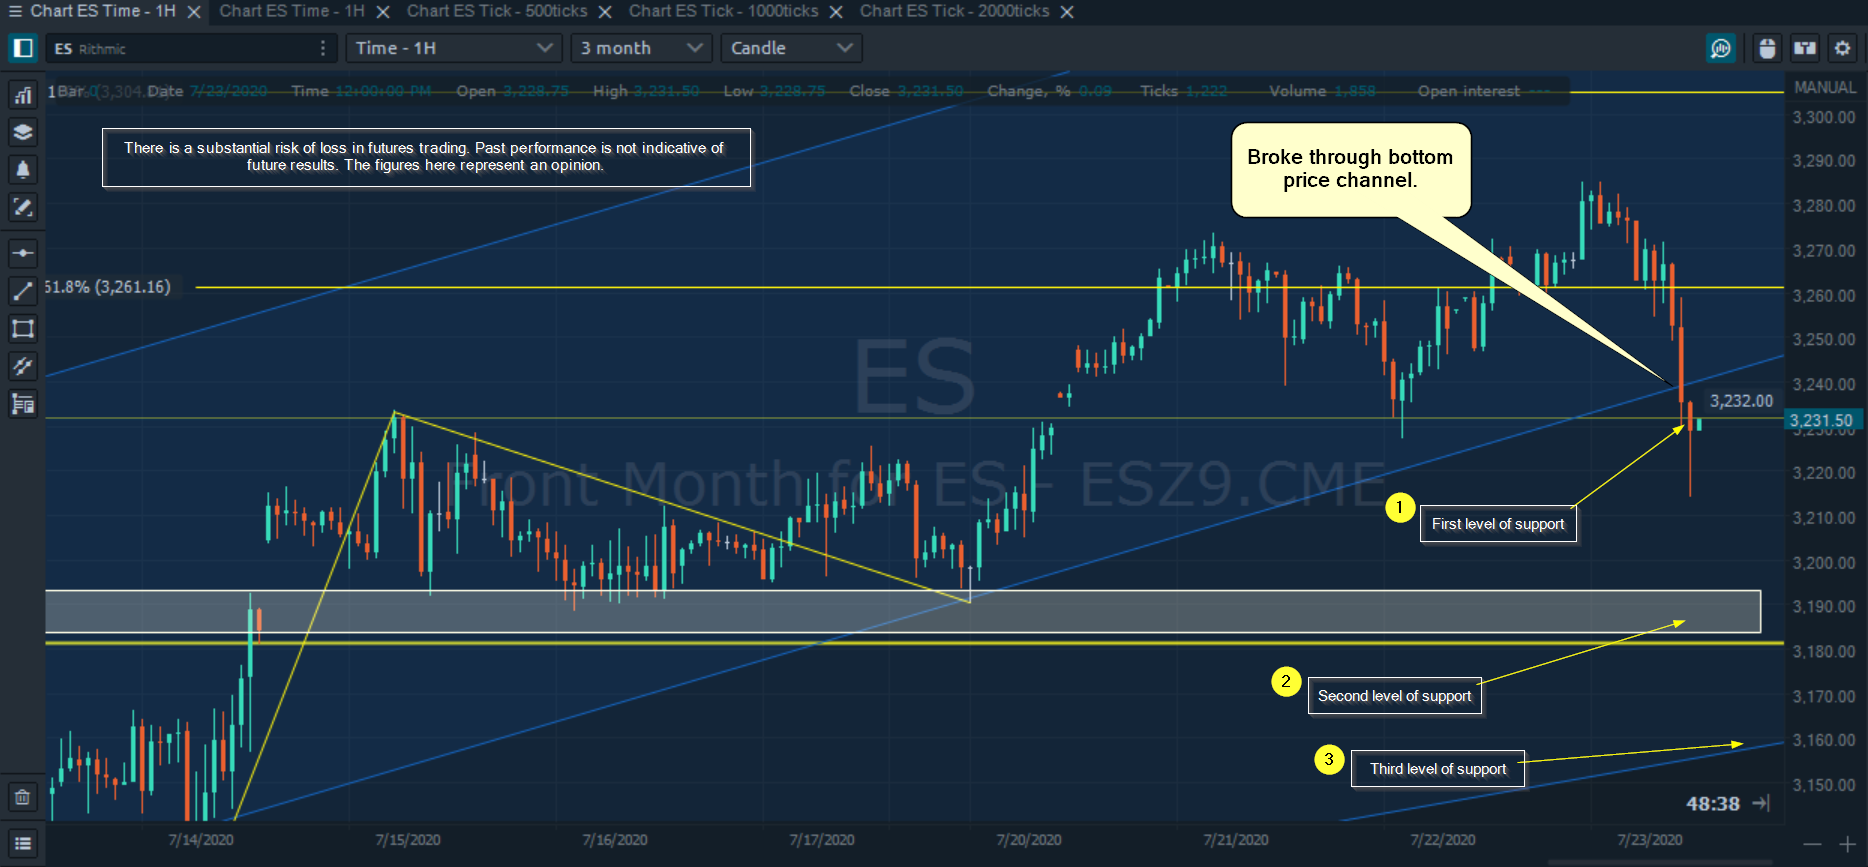
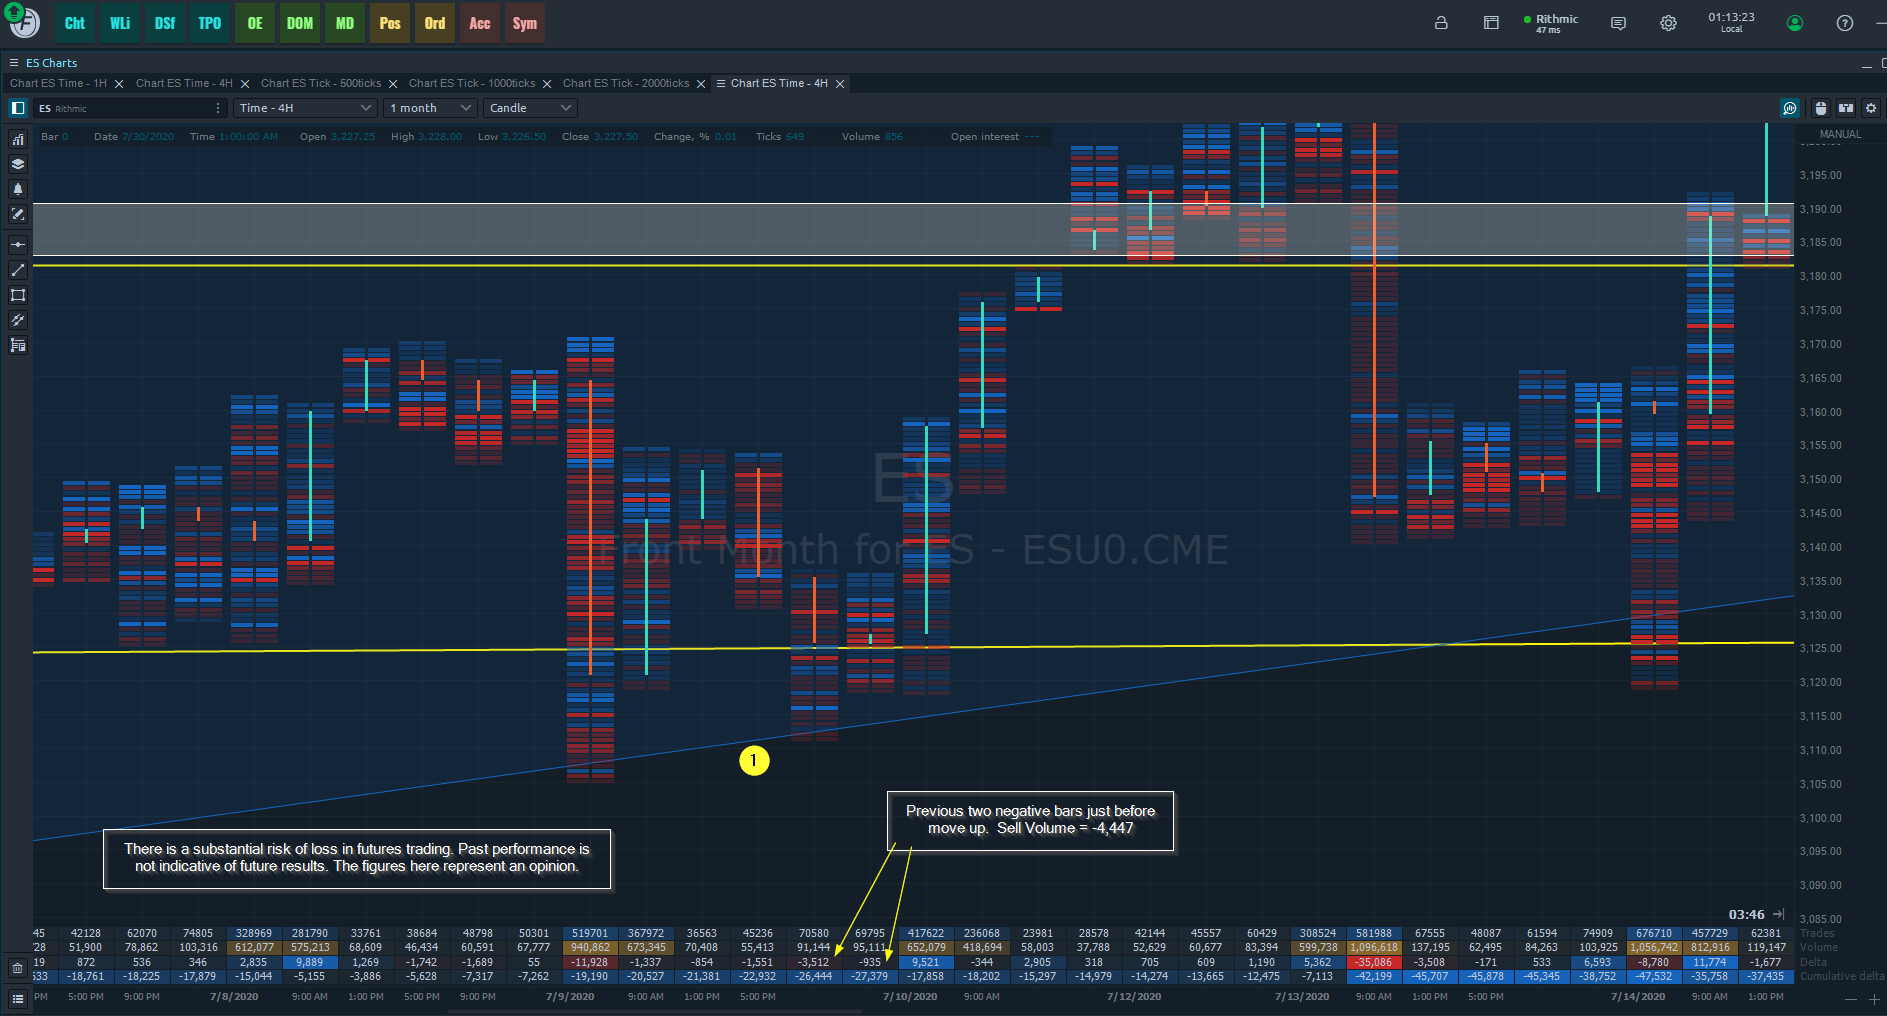
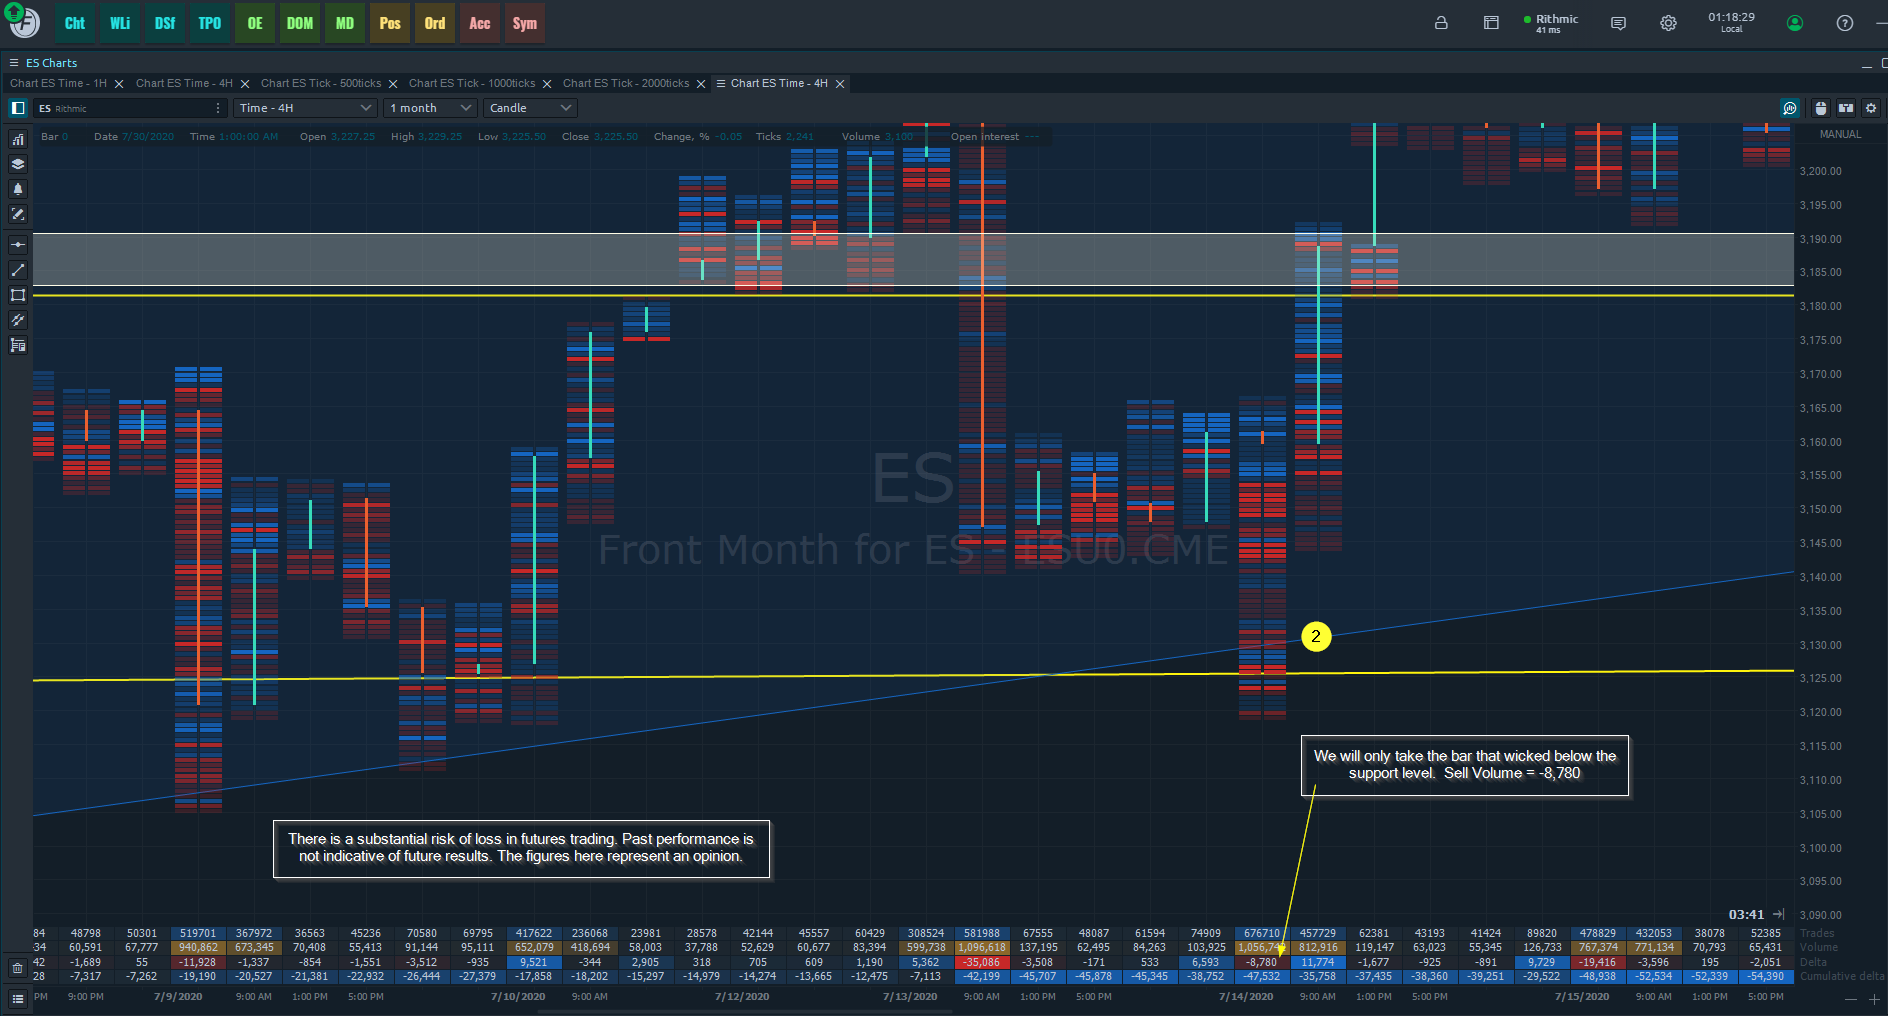
There is a substantial risk of loss in futures trading. Past performance is not indicative of future results. The figures here represent an opinion.
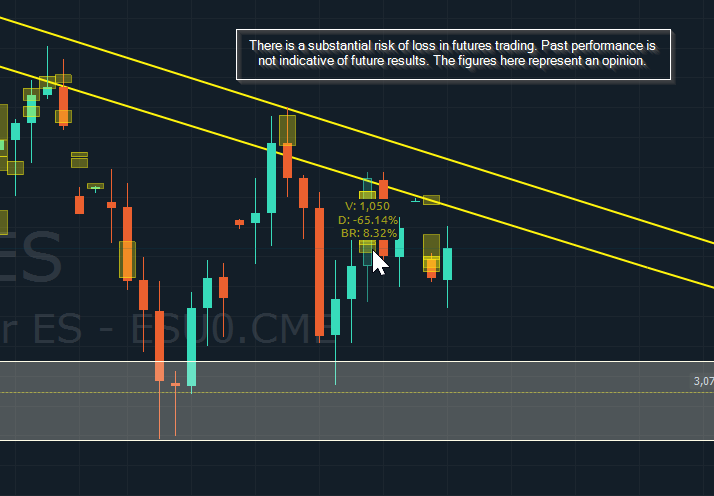
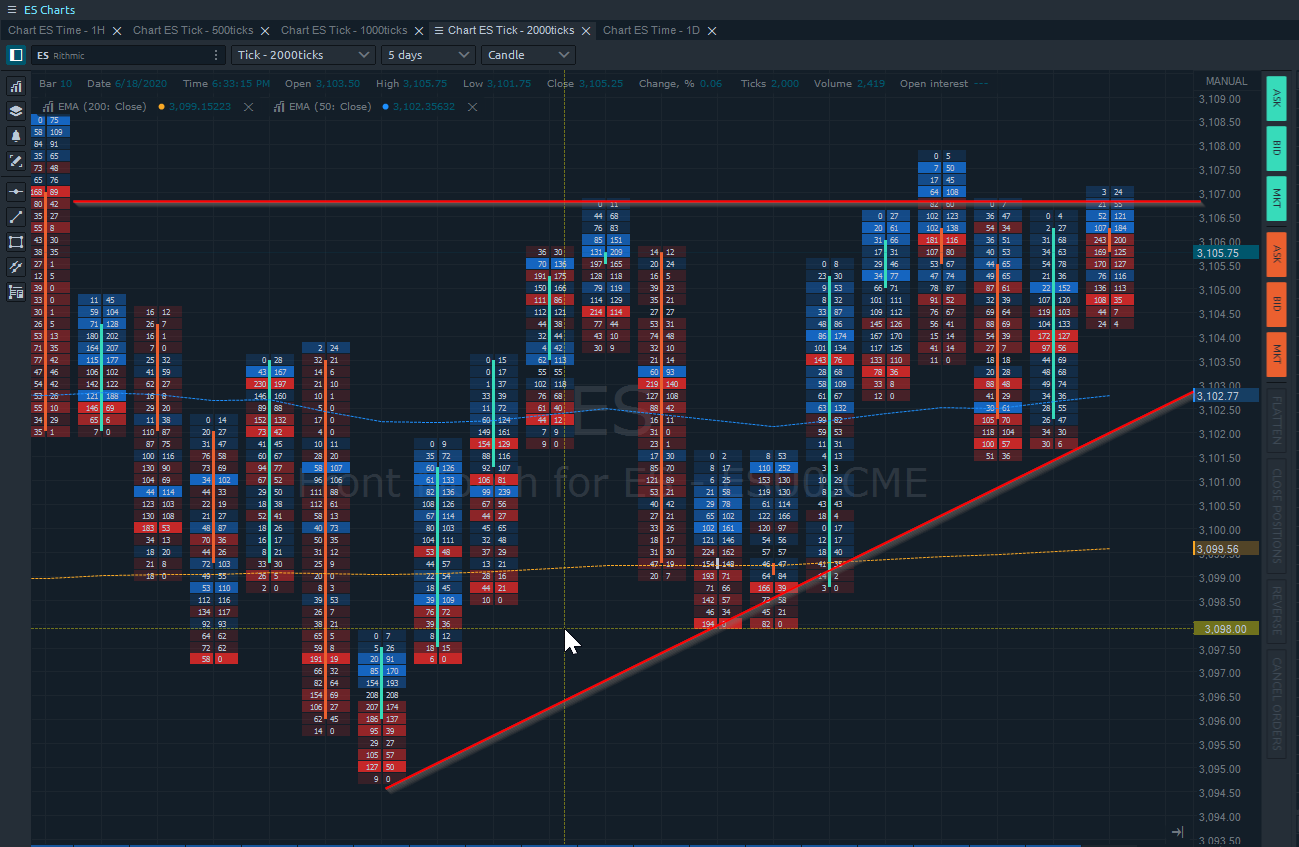
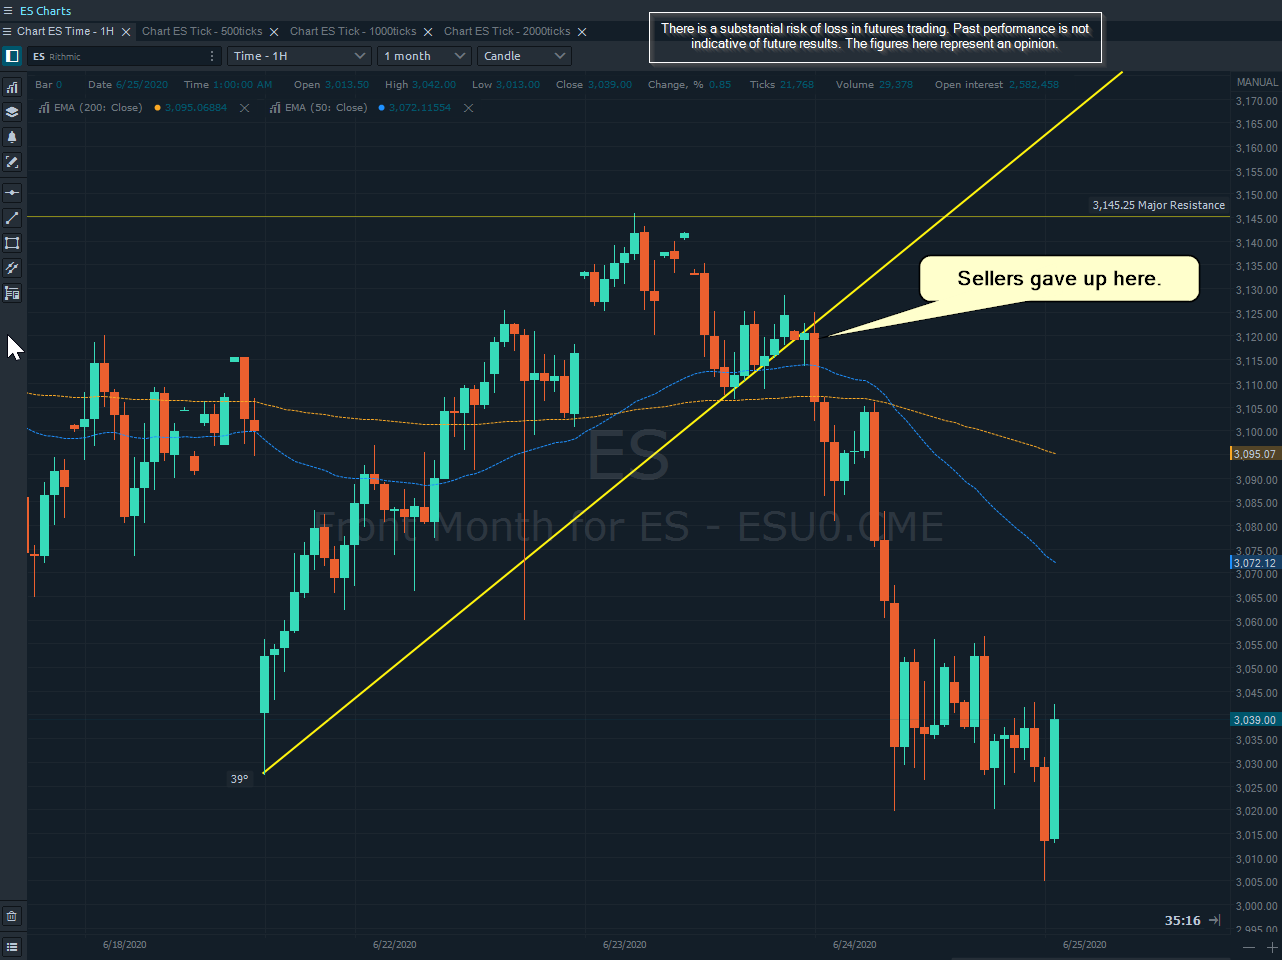
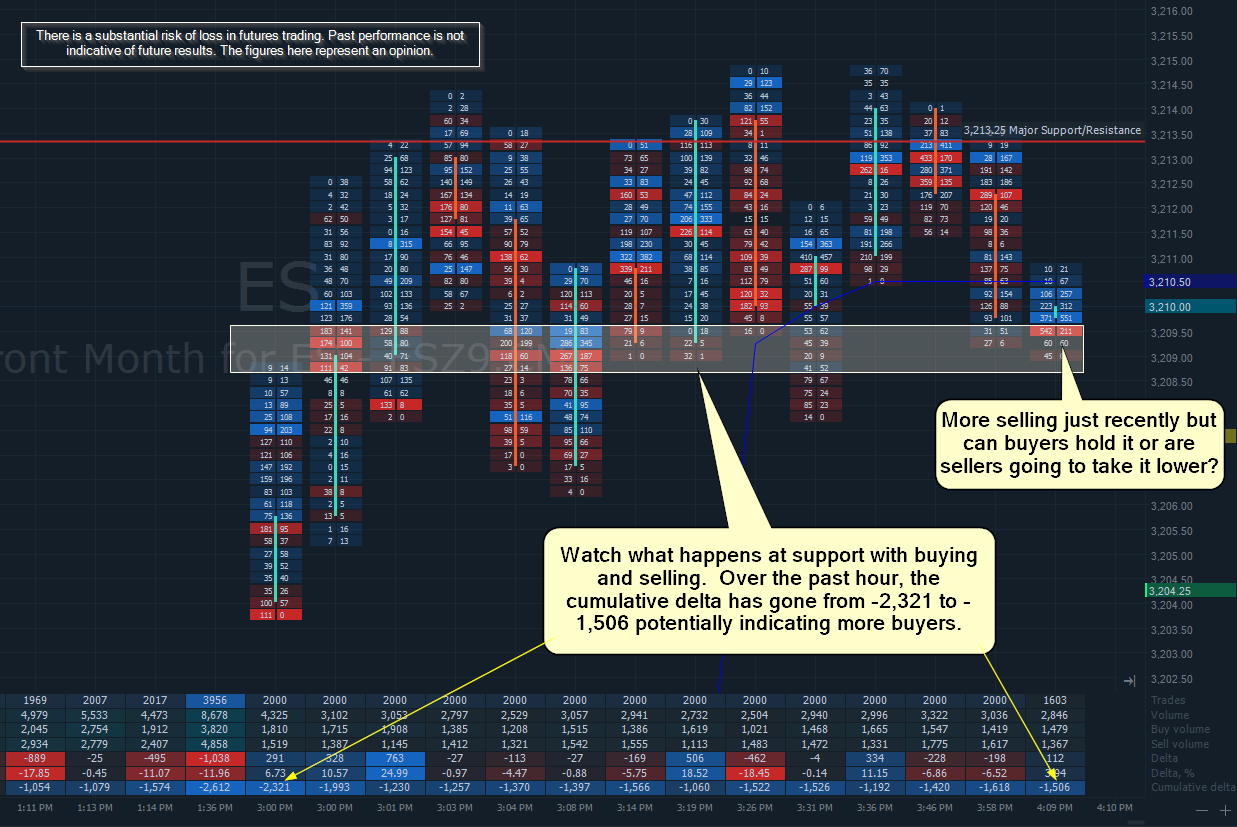
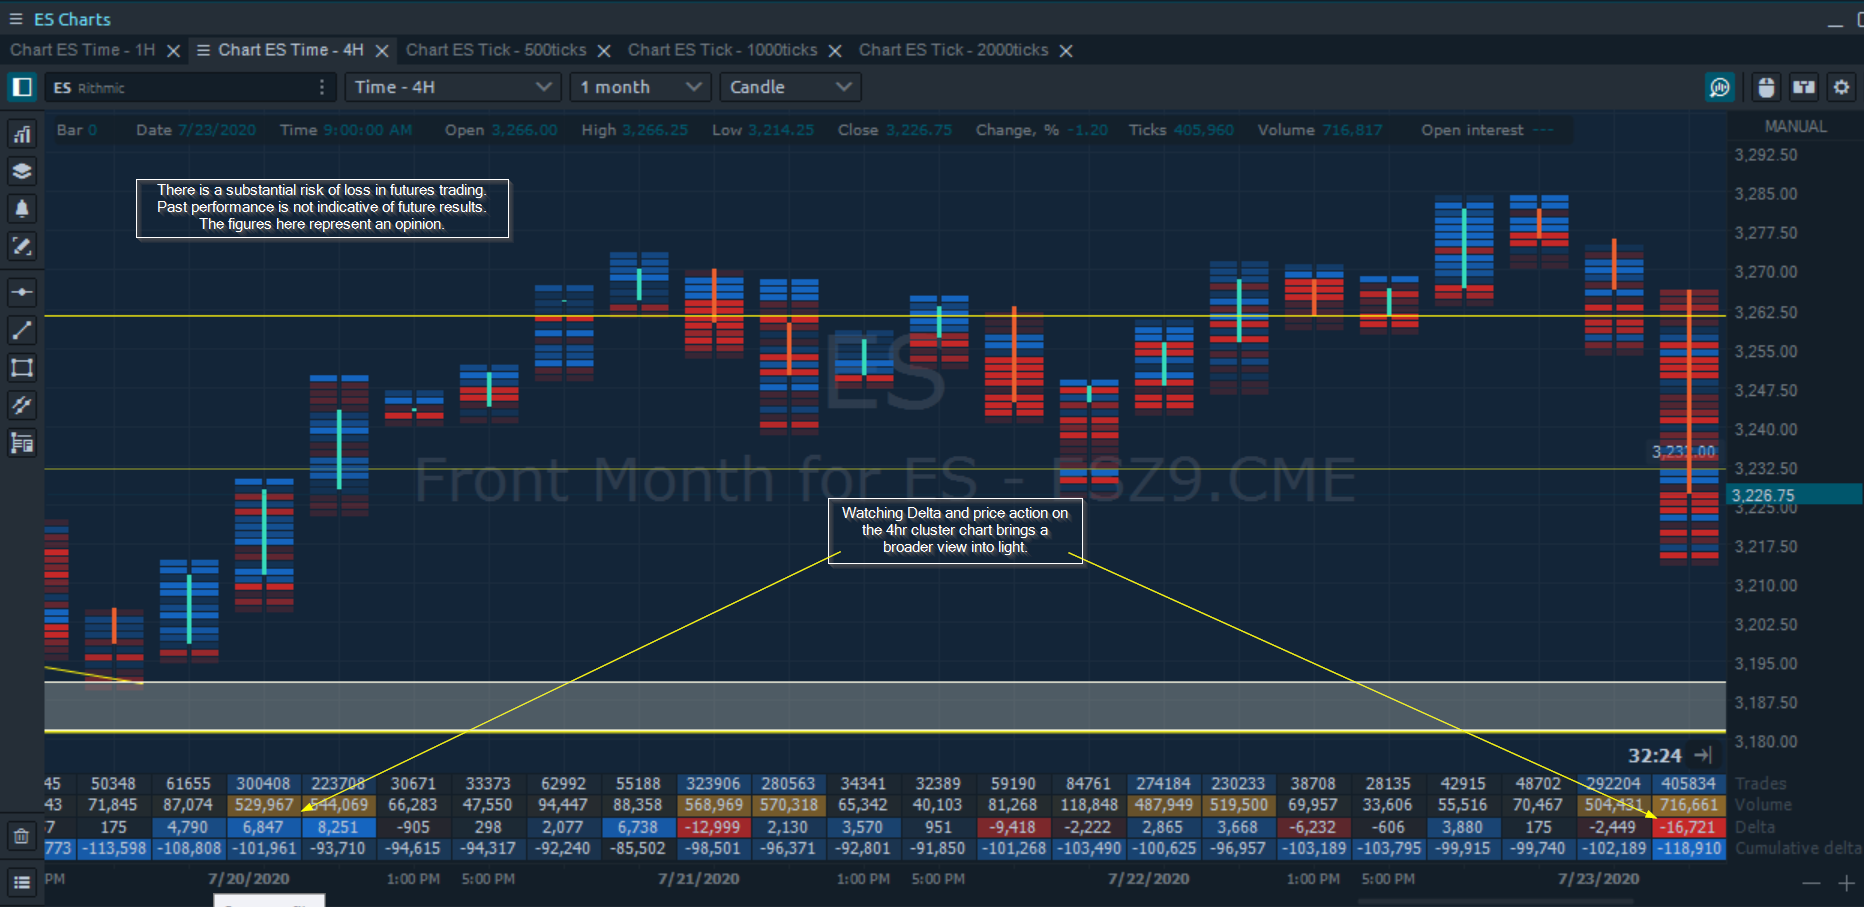
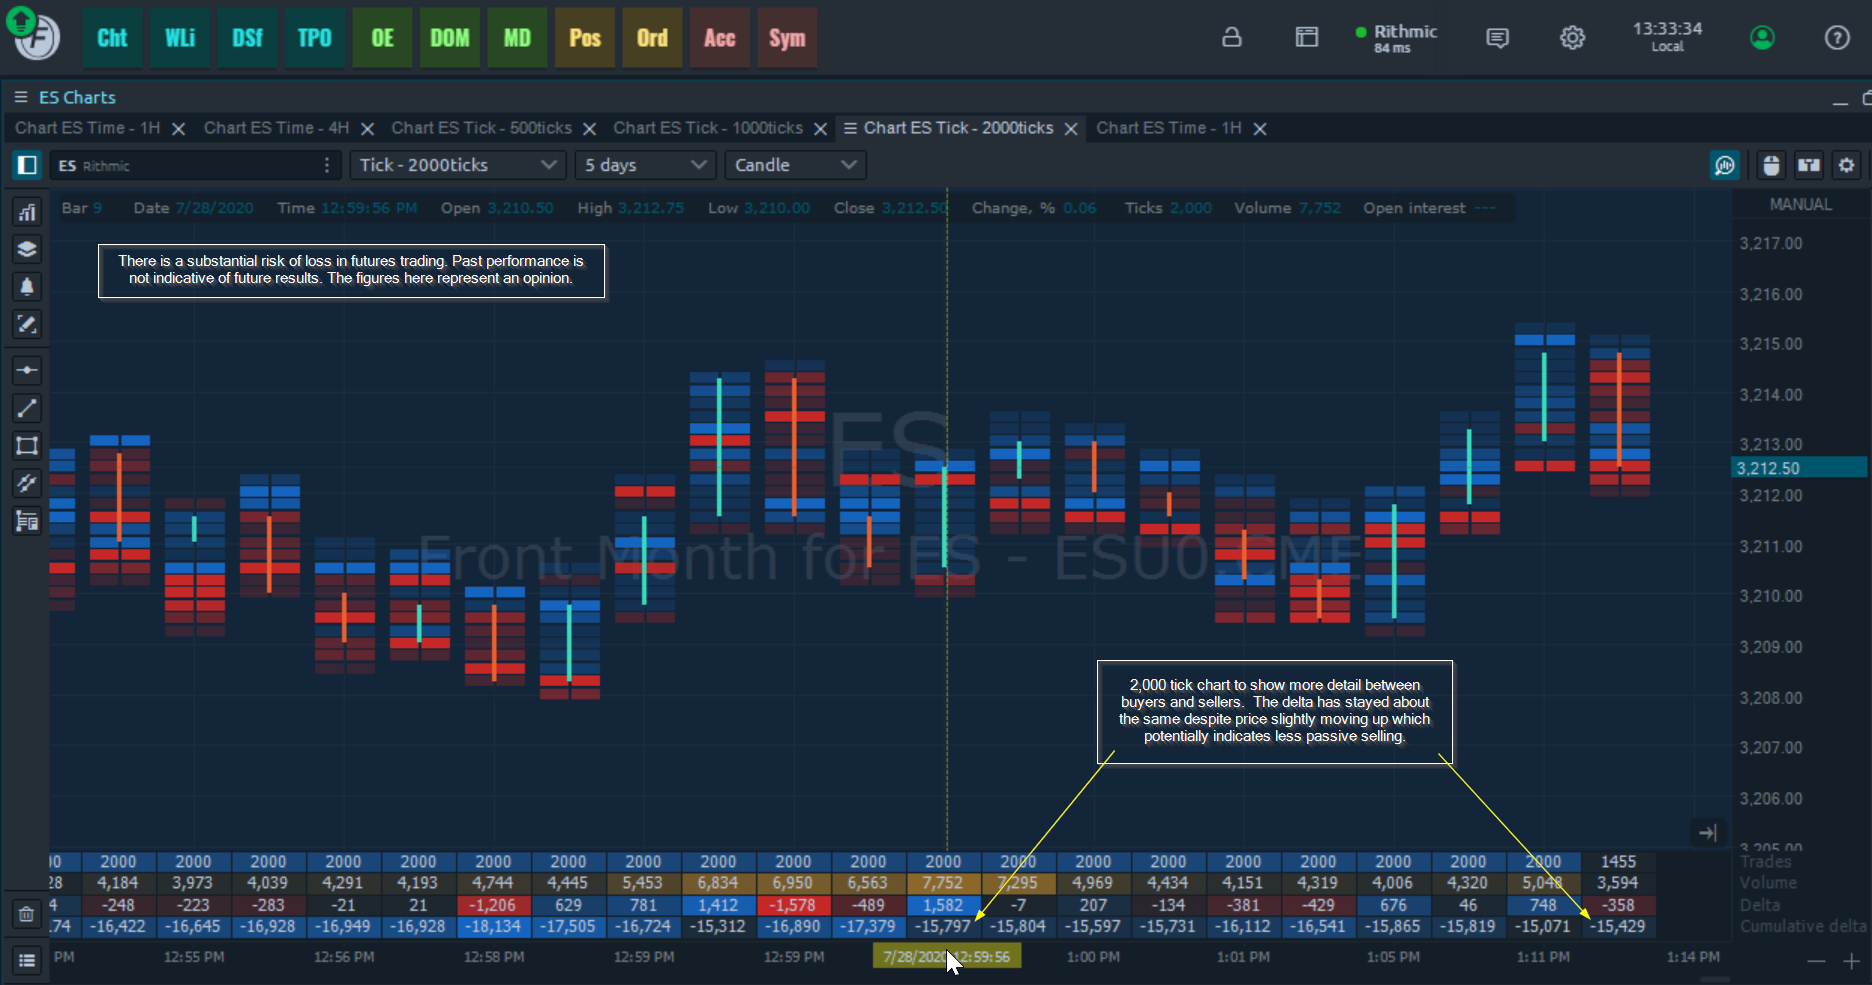
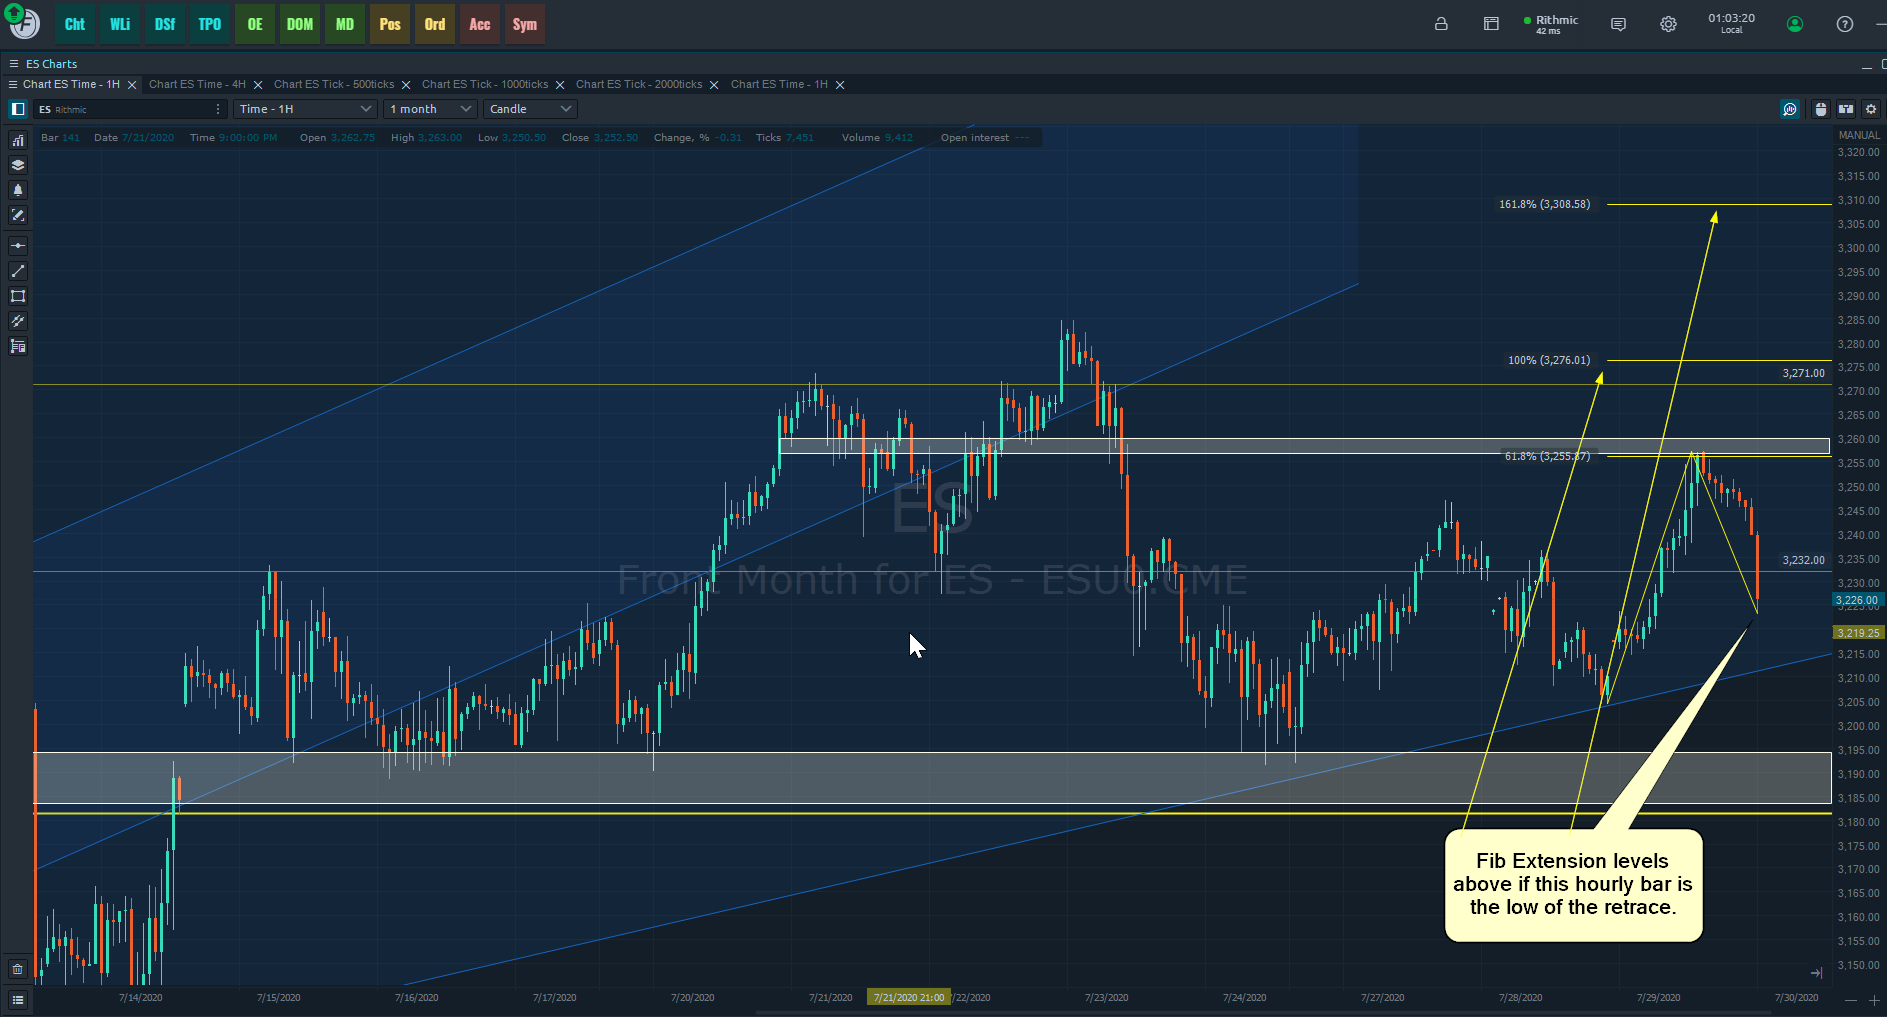
That happened on the 12th. Here’s a screenshot from the 18th:
Not as noticeable on the second one, but the same mechanics were present.
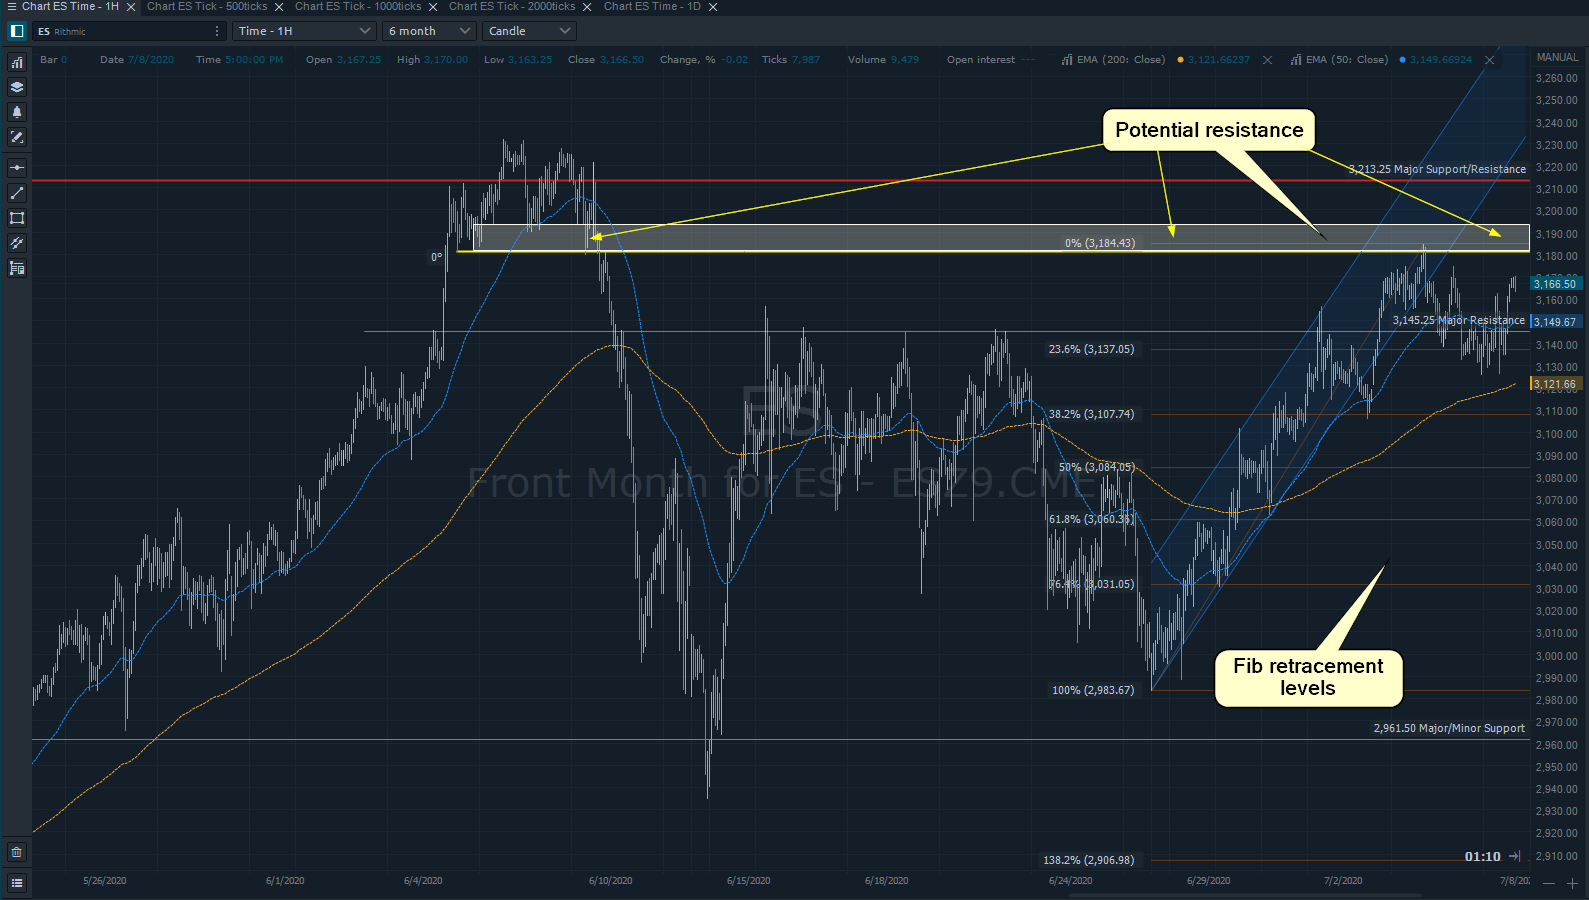
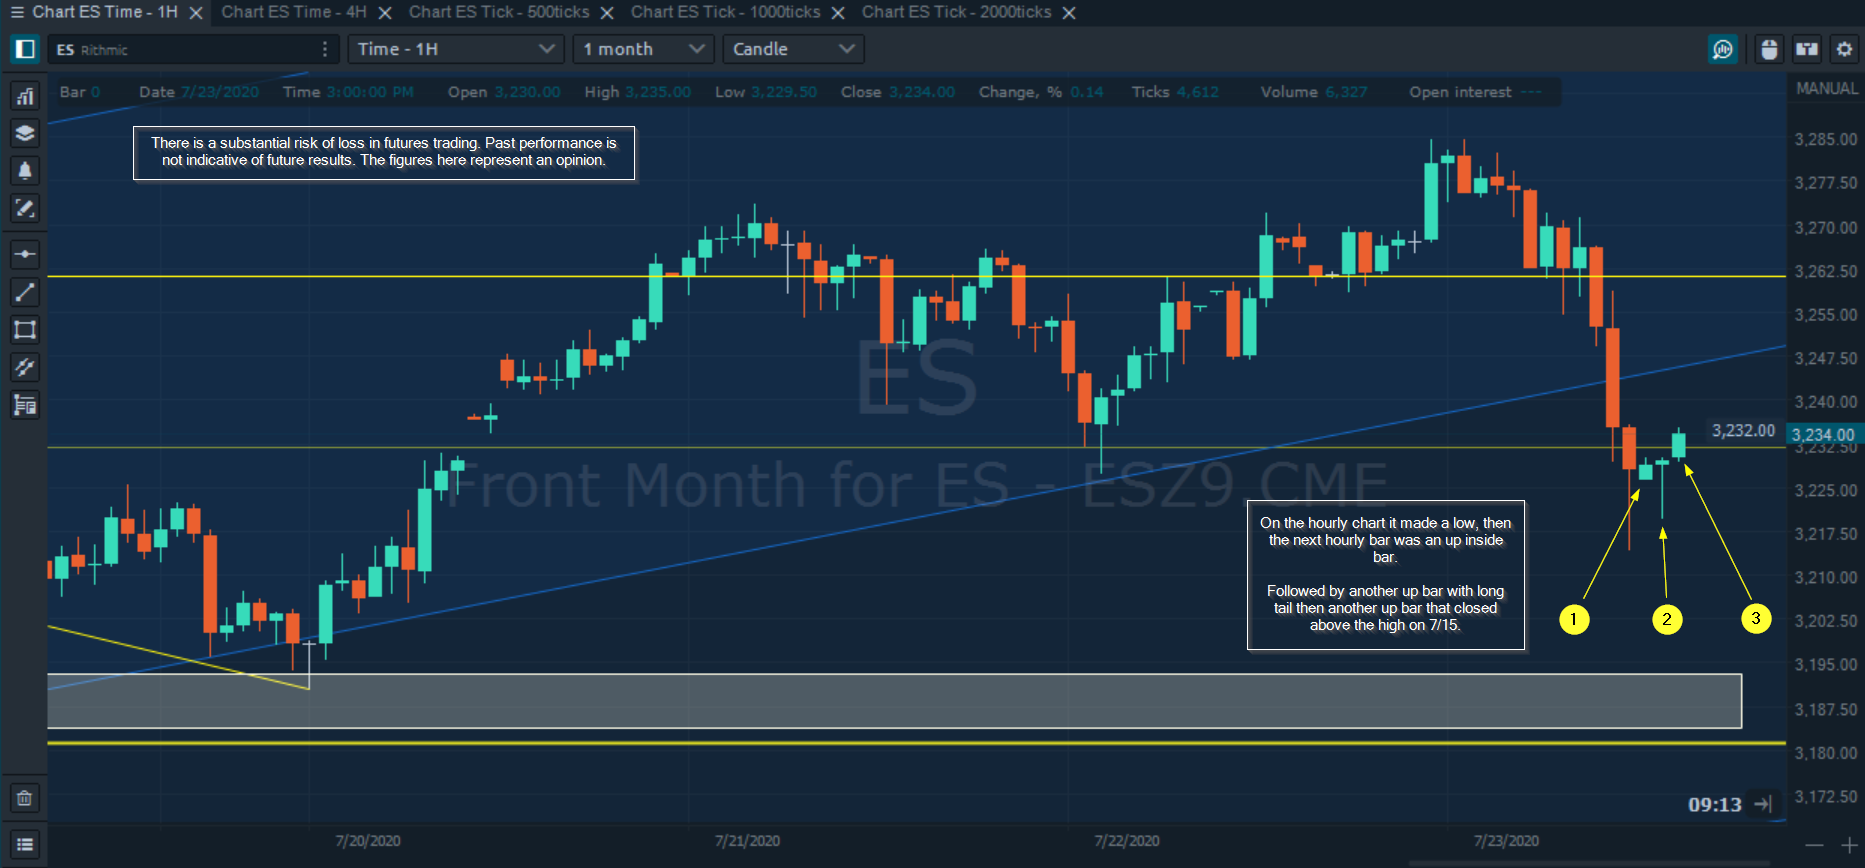
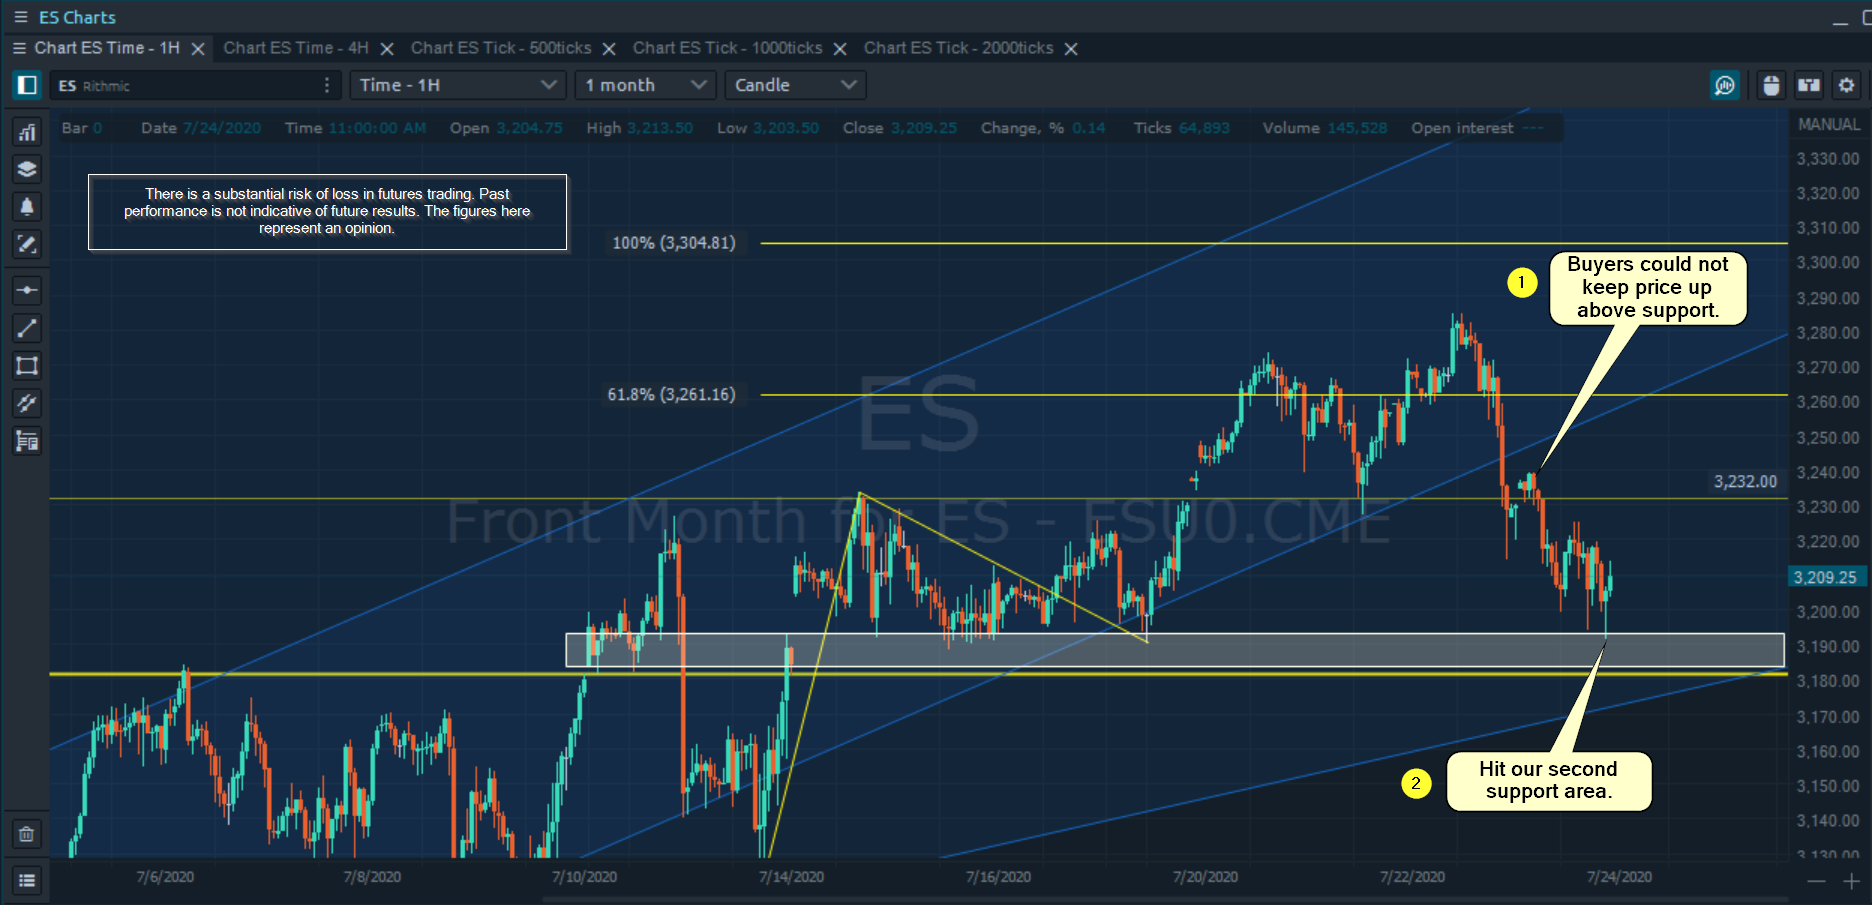
What do you see here?
If you were long do you like what you see? How about if you’re short?
If you have questions about this chart I’d love to answer them. It’s my go to.
There is a substantial risk of loss in futures trading. Past performance is not indicative of future results. The figures here represent an opinion. The placement of contingent orders by you or broker, or trading advisor, such as a “stop-loss” or “stop-limit” order, will not necessarily limit your losses to the intended amounts, since market conditions may make it impossible to execute such orders. Please conduct your own due diligence if Futures are an appropriate instrument for you.