Hello Traders,
For those of you that use Sierra Chart as your primary trading platform, you will know that platform is ever-evolving and constantly being updated. Sierra Chart contains thousands of features and customization options, ranging from minuscule user-interface options to customizable, expansive indicators and technical studies. At the end of the day, Sierra Chart likely has a feature you’re after in one form or another. With so many updates, it is likely a sought after feature has already been implemented without you’re knowledge if you’re not constantly checking the Sierra Chart Change Log. For that reason, we decided to make this post for our Sierra Chart users to keep you up to date with features that have been implemented to the platform over the course of 2019.
To keep things organized, we will attempt to group notable updates in categories. For example, for those interested in studies added over the course of 2019, please take a look at the Indicators section. Please keep in mind that there are some features that overlap multiple “categories”, you may find an indicator in the updated chart section and so forth.
Please keep in mind we will do our best to explain these changes along with instructions on how to implement them with patch notes directly from the Sierra Chart developers. If anything mentioned below needs further explanation, feel free to leave a response so we can assist you.
To start off this discussion, lets kick things off with Sierra Chart Indicators/Studies.
Indicators
The following indicators have been added to Sierra Chart over the course of 2019. You will find these in the studies section. These can be found by navigating to Analysis > Studies > Studies Available:
• HL Volatility
• Normalized Volume
• Gann HiLo Activator
• DeMarker Oscillator Type I
• DeMarker Oscillator Type II
• Rate of Change Oscillator Type I
• Rate of Change Oscillator Type II
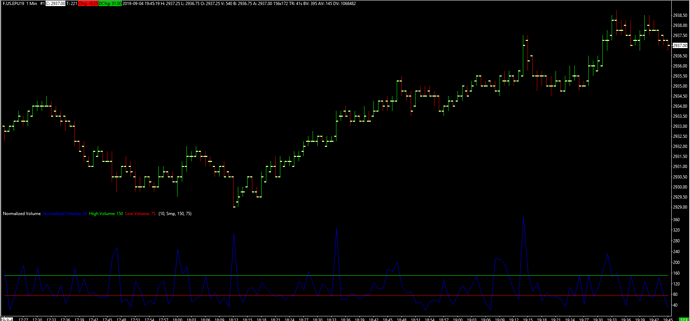
Example of the default Normalized Volume Study:
— Updates to Market Depth Historical Graph Study —
Please keep in mind you will find the Market Depth Historical Graph Study within the Studies section above. You can access the new updates below by clicking on the Settings button or by activating the Show Settings box before applying the study.
• Selection of what to display after last bar – Maximum or Last depth
• Added additional coloring options to give 4 Bid and 4 Ask colors
• Added options for where the quantity numbers in the bars could be displayed
• Added option for Percentage of Maximum Depth below which no coloring occurs
• System does not automatically fill in data where no depth data has been recorded. Option to fill in this data is available using “Extend Last Known Depth”
• New option to color based on Actual values rather than percentages
• New option for minimum color settings to allow for better definition of colors
• Added option to allow the user to define the number of levels that are displayed
— Bid and Ask Depth Bars —
- The calculations necessary for the Bid and Ask Depth Bars study is now done at a low level. Time and Sales data is no longer used. There are now 100% accurate generated Open, High, Low, Close bars for this study. And all of the recorded market depth data is now persistent when Sierra Chart is restarted and when a chart is reloaded.
— TPO —
-
New TPO Profile Study Inputs to display the TPO fields of data which are displayed in the Chart Values window, above or below TPO profiles.
-
New TPO Profile Chart calculations displayed in the Chart Values Windows.
-
Added support for peak and valley lines on the Volume by Price study when used with the TPO Profile chart study.
-
New TPO Profile Study Inputs to display the TPO fields of data which are displayed in the Chart Values window, above or below TPO profiles.
For those of you that prefer a video walk through, take a look at our video covering Sierra Chart Patch Notes for Charts in 2019:
Charts
Charts are the bread and butter of Sierra Chart, there have been quite a few updates that have been implemented recently to improve performance and make charts more reliable. The following updates are spread throughout the platform in one location or another. For further explanation on the following updates, please take a look at the video for a visual guide or ask specific questions in a response to this post.
Chartbook Groups
• Allows the opening of multiple charts that are grouped together, at one time. This feature is perfect for those traders that trade multiple contracts within the same exchange/category/asset class. For example, a trader may create a chartbook group full of charts containing contracts with Metals only. The same trader may also create a new chartbook group for indices and so forth.
For those interested in ChartBook Groups, feel free to take a look at the following text guide: Chartbooks (Workspaces) - Sierra Chart or watch the video below:
— New setting —
Chart >> Chart Settings >> Advanced Settings 3 >> Number of Levels for Bid/Ask Depth Calculations. This is used to control the number of levels used in the calculations for the Bid and Ask Depth Bars study.
• New scroll wheel options have been added to General Settings supporting scrolling of the vertical price scale in a chart by your computers scroll wheel.
• Improved drawing tool performance
• Millisecond time stamping for market depth data for smooth replays and accuracy.
• Added new coloring and user decision making options for when to reset Recent Bid/Ask depth data
• Corrected a problem during a chart replay when using the Combine Trades into Original Summary Trade option in the Chart Settings where some trades would not be included in the chart during a replay. This can be observed because the volume is a little less per bar.
User Interface Updates
Sierra Chart’s user interface is arguably the largest learning curve when it comes to using the platform. The user interface is filled with hundreds of features that are hidden behind assorted tabs and windows. For this reason, it may be easy to miss a new feature that has been added. The following updates have been implemented into Sierra Chart over the past year:
— Revamped Trade Activity Log —
• Faster, more interactive user interface
• Better saved data functionality
• Overall improvements in the behind-the-scenes processing
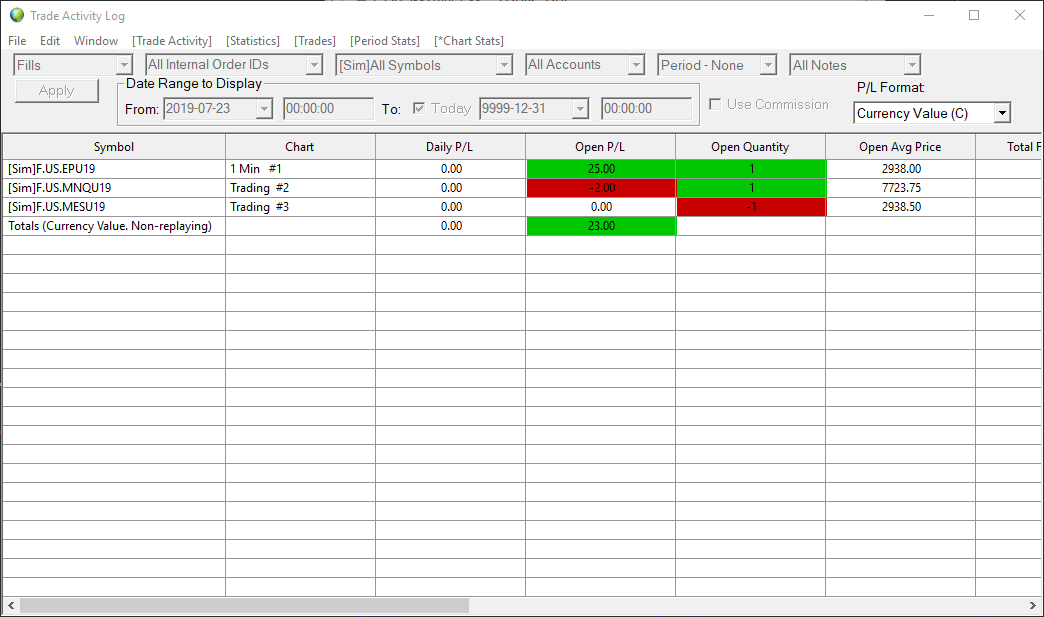
Example of revamped Trade Activity Log - Chart Stats:
– Sierra Chart Order Routing Service —
• Works with Trading Technologies for order execution
• Data provided by Sierra Chart
• Triple redundancy
• Support for multiple trading accounts at different clearing firms
• Custom Calculated Symbols – allows for user to define a custom symbol using standard arithmetic operators in combination with existing symbols
• Allowed for identical orders to be placed for accounts held by the same user
• New Symbol Settings dialog window along with changes to the underlying processing of symbol settings, that allows for easier navigation and will not override existing customized symbol settings.
• Denali Real-Time Exchange Data Feed - New data feed for the CME Group of exchanges with support for 500 levels of market depth.
• Improvements with CQG market data time stamping.
Thank you for taking the time to read through this post. We hope that you found this helpful or found at least one new feature that has been added through 2019 that you were not previously aware of. We plan on continuing to update this post through the end of the year, so for those of you reading at the time this was created, feel free to refer back at a later date with new updates.
For those users who have not tried Sierra Chart yet, but are interested, you can sign up for a 2 week free trial powered by the Rithmic data feed here: Sierra Chart Free Demo | Teton Order Routing | Optimus Futures
For Sierra Chart tutorials, videos, and walkthroughs check out our Sierra Chart Youtube Playlist: https://www.youtube.com/playlist?list=PLOGjoJXp0cmpaY-rXK1FsEc5a2QRqk3tc
For our Sierra Chart FAQ text guides, refer to this link: Trading Platform Guides - Help Center
Thanks for your time,
Optimus Futures Support ![]()


