How and where do I access a running Total Volume for a session, and is there a study I can add that will give me various parameters of volume Delta?
2 Likes
Hi @eleven48,
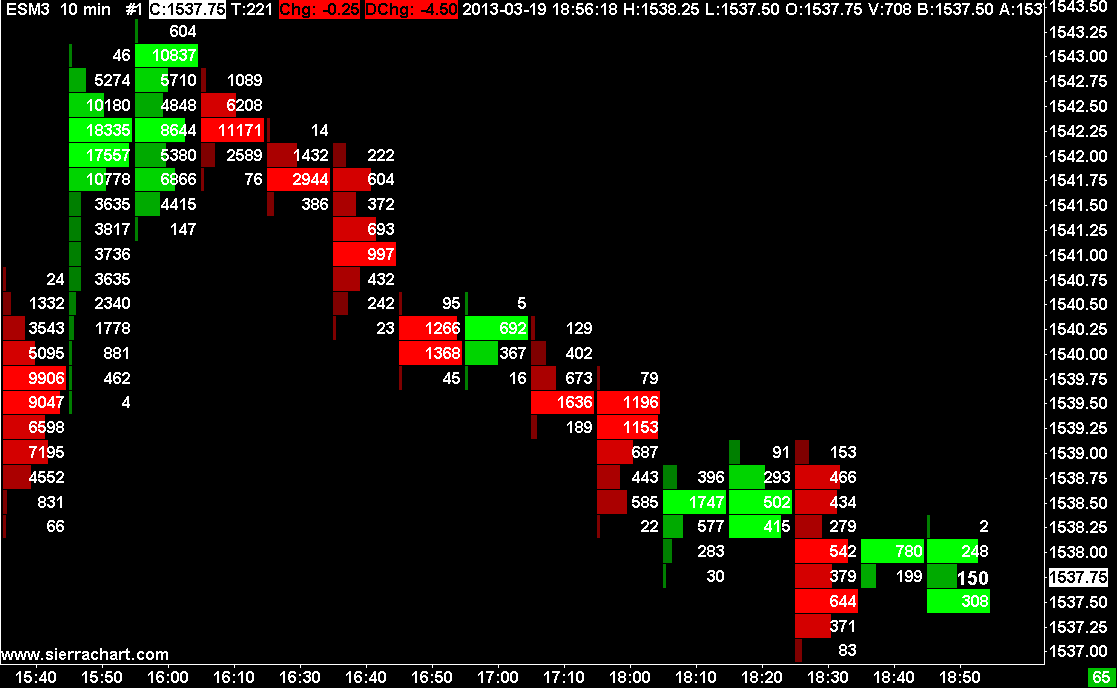
I believe the study you are looking for is the Volume by Price study which should be set to 1 Bar for each profile combinited with the Numbers Bars Study which will create an image similiar to the one shown below:
As for your question pertaining to the running total volume for a session, you should be able to accomplish this by opening an Intraday chart with the storage time unit set to 1 tick. After opening this chart, apply the Volume study to it. Running volume for the session will be displayed in its own separate portion of the chart at the bottom of the window.
Let me know if this is what you were looking for,
Jake
Optimus Futures Support 
2 Likes
Hi Jake, thanks for your response. The volume study gives me a running bar by bar number, which is useful, and which I already have on my main chart. But it doesn’t show me the session total volume, which I’d like to see for potential activity (higher volume generally equals more activity/volatility). Some platforms have the total volume as a running number on the DOM, but I don’t see how to add this in SC. For the Delta value, this is one way to do it, but it would change the nature of my chart. I’d like to have the delta in a study in its own section of the chart like the volume study. Does SC have this?
1 Like
To further clarify, I’m looking for something like a delta table with net up or down values for each bar that I can put directly below the chart.
2 Likes
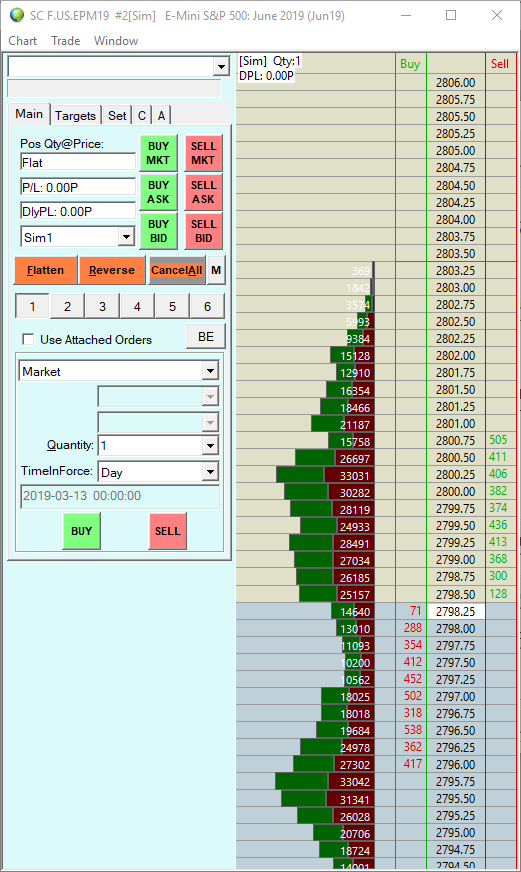
I’m not entirely sure if you can put a running total of the volume in the market on Sierra Chart although it can be configured for each price level, but if you were looking for a visual display of volume on the DOM as shown in the picture below, feel free to follow the steps I have listed:
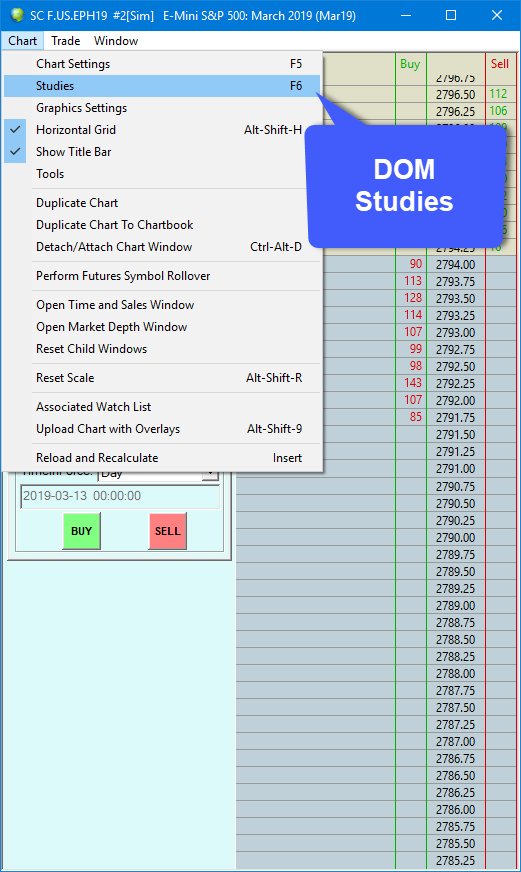
To do this first open a DOM, then navigate to Chart > Studies as shown below:
This will Only display studies that are available to the DOM. There are only about 6 available. I only added the Volume by Price study to accomplish the DOM posted in the reply above.
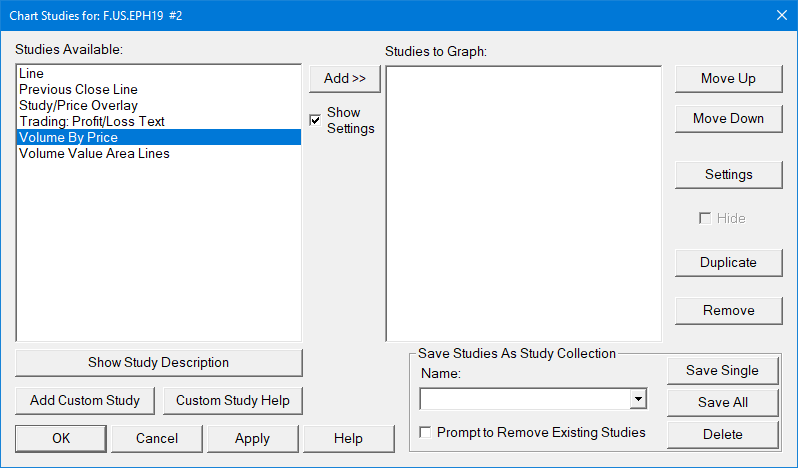
Once you add the Volume by Price study :
- Set Ticks per Volume Bar field to 1.
- Set Volume Graph Period Type field to From Session Start Time to End .
- Set Maximum Volume Bar Width Type field to Window Width .
- Display Volume in Bars field to Total Volume .
- Finally, to align the Volume Bars to the right side beside the trading columns on the right side of the Trade DOM as shown in the screenshot, set the Right Align Volume Bars field input to Yes .
I’ve highlighted the necessary fields below to accomplish the look of the DOM you seem to be looking for. Please only focus on these fields. Please make sure to click the APPLY button in both the settings window as well as the Studies menu :

As for your further clarification, you may want to look into the Cumulative Delta Bars - Up/Down Tick Volume study. You may be able to have this in its own portion of a chart by using the Draw Study Underneath Main Price Graph setting within theStudy Settings window.

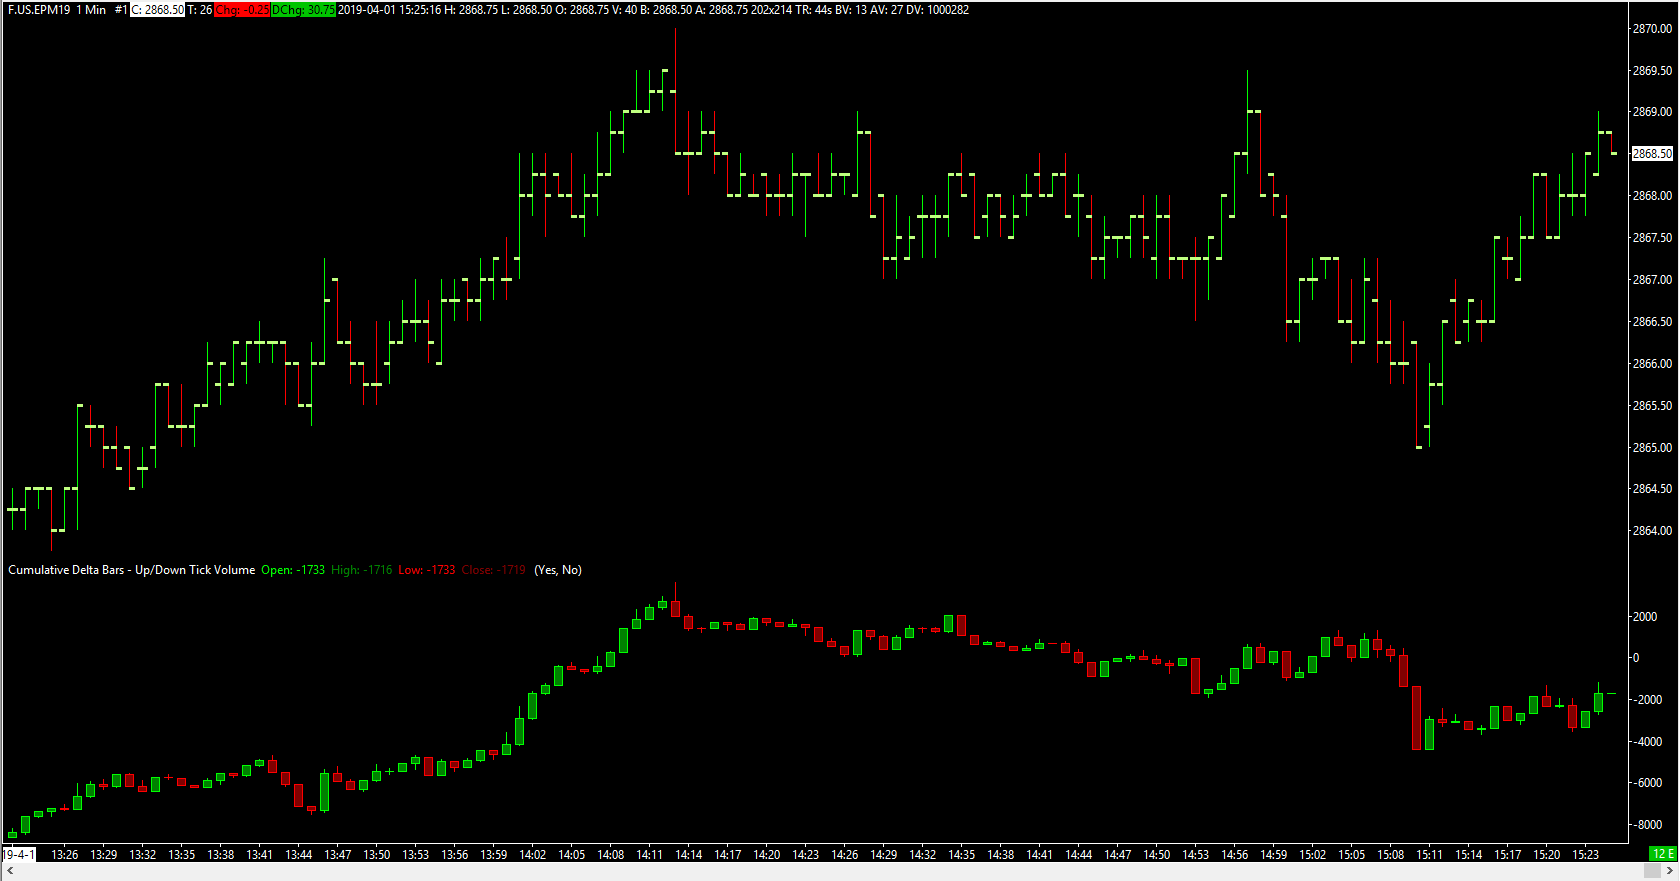
From what I can gather, it seems that the Volume By Price Study is the closest study to accomplish what you are looking for as well as the Cumulative Deltas Bars - Up/Down Tick Volume (you can see an example in the picture above).
If this doesn’t solve what you are looking to accomplish, you may need to look into upgrading to Sierra Package 5 (if you haven’t already). This contains advanced studies including TPO Charts: TPO (Time Price Opportunity) Profile Charts - Sierra Chart which you may find helpful. I just can’t seem to find a concrete answer on how to display total volume in a session other than what I posted about the DOM.
I hope this helps,
Jake
Optimus Futures Support
2 Likes
Jake,
I found a study called Cumulative Daily Volume, which as its name suggests, is a simple line graph that you can add to a separate section of your chart. It does give a running total volume number, which is what I was after.
2 Likes
Thanks for making the effort to find it! good job!
Would you be able to attach a screenshot showing where this functionality resides? just in case our users are looking for that.
Thank you,
Matt Z
Optimus Futures
For those who were wondering, feel free to take a glance at the screenshot below. This is the Cumulative Daily Volume study that was suggested by @eleven48 applied to an intraday chart for the ESM9 contract. The Cumulative Daily Volume is placed in the bottom portion of the chart, a running total volume number is listed in green in the upper left-hand corner of the study.

Thanks,
Jake
Optimus Futures Support
1 Like