Good morning Optimus Community,
Few question if I may related to sierra chart.
1.I have a Sierra chart platform and would like to add a S&P 500 Advanced decline indicator to it. Could you please advise on how is this done.
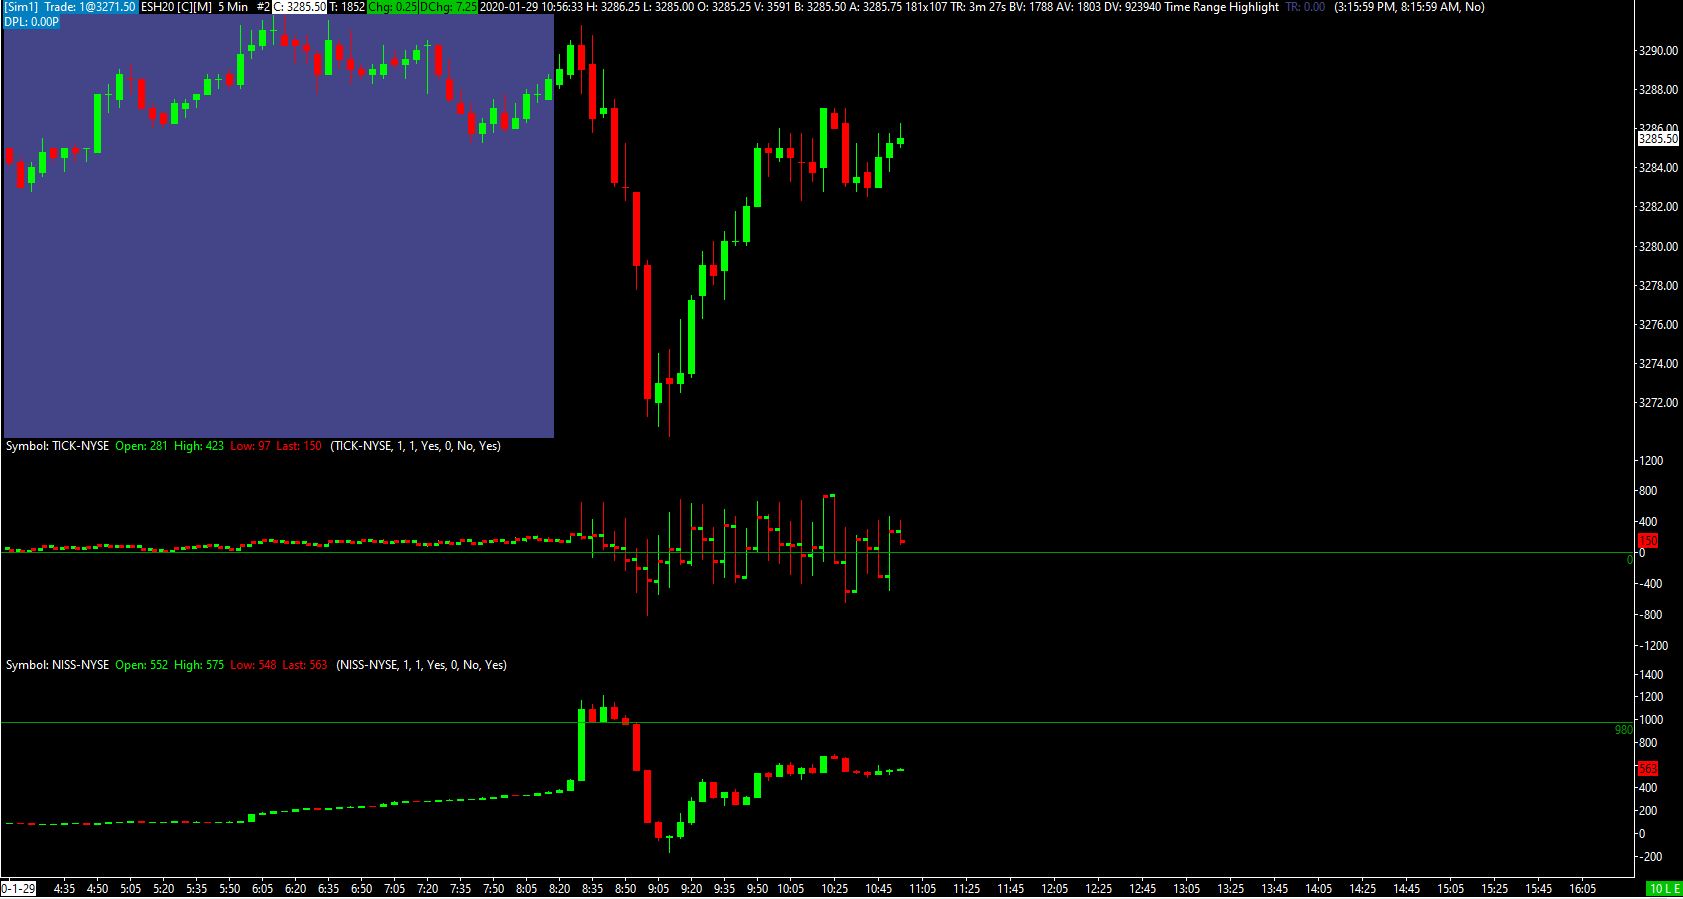
2. I had followed one of the other guides in the community to add NYSE tick and NYSE AD LINE and it looks like the attached. Is it possible to have separation (May be a line)for these indicators from the chart and also from each other. If yes. how do it do it?
1 Like
Hello @MustardSeed,
Thanks for your questions and welcome to the Optimus Futures Community Forum!
It looks like you have already taken it upon yourself to do some research through our forum and found the following post which covers how to add NYSE Tick and NYSE AD Line to your charts: How to make 'Market Stats' indicators appear on main chart as 'Studies' do - #2 by Mod-JakeM
According to Sierra Chart’s documentation, the NISS-NYSE market statistics symbol you have added to your chart is the most accurate S&P Advance Decline Line that you can add within Sierra Chart. According to their documentation, the definition of NISS is the difference between ADV and DECL . This is the symbol to use to get the Advance-Decline line.
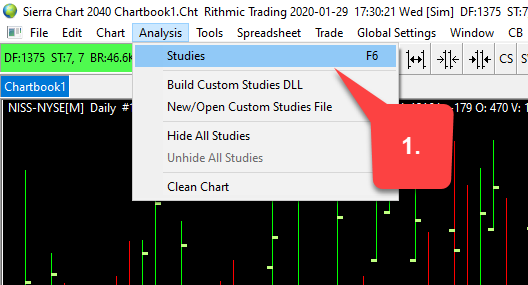
1. Now that we have mentioned the statement above, Sierra Chart also recommends adding the Advance Decline Line study to this symbol as well. You can do this by navigating to Analysis > Studies
Within the Chart Studies window, scroll down just a bit to locate the Advance Decline Line indicator. Highlight the option and then click the Add >> button to add it to your chart.
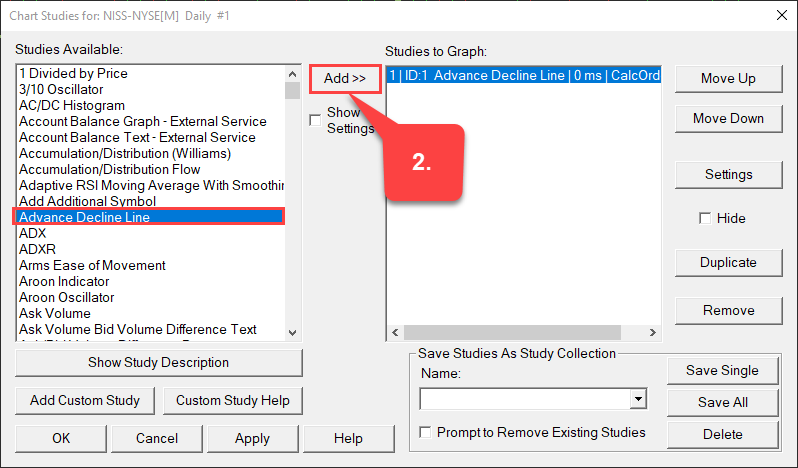
This will produce a separate area on your chart with the AD Line separated from the price action of the NISS-NYSE graph.
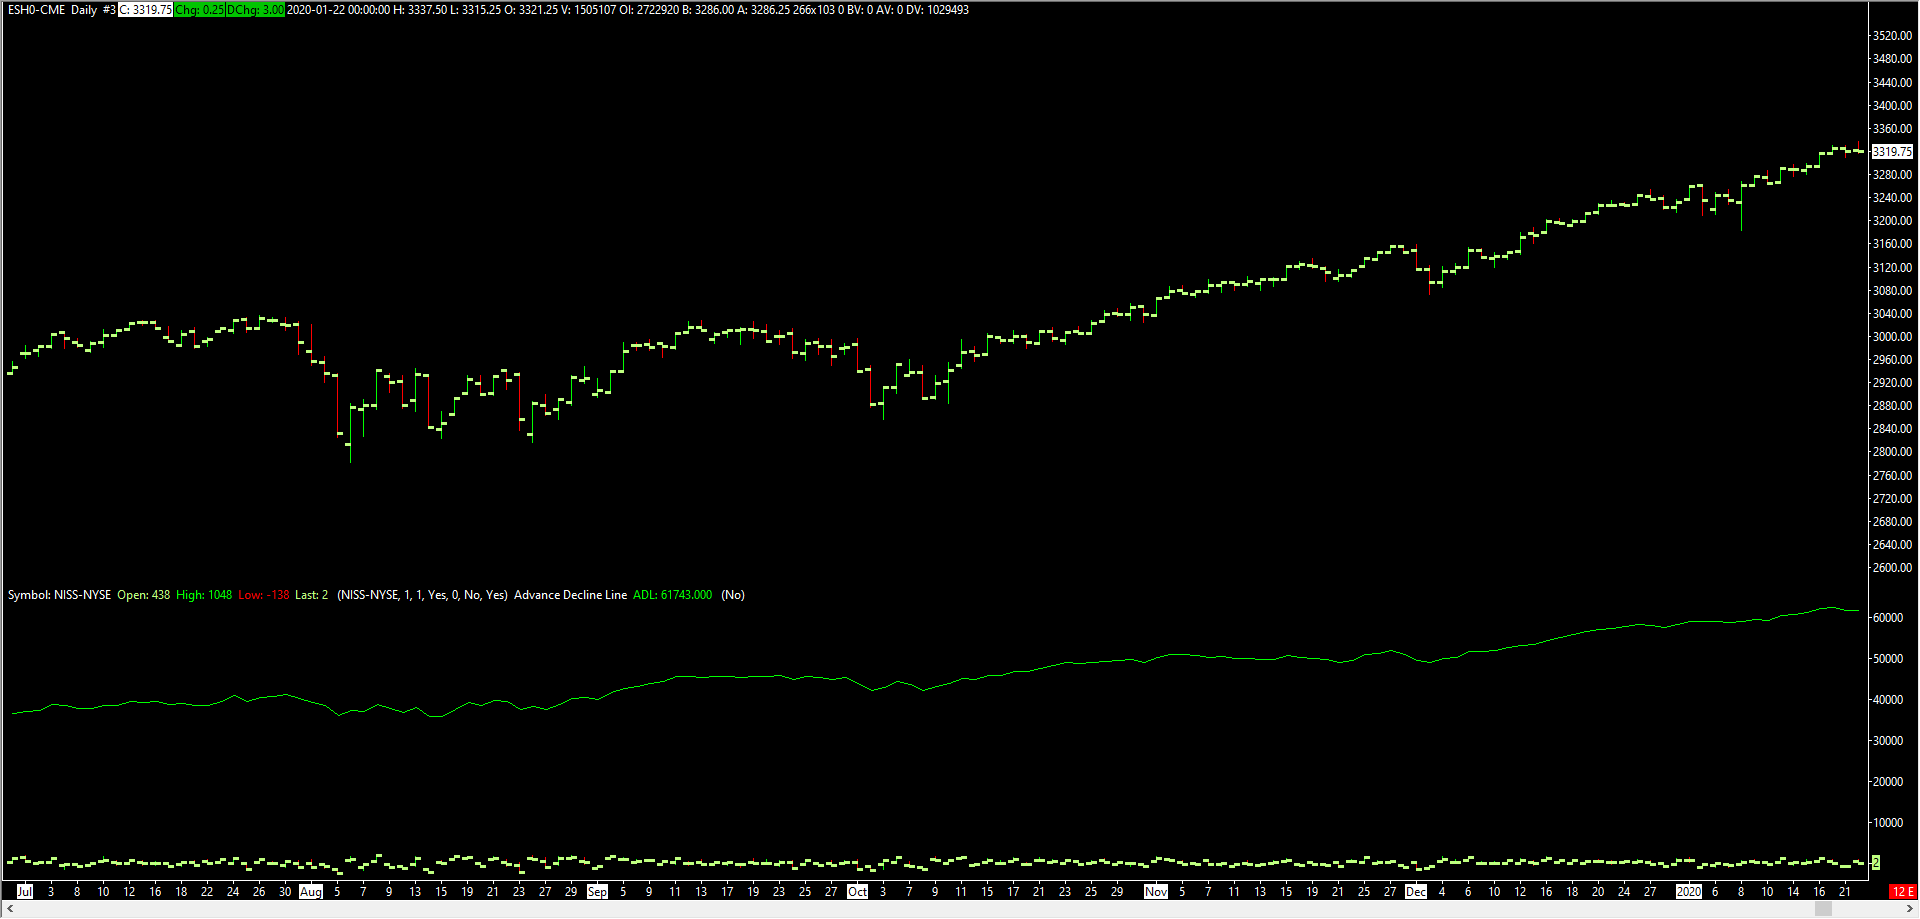
You could also configure your graph similar to the screenshot above with the ESH0 as your main price graph and then add the additional symbol study in order to add the NISS-NYSE data to the bottom portion of your graph. Once you have this configured, add the Advance Decline line study once again and open it’s settings.
Within the Advance Decline line study settings, change the Based On setting to Symbol: NISS-NYSE as shown below and also change the Chart Region to 2.

This will give you a chart similar to this:
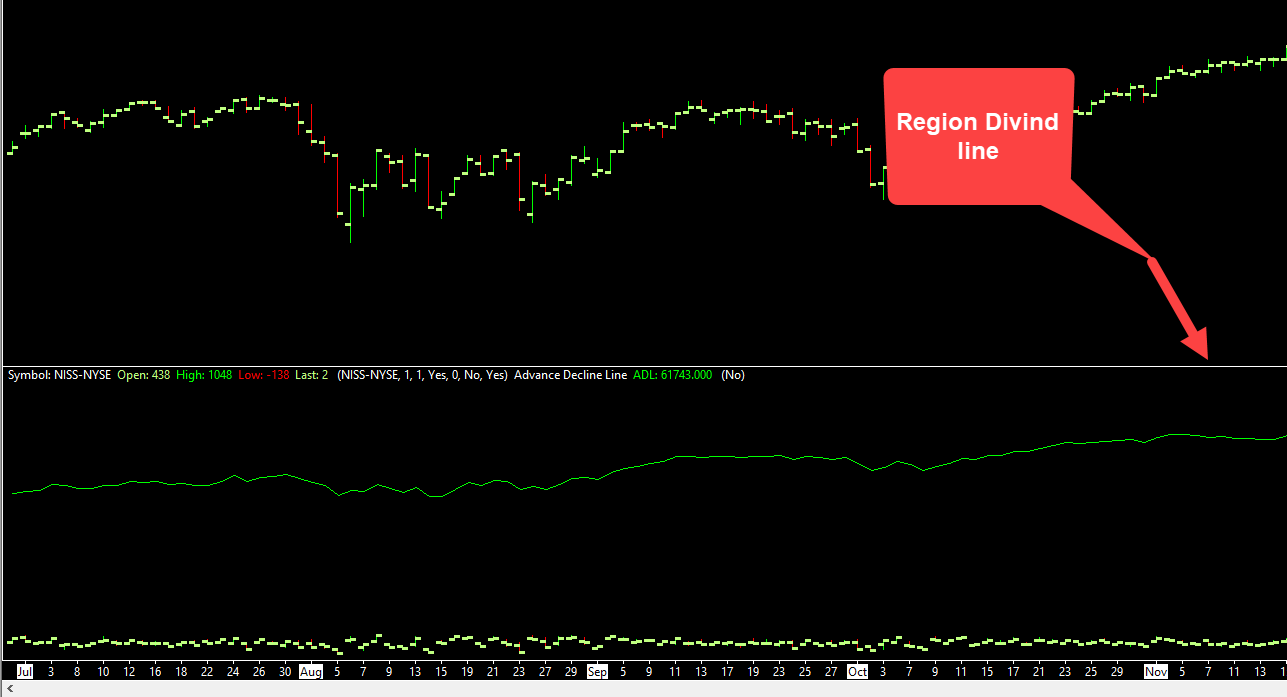
2. To answer the second portion of your question, yes, there is a way to separate the indicators from the chart. This setting is called Region Dividing Lines. Each indicator occupies their own “region”, as it was mentioned above. In the screenshot I have posted above, the ESH0 graph is considered region 1 while the NYSE data is considered region 2.
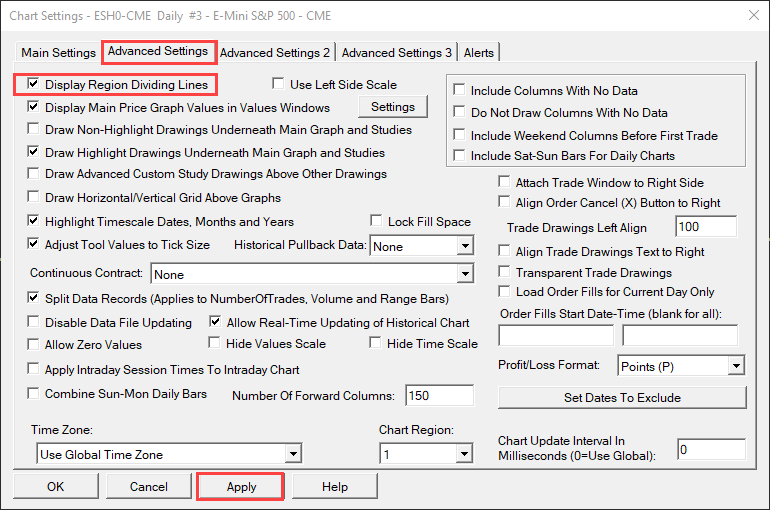
That being said, you can use display region dividing lines by navigating to Chart > Chart Settings. Once you are in chart settings, click on the Advanced Settings tab at the top of the window and then check off the first option available as shown below, Display Region Dividing Lines. Once it is checked off, click Apply:
With the Display Region Dividing Lines activated and applied your charts should now look something like this:
I hope this was along the lines of what you were looking for and found this helpful!
Let me know if you have any other questions that I can help you with.
Thanks,
Jake
Optimus Futures Support ![]()
1 Like
Thank you very much the detailed explanation on this. Appreciate very much. Just to confirm Jake, NISS-NYSE is the symbol for S&P 500? its for NYSE tick right?
1 Like
Hi @MustardSeed, you are welcome!
To answer your question, I do not believe the NISS-NYSE is the symbol for the S&P 500.
According to Sierra Chart, the NYSE = Based on the stocks traded on the New York Stock Exchange. So yes, the S&P would full under this category, but the NISS-NYSE is not solely the symbol for the S&P 500 stock.
As mentioned before, the NISS = The difference between ADV and DECL . This is the symbol to use to get the Advance-Decline line. So the combination of the two gives us the advance-decline line for the NYSE market overall. As you may have saw, there are quite a few symbols in the Sierra Chart market stats section. There are NISS/AD Line symbols for other markets as well.
I think you might actually be looking for the NISS-SP symbol found under Market Stats as shown below:
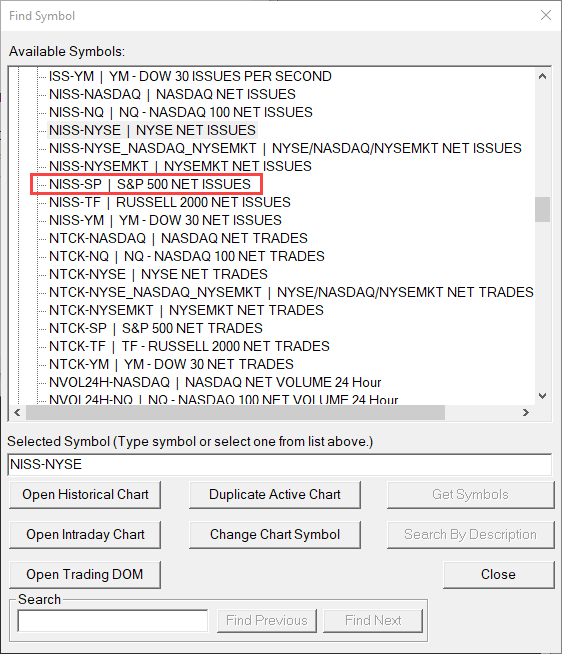
The NISS-SP is the the difference between ADV and DECL. This is the symbol to use to get the Advance-Decline line based on the stocks traded in the S&P 500 index.
Let me know if you have any further questions!
Thanks,
Jake
Optimus Futures Support 
Yes. Jake. this is what i was looking for. Thank for very much for the help and support
2 Likes