Trading plan 3/22/21 Monday.
Monday 3/22/21.
Mental prep:
I am feeling happy today, I feel rested and that my mind is clear and content.
I will observe information from the market and develop trades around my daily plan without having my emotions or bias affect how I trade. I can make great decisions and in the even a trade doesn’t go my way, I will assess what happened and if I would make the same trade again.
Depending on that outcome I will change my strategy or execution or keep it the same.
Daily plan:
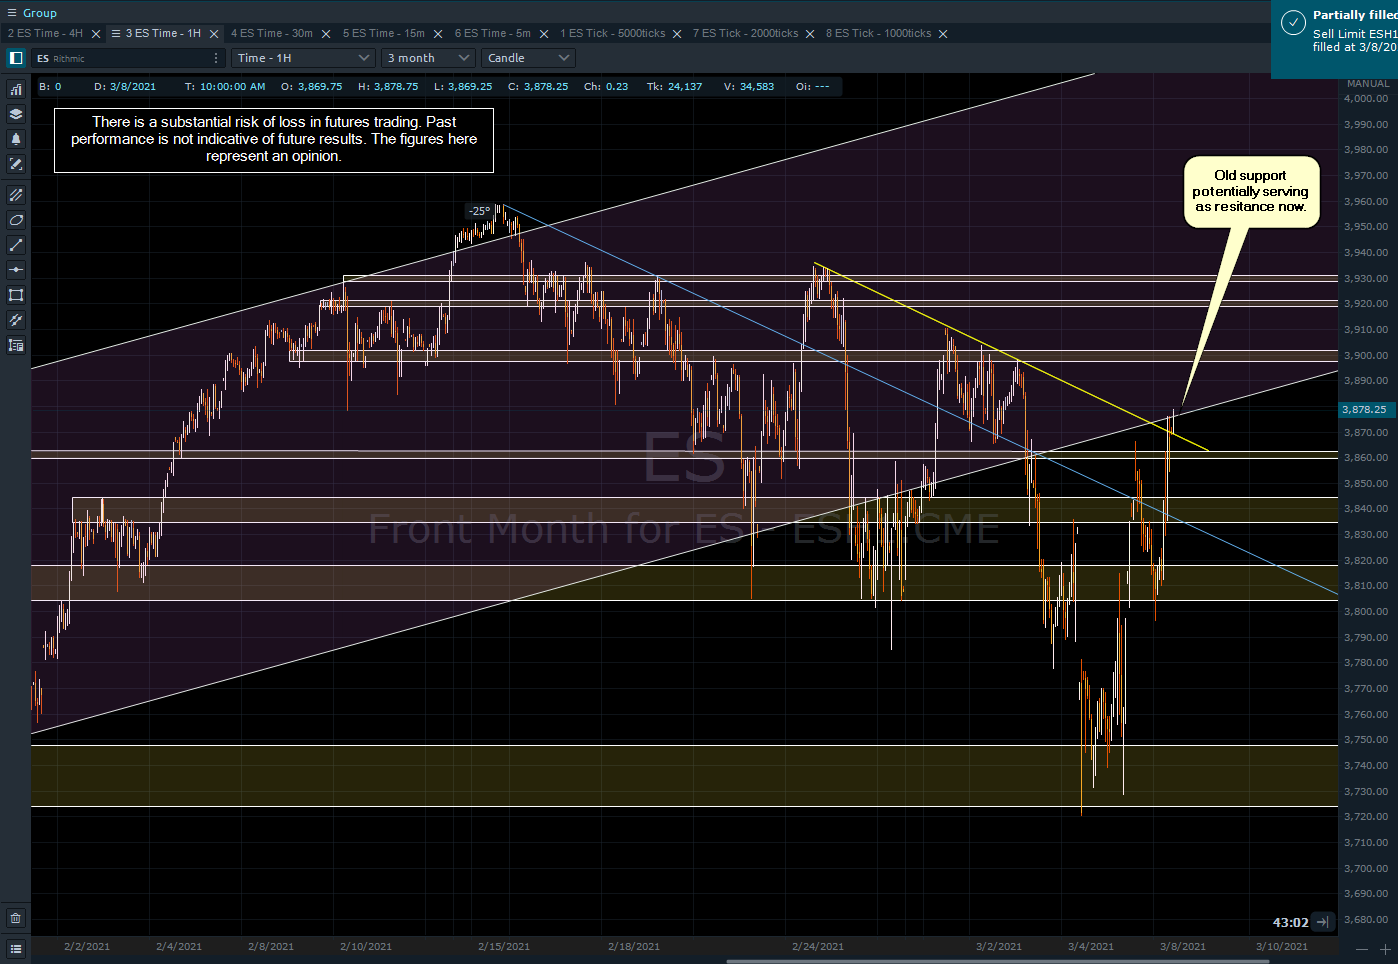
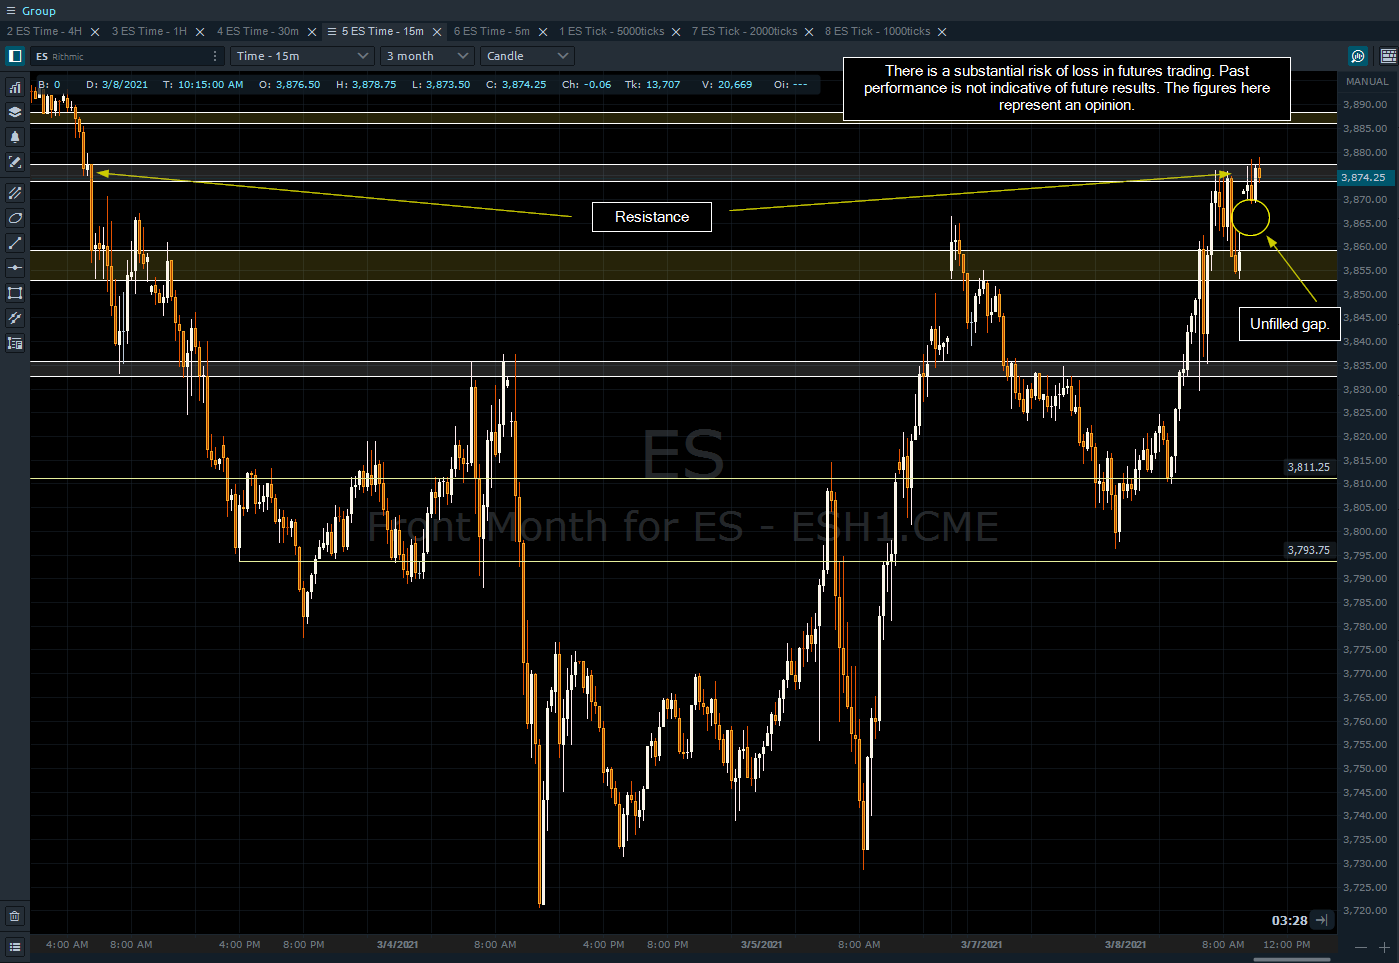
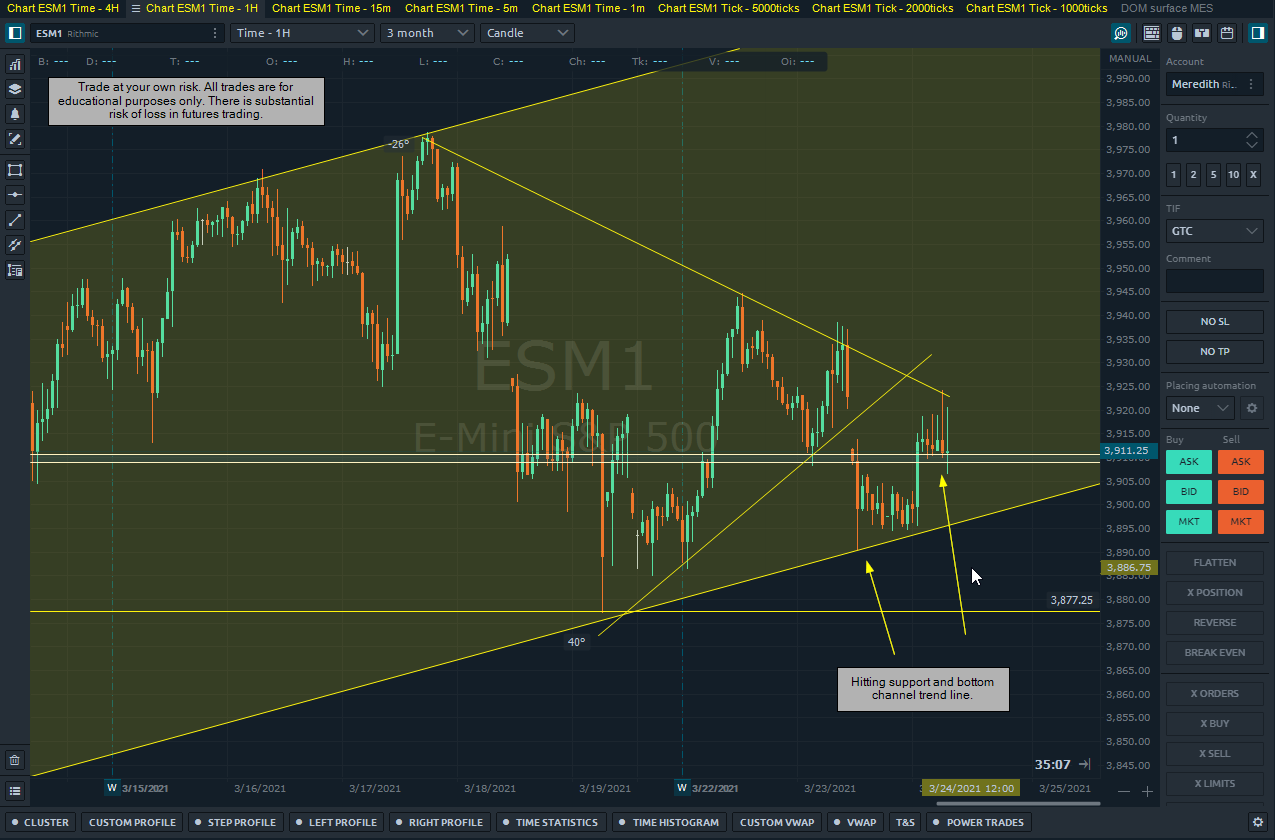
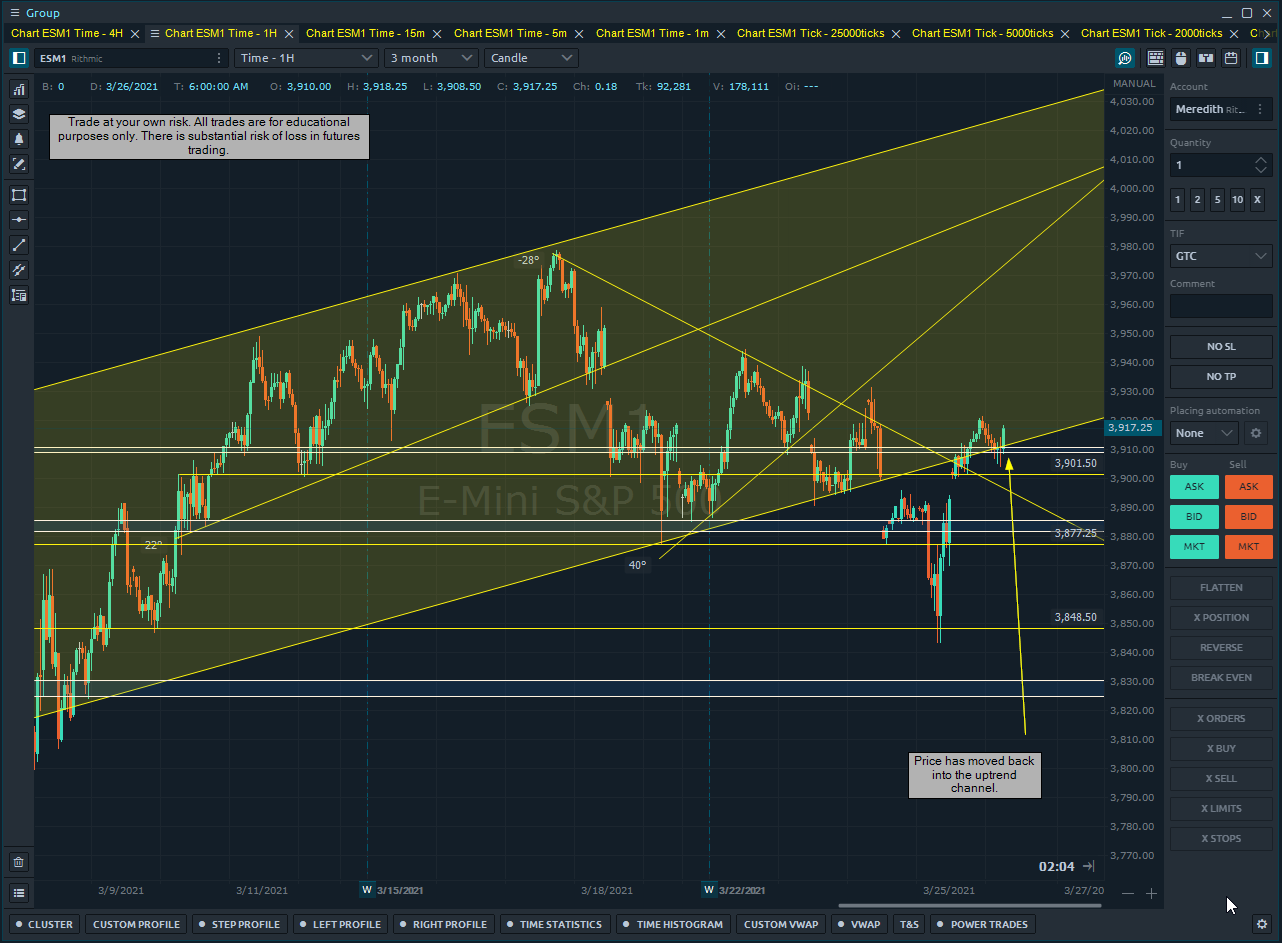
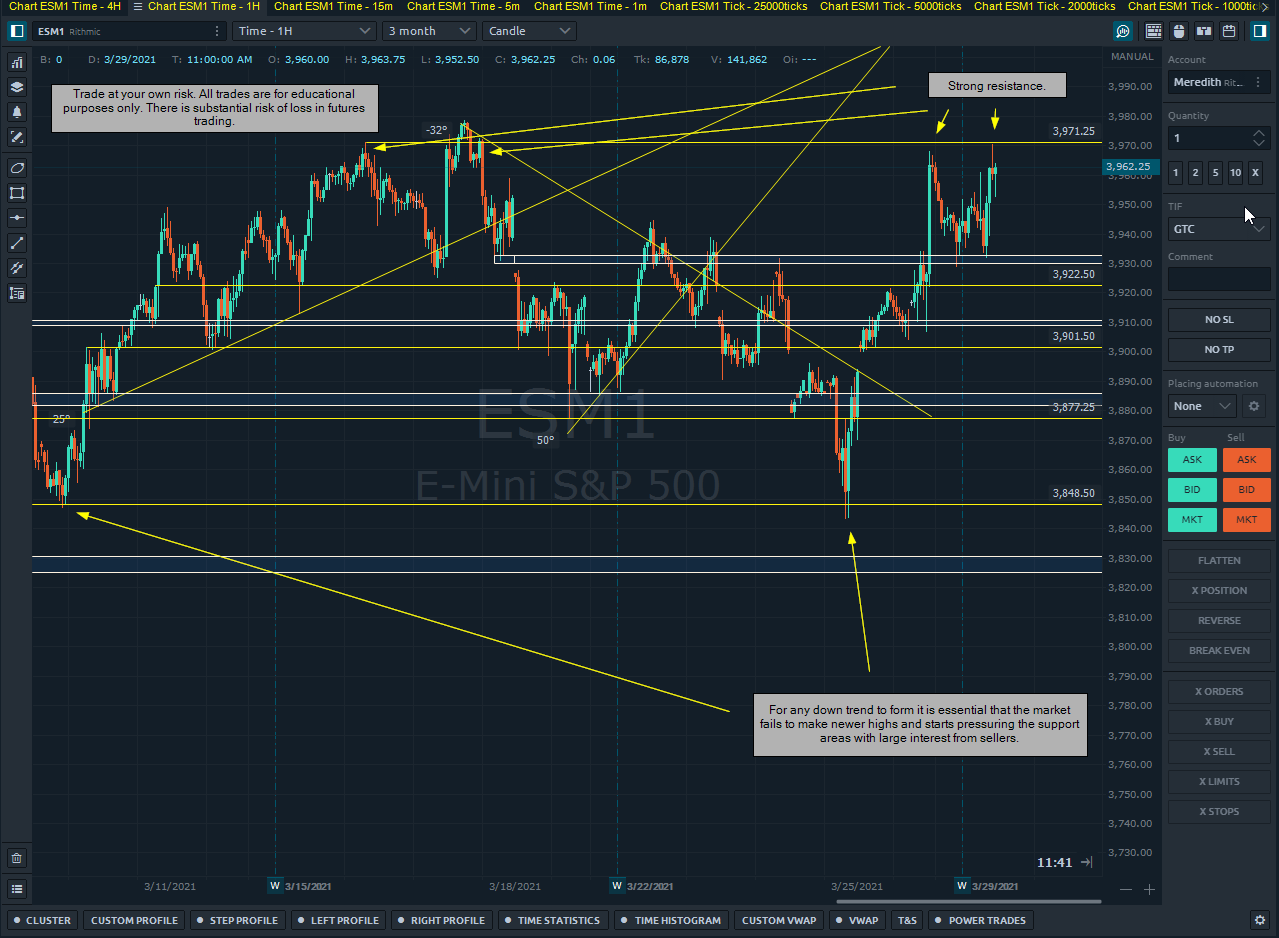
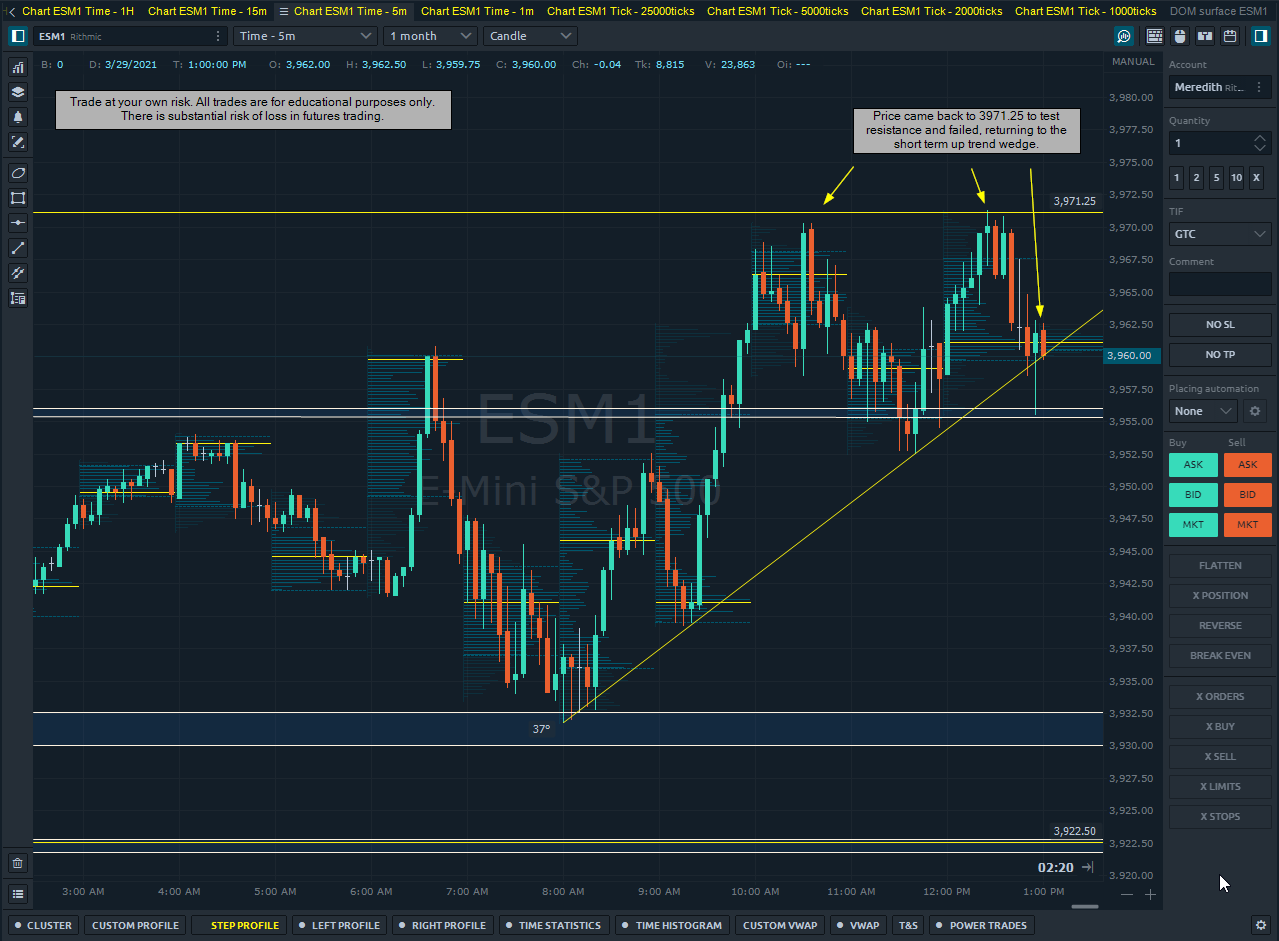
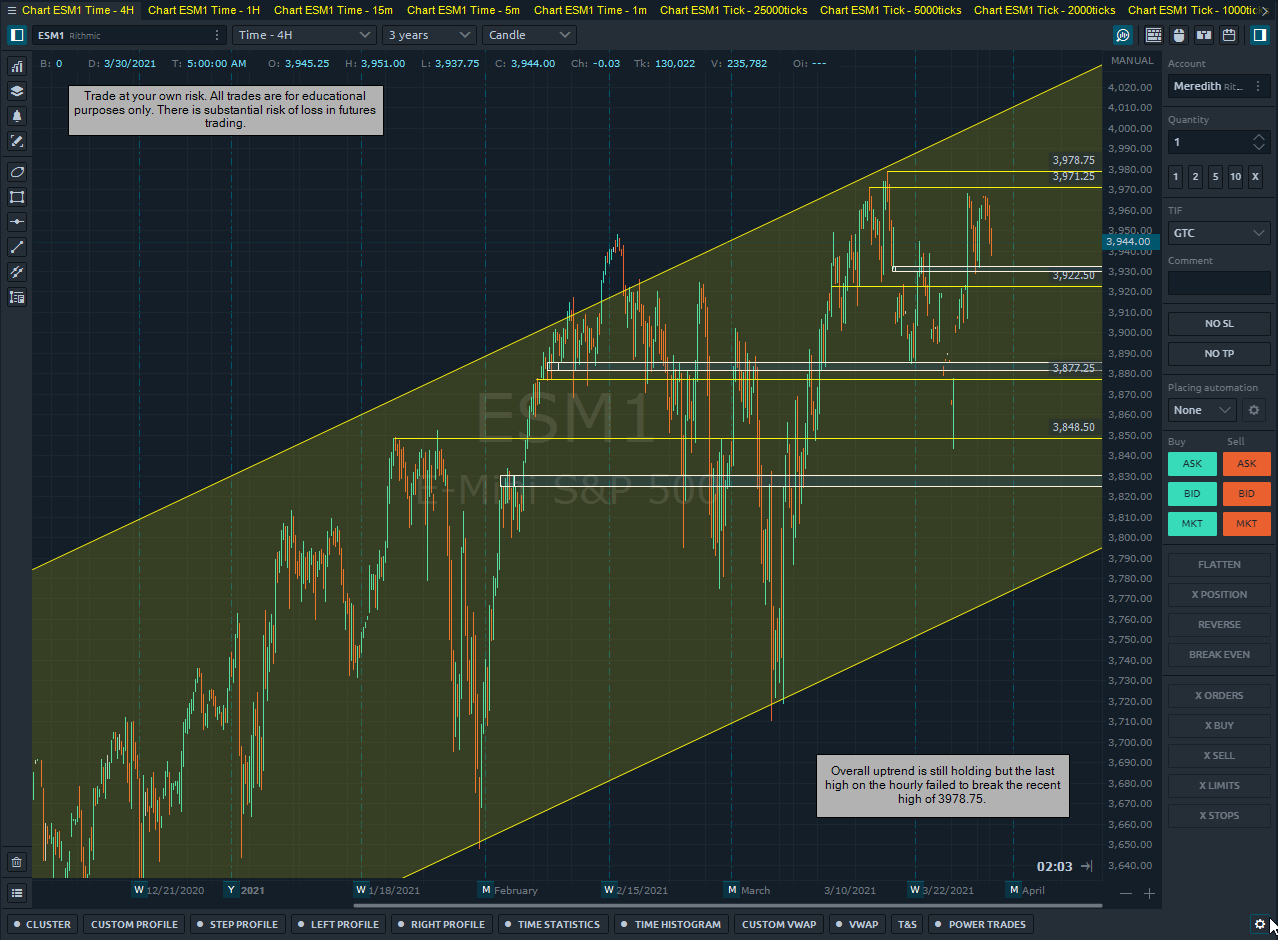
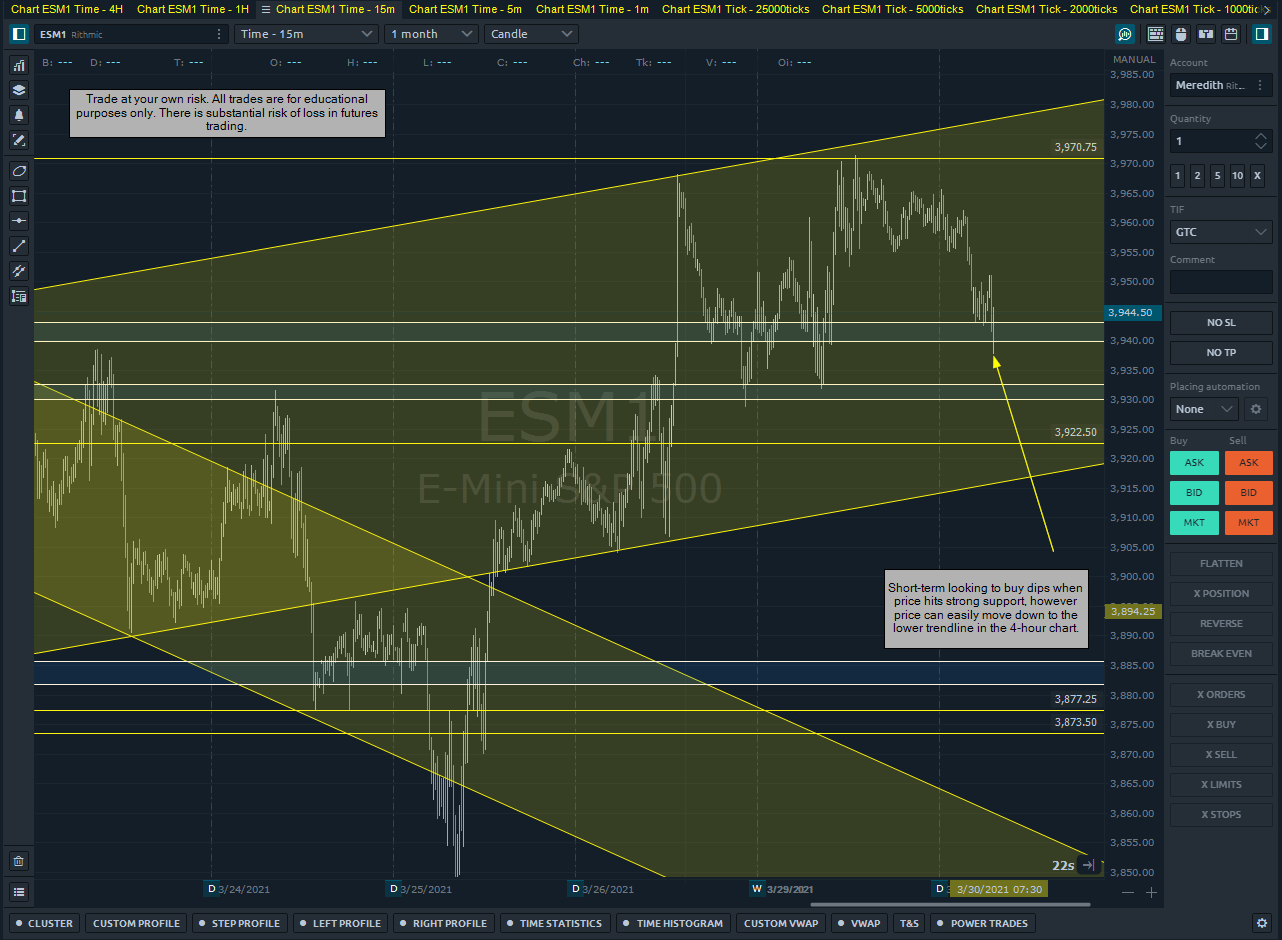
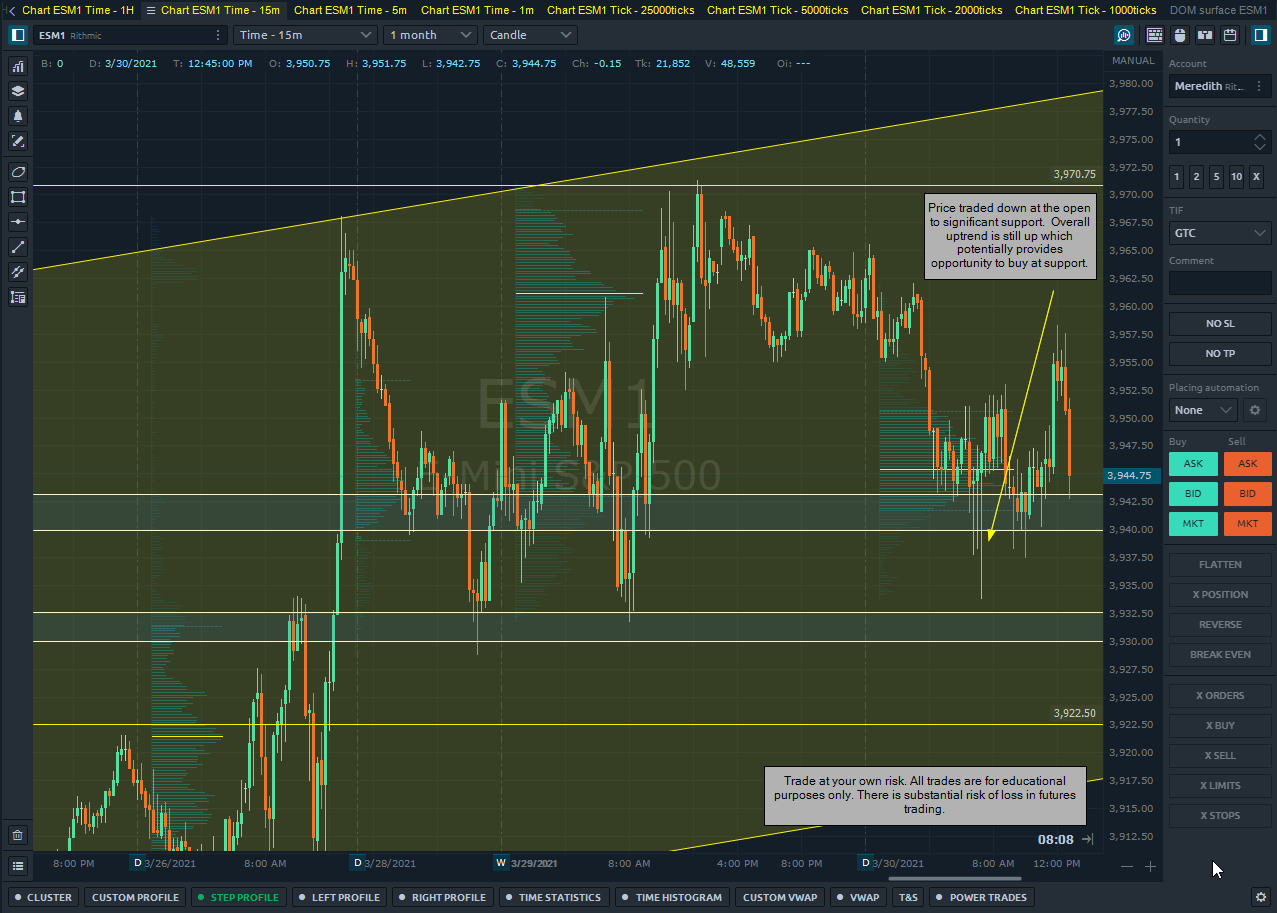
I see a range forming with no clear direction in the market besides the overall uptrend.
I’ll be looking to take advantage of quick pricing inefficiencies and focus on order flow to take quick moves out without risking too much.
I’m going to watch the 1 minute charts a bit more today as well as the order flow that coincides with that time frame on my 2000 tick chart.
The one big thing I’m also focusing on is holding my trades longer which will force me to really pick my spots and be aware of when I choose to enter the market.
Market and self-assessment:
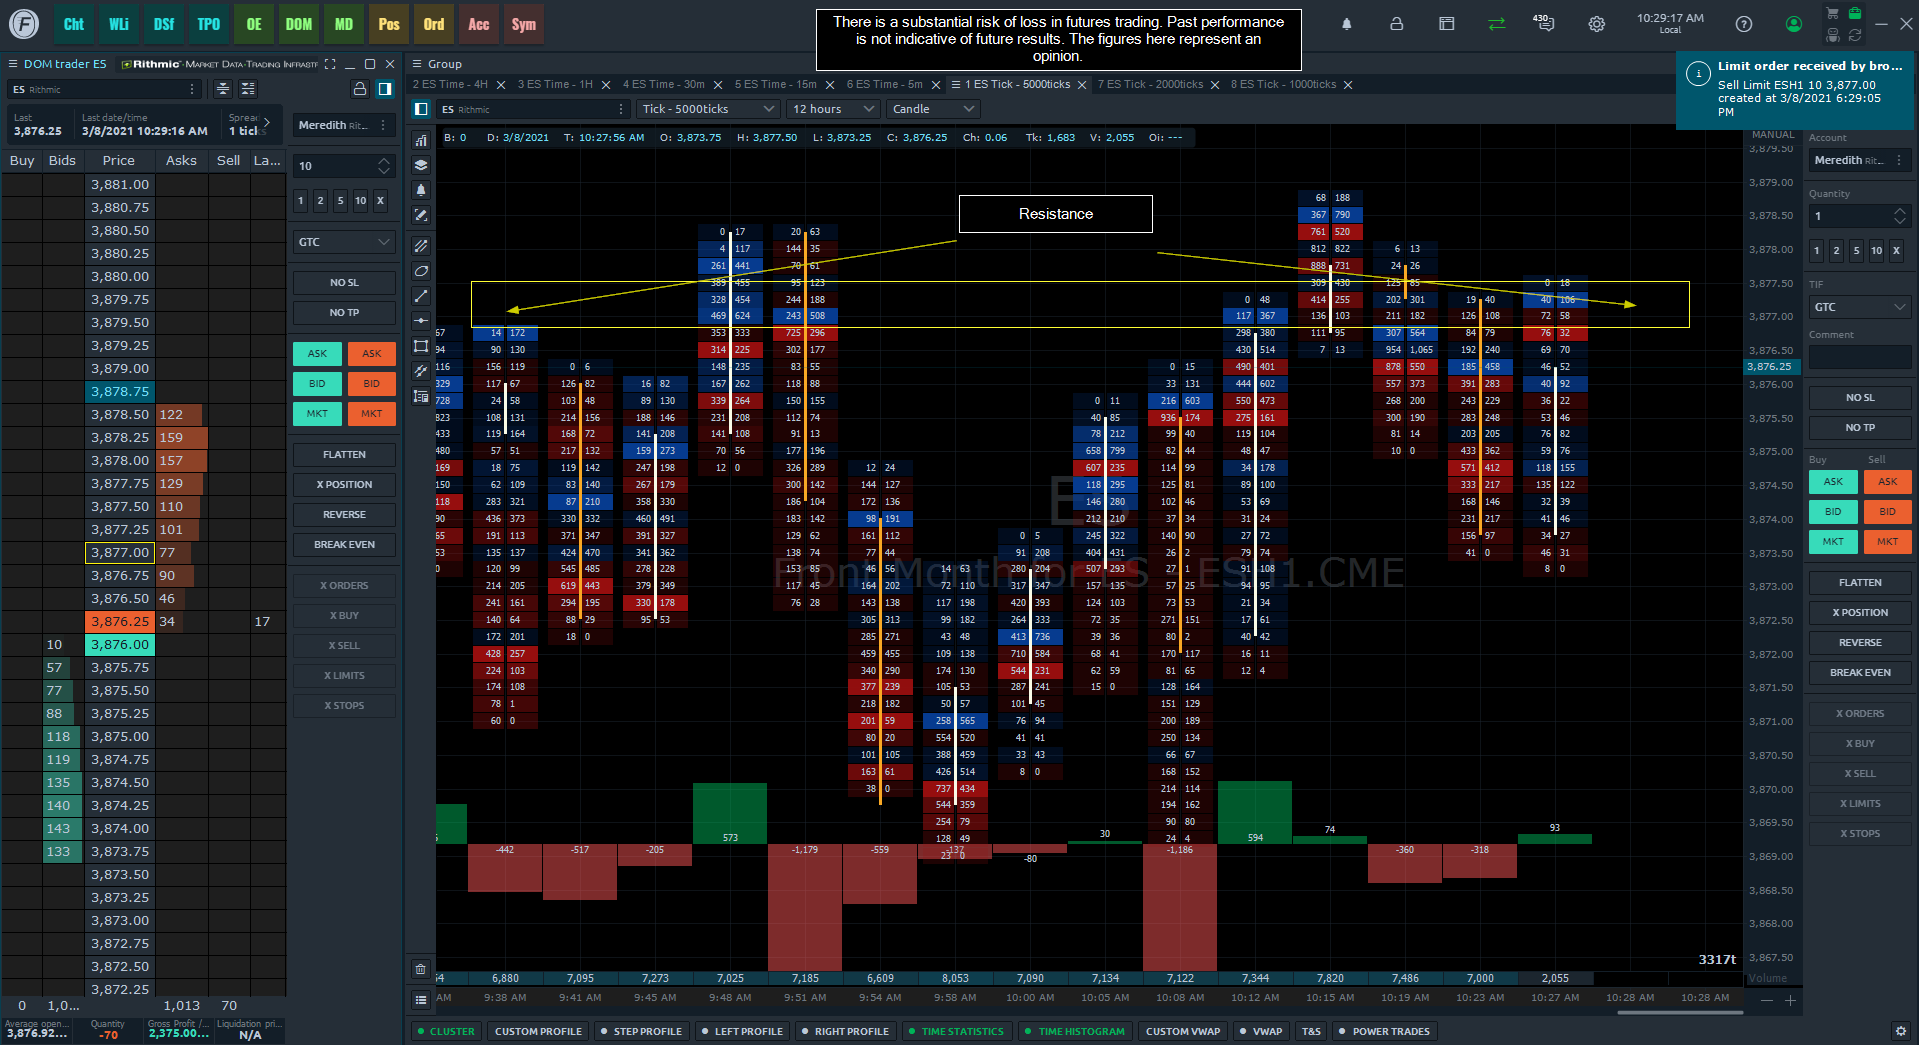
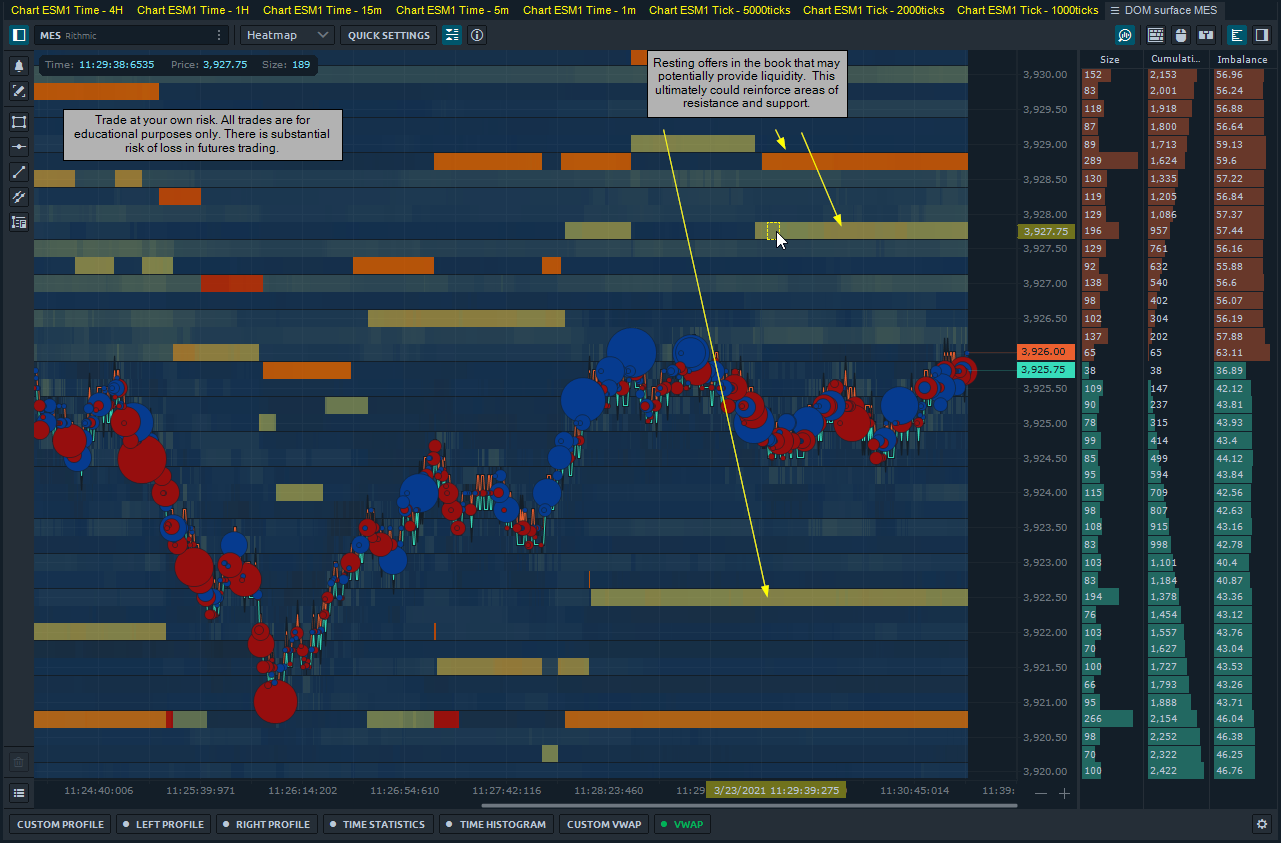
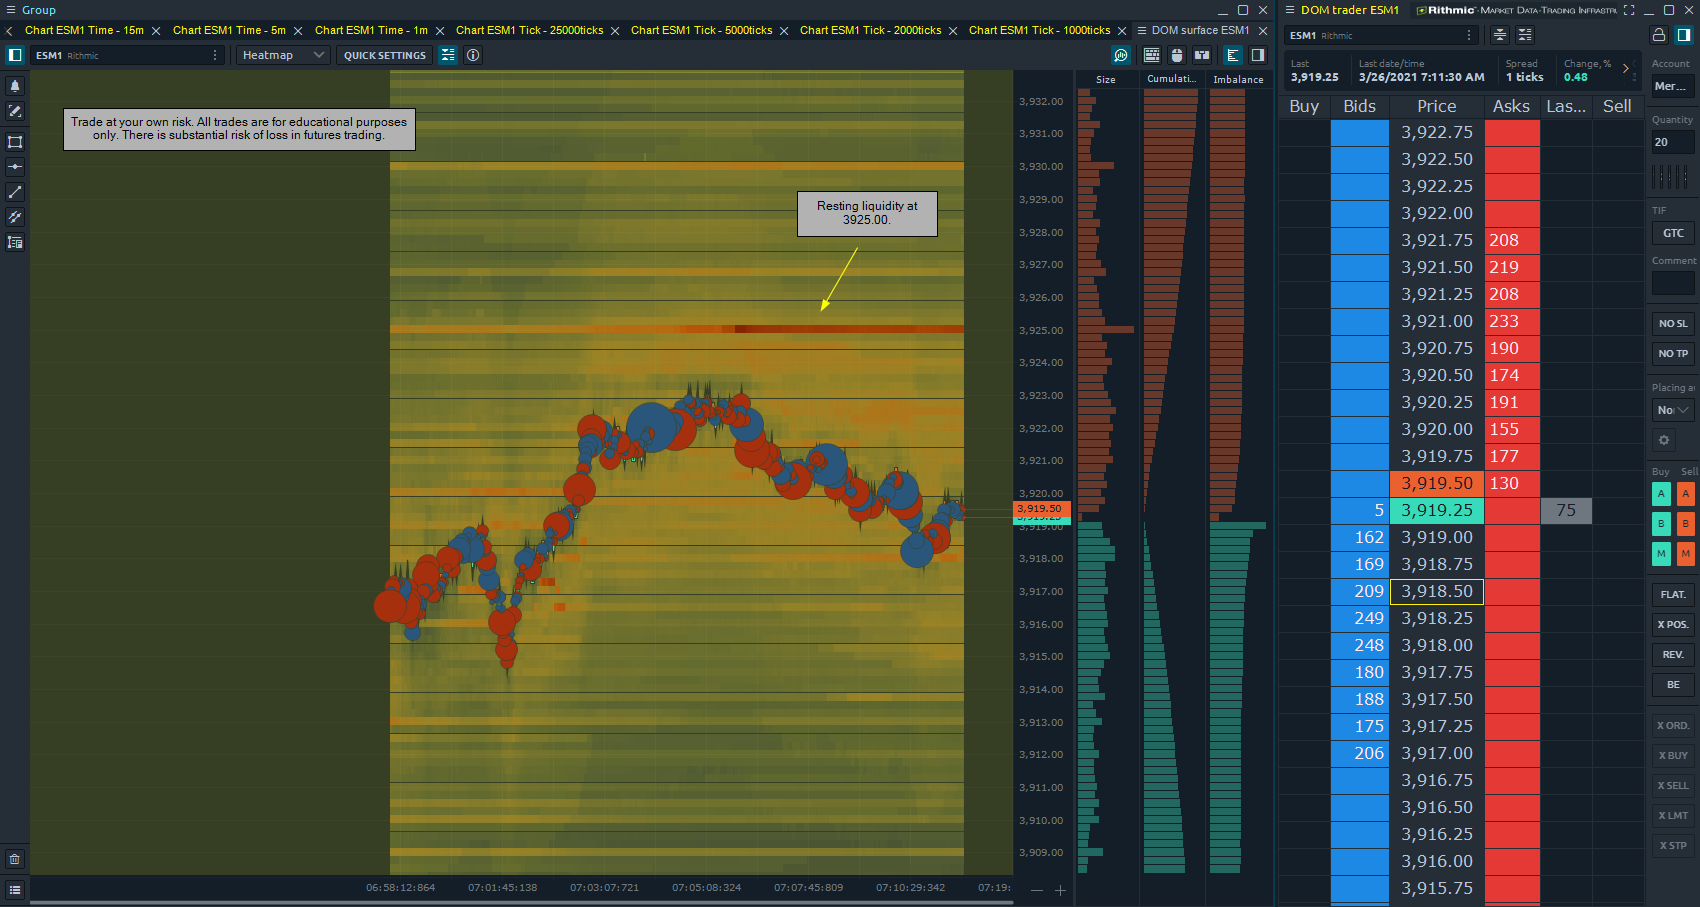
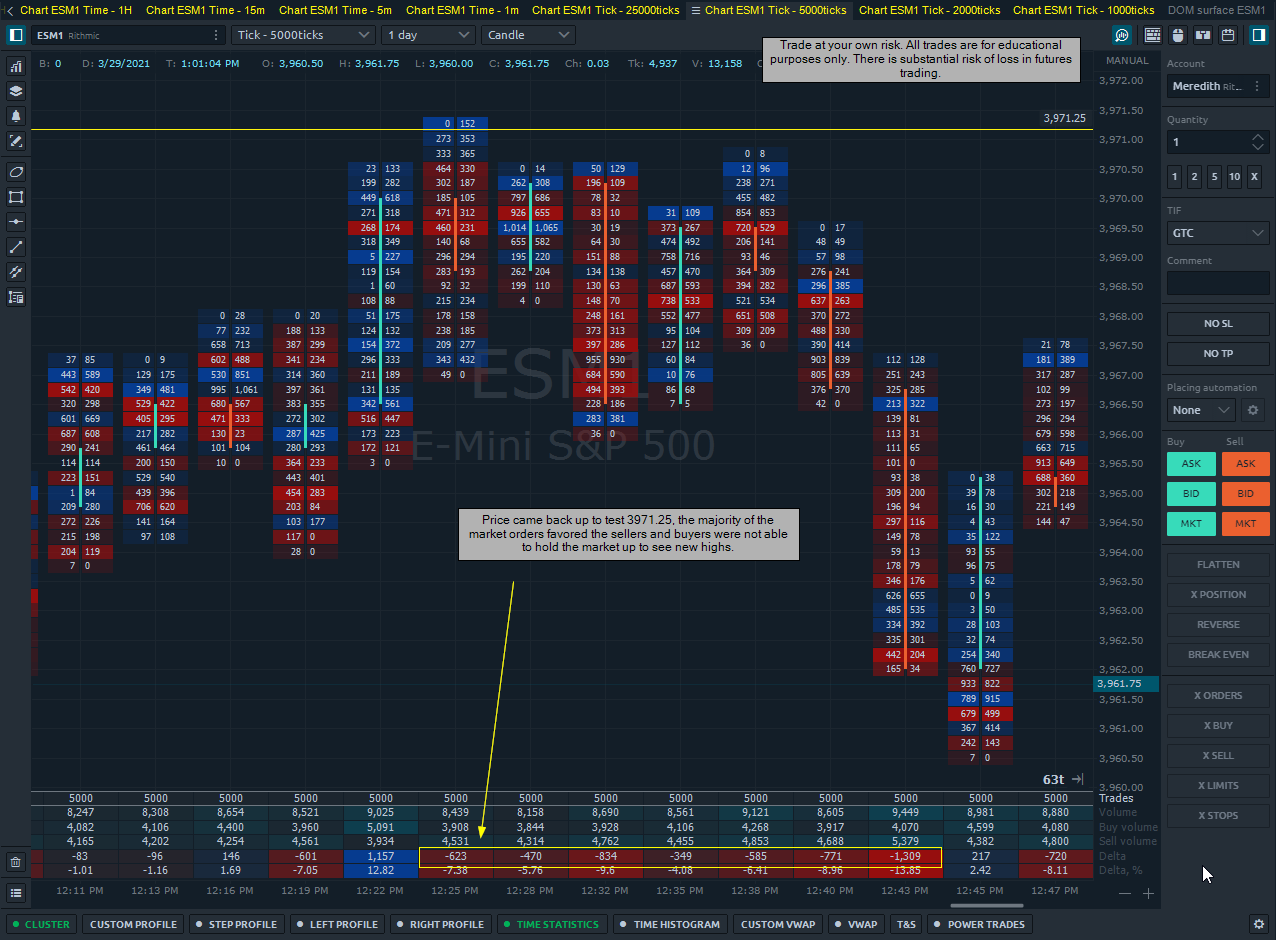
I’m already seeing that the market is trading slow and choppy. There is a ton of size on each price with constant reloads, making it difficult to read the order flow.
I’m going to be very careful in choosing my spots and looking for more long term tension in the market rather than those one or two tick price flips.
This will mean I trade less today which is not necessarily my style but it’s what the market is giving me.
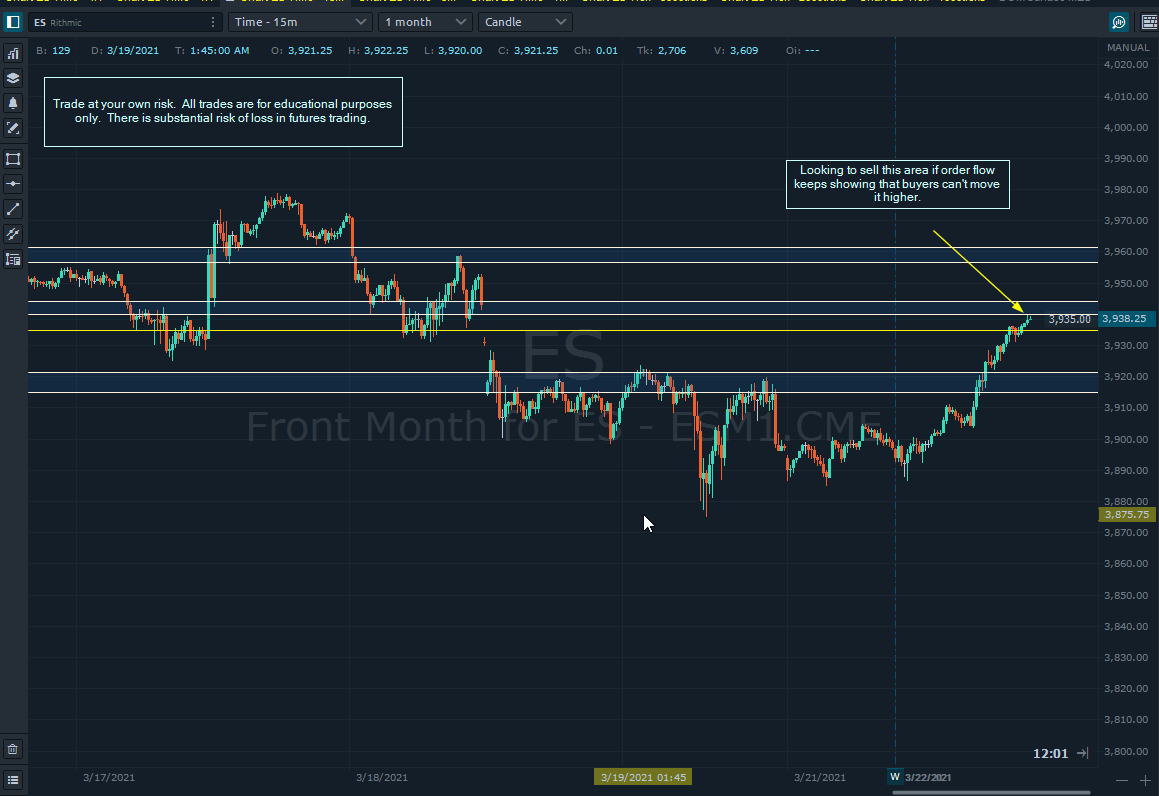
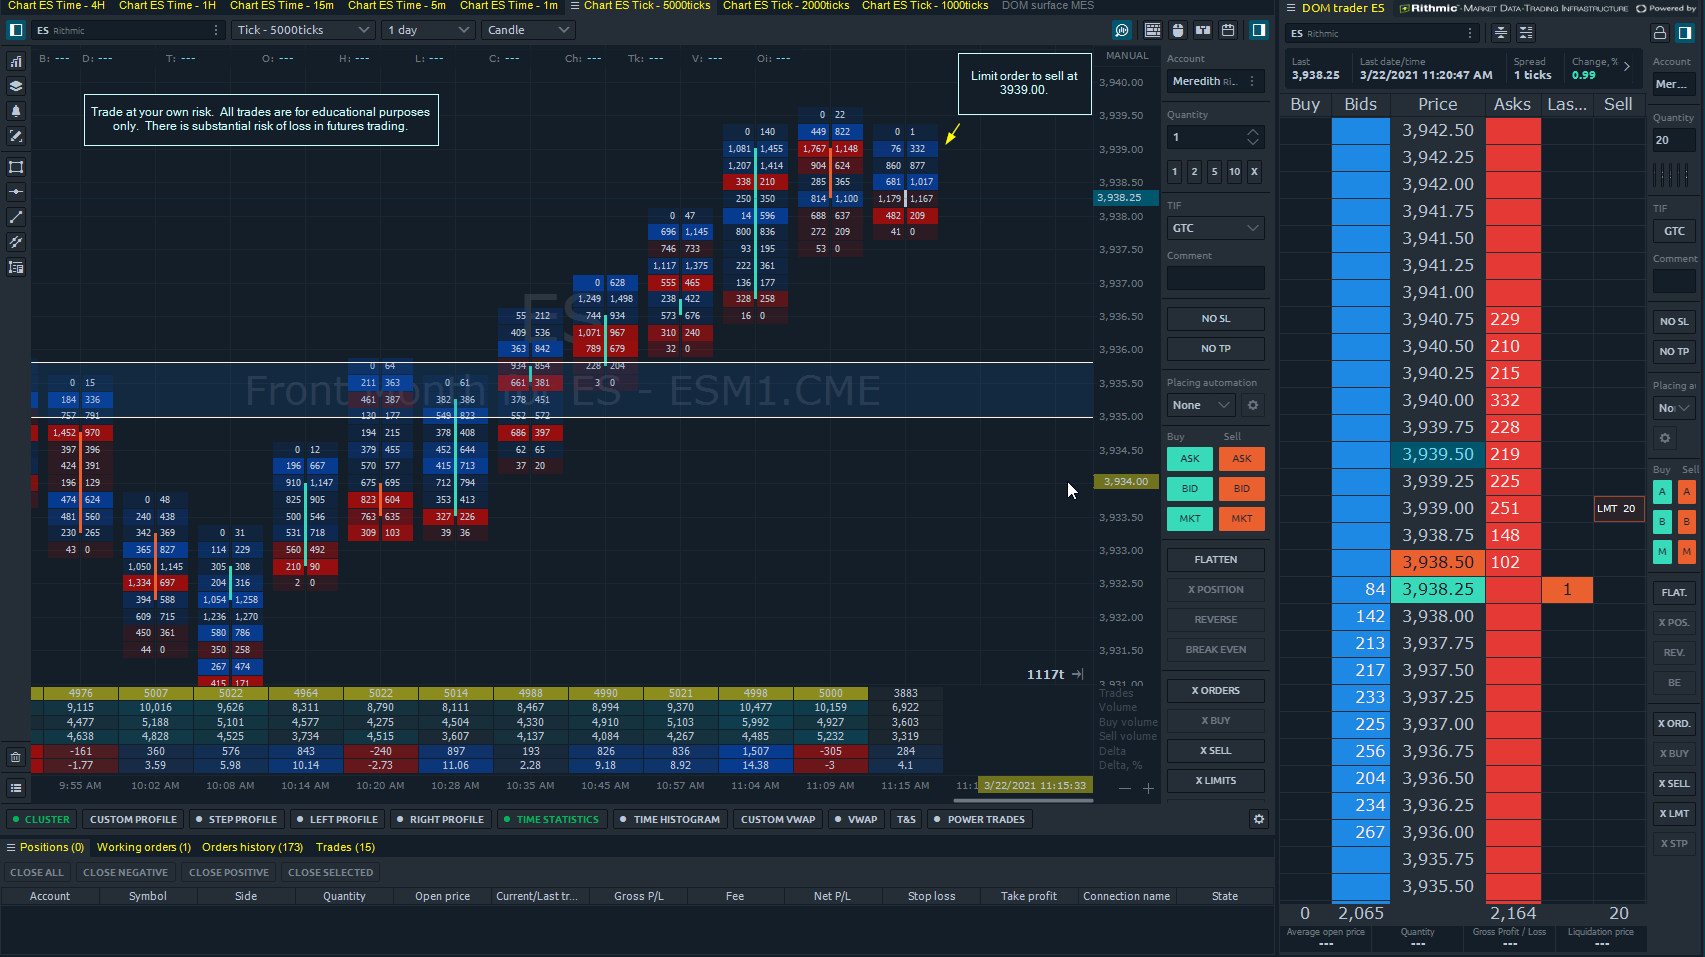
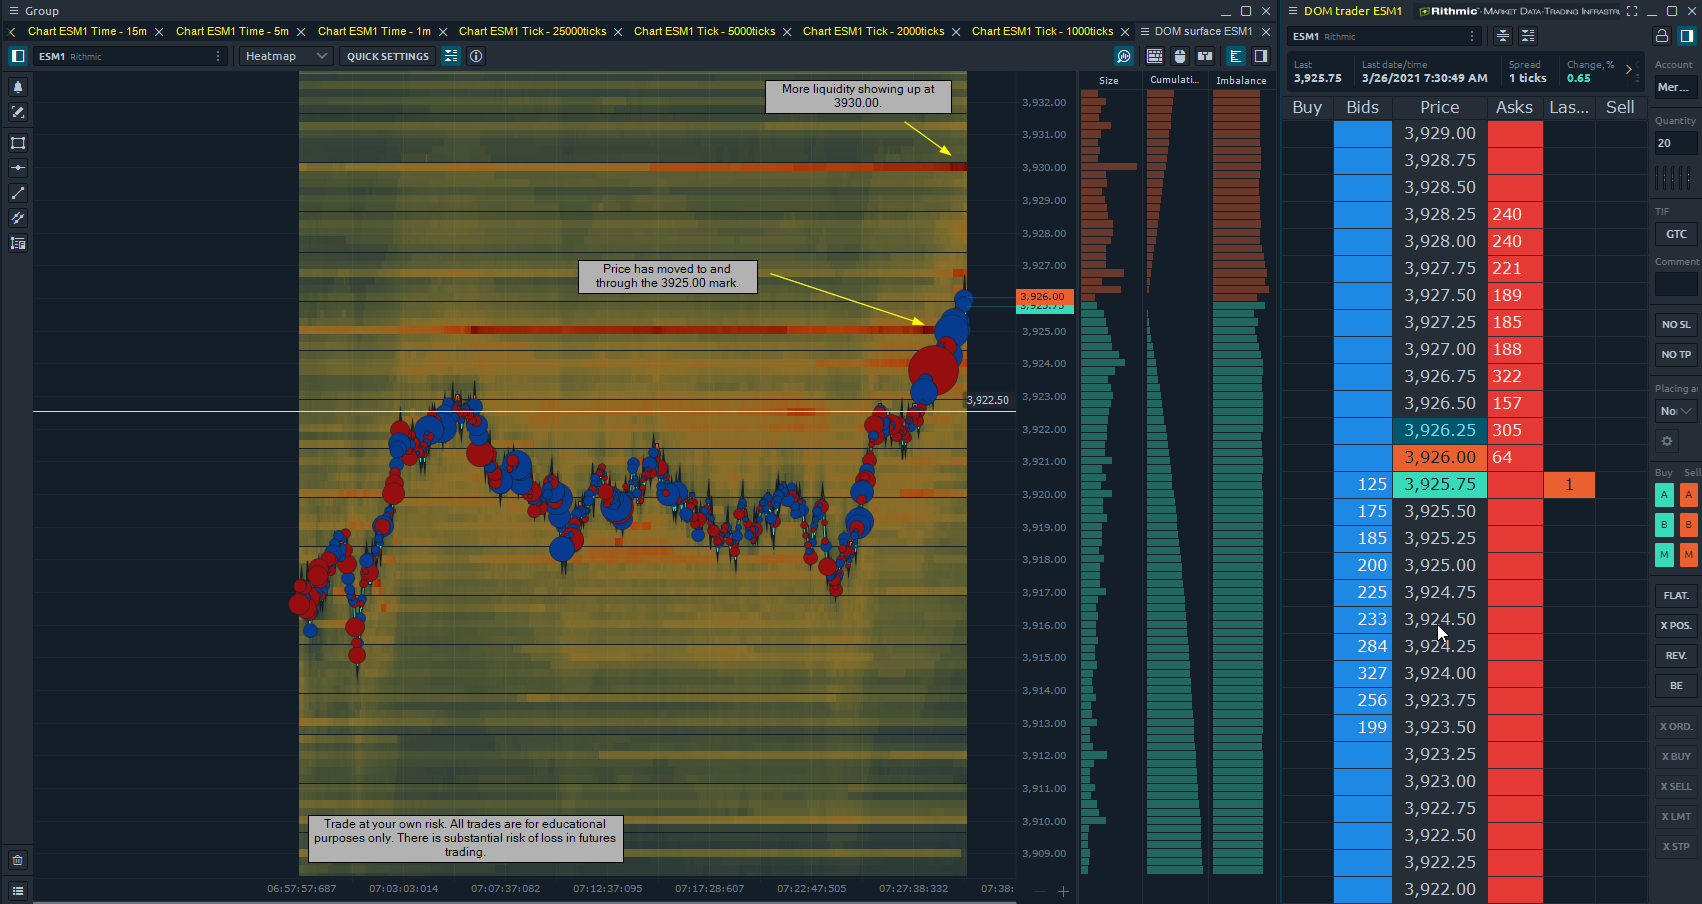
I see some selling pressure here at 3939.00. Well, lack of buying follow through. It’s still trading slow but I’m watching this area to see where I can enter.
Not seeing follow through on the upside. Had an order to sell at 3939.00 which is not filled yet.
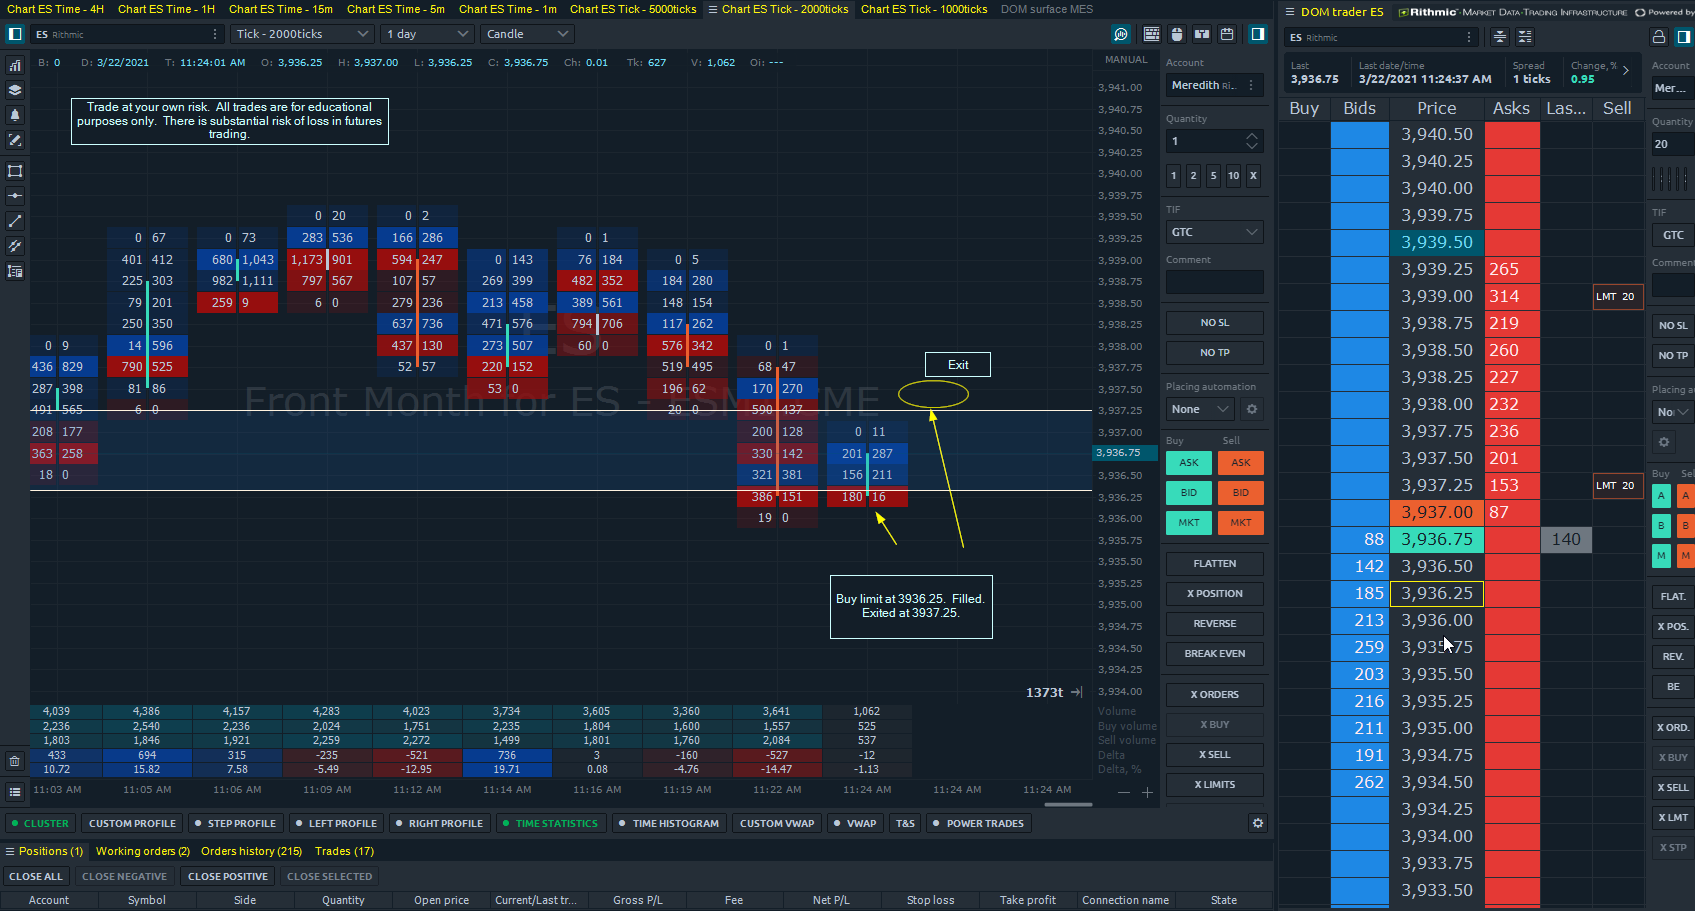
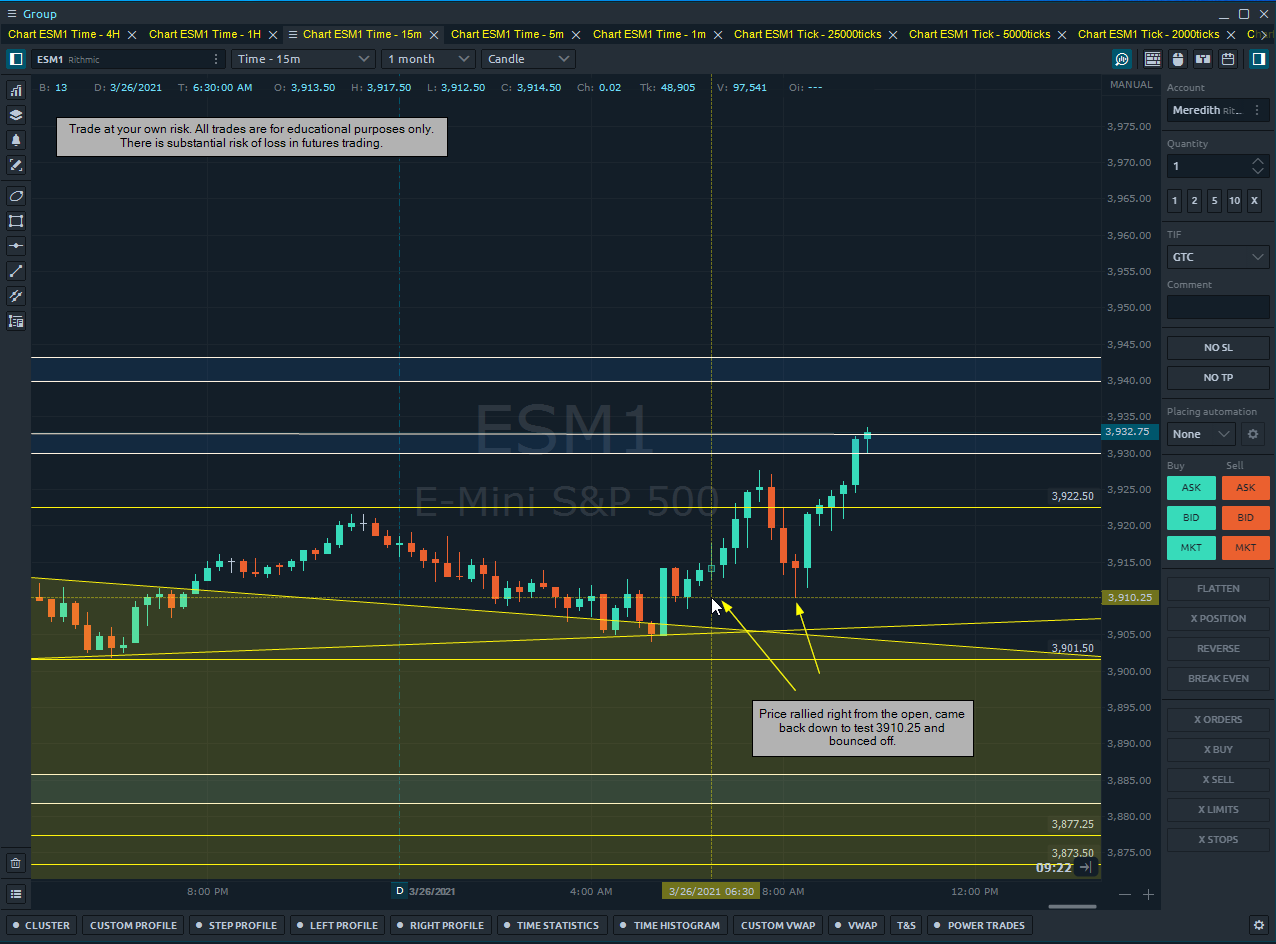
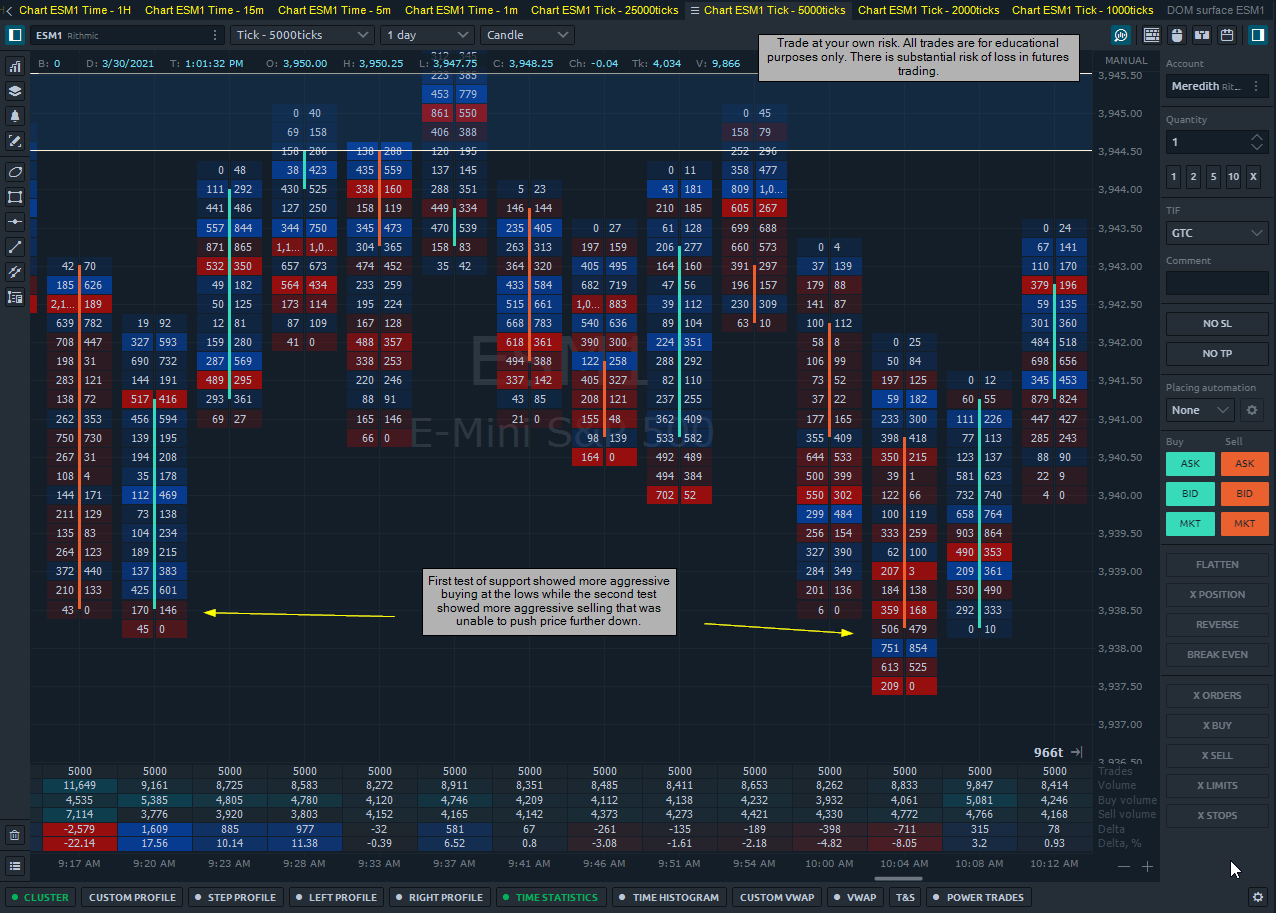
I missed my sell order, but price came down to a level of support and sellers who sold didn’t see much movement. Price popped a few points and the sellers who had to exit and become buyers allowed for a quick point on the upside.
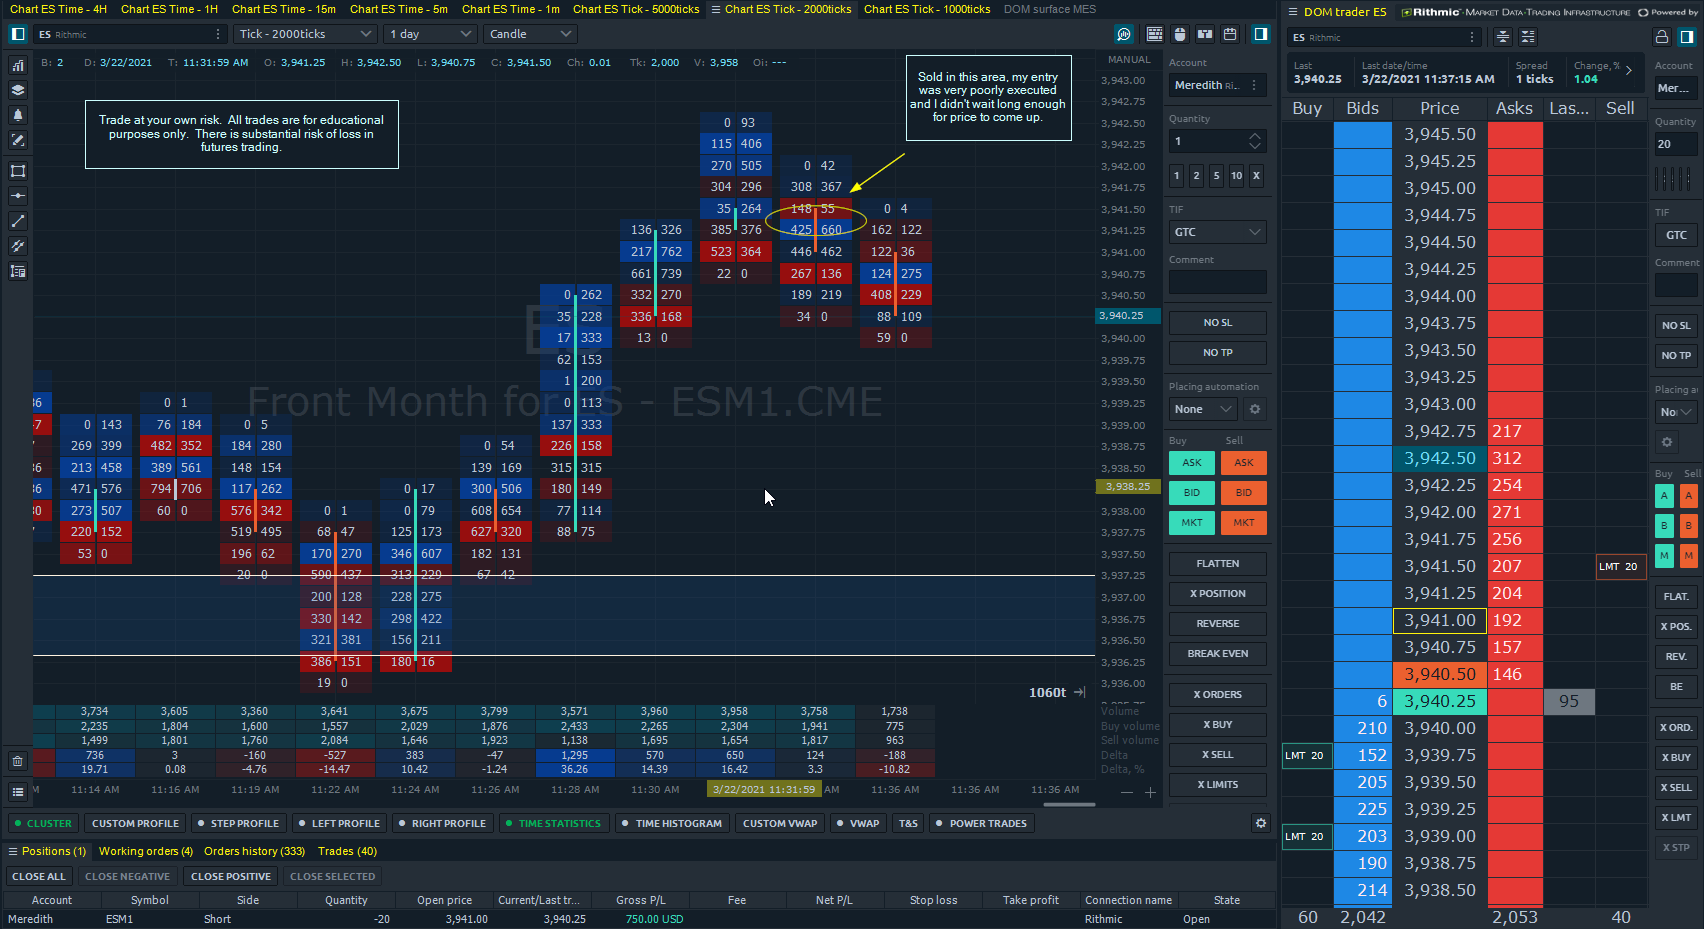
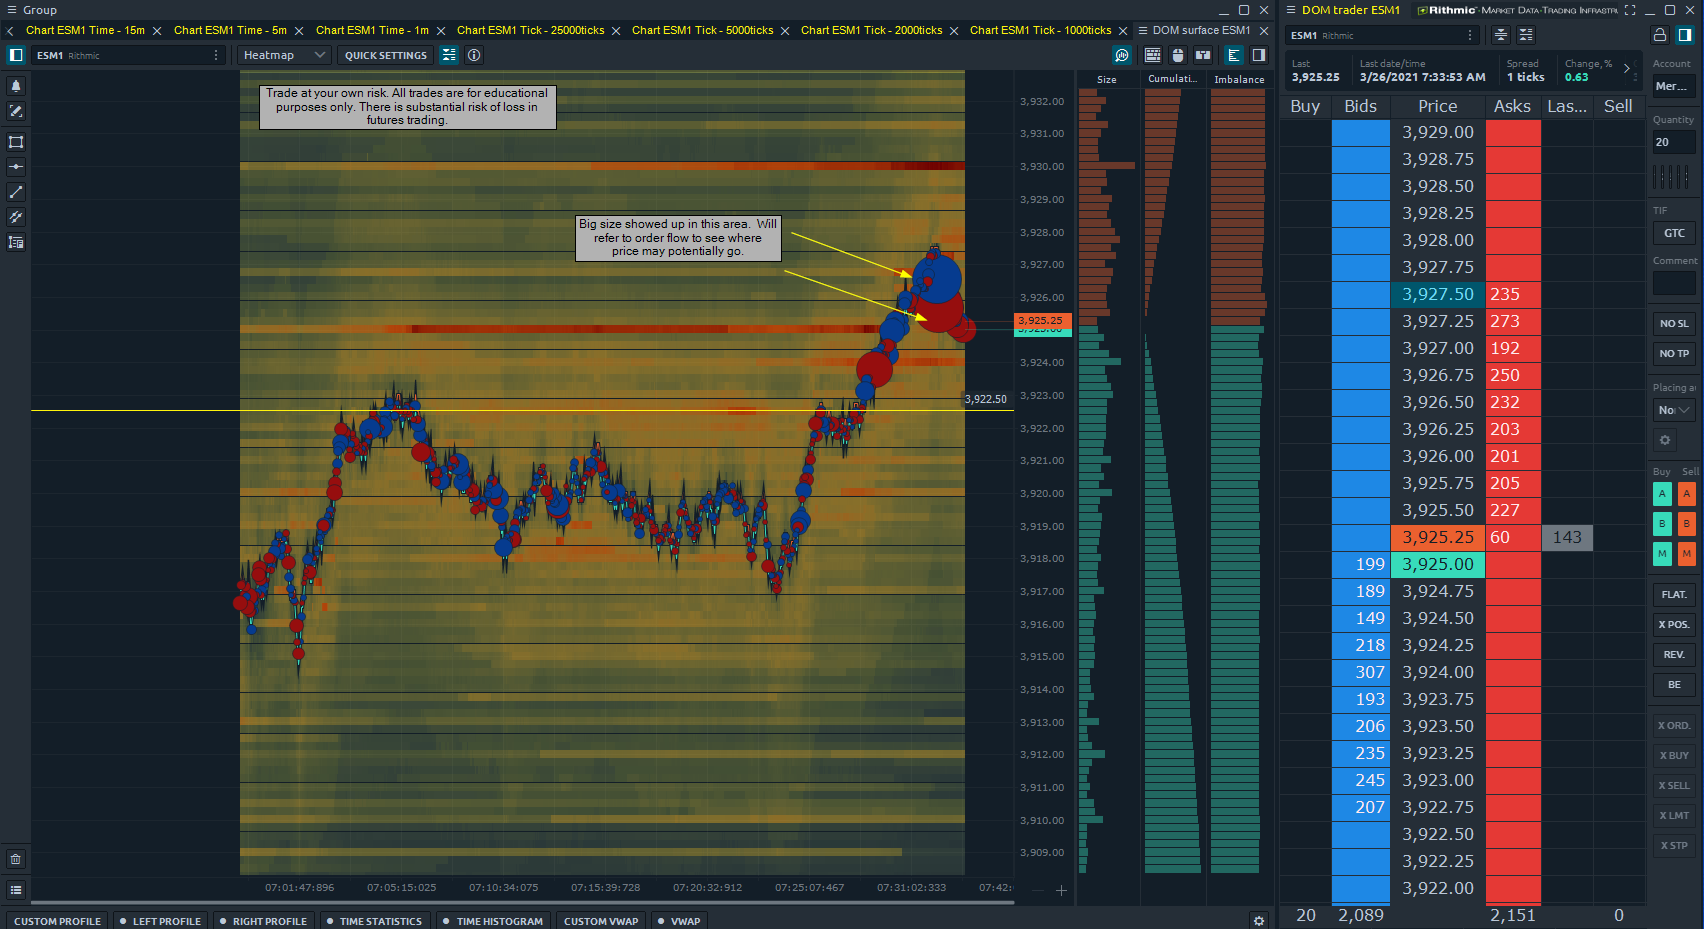
Still trying to get short at a better spot. I’m seeing that buyers are interested but I am struggling to see the follow through which makes me still OK with looking for spots to sell.
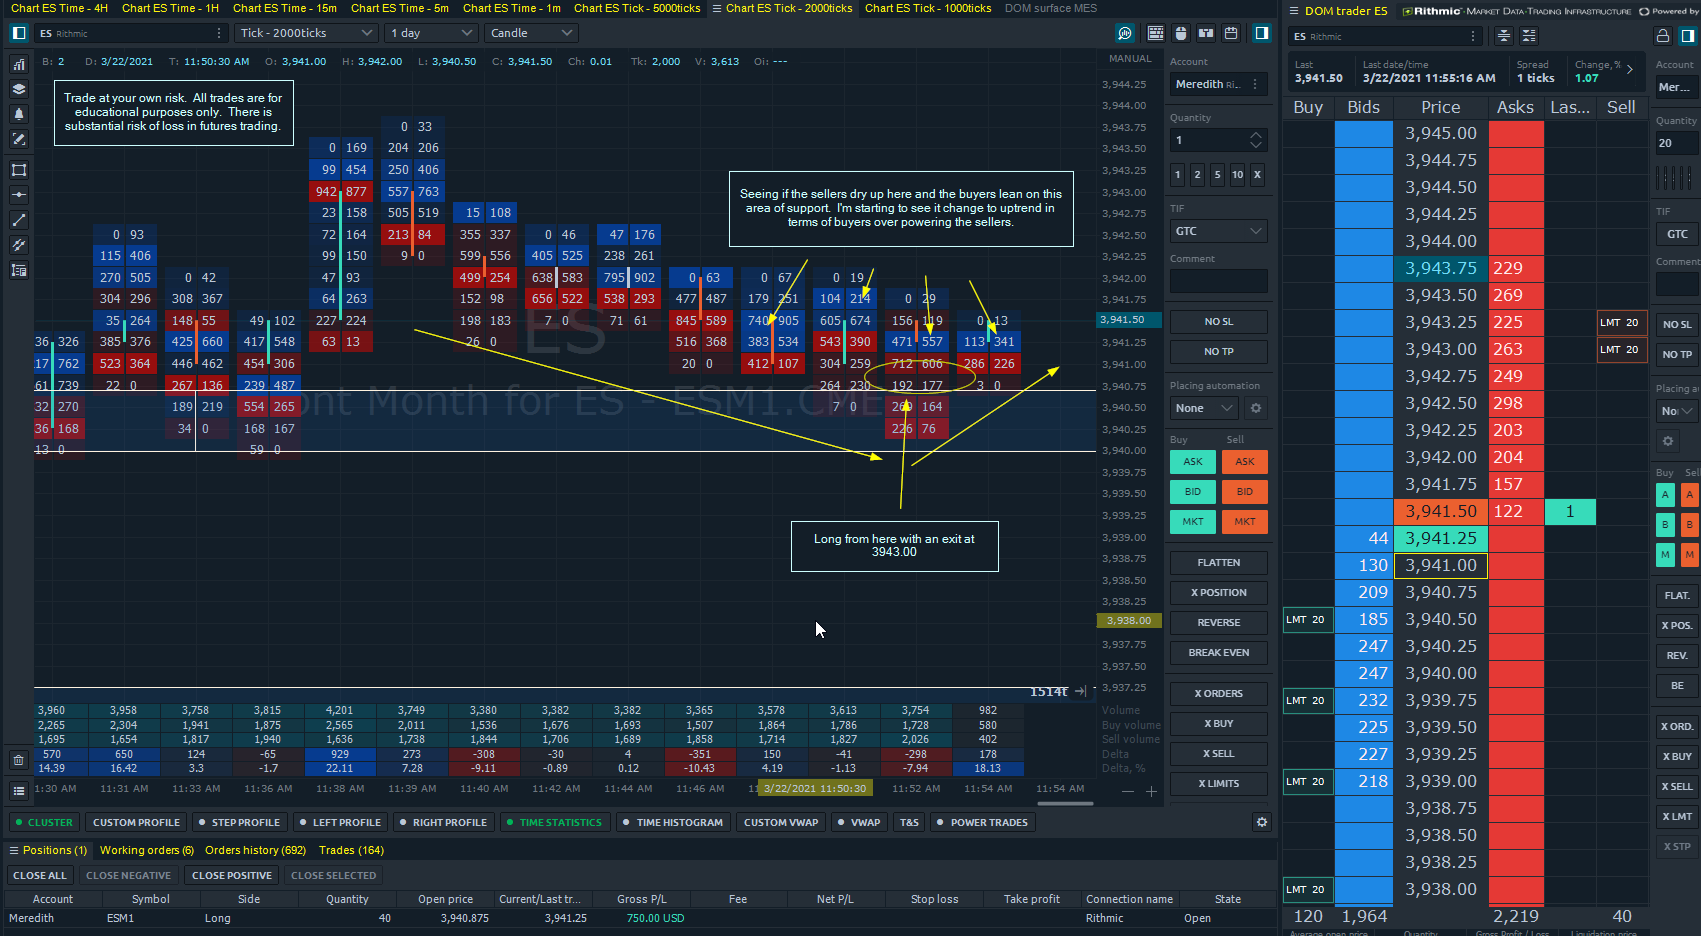
Finally got my bearings straight a bit and got a comfortable long position with little heat.
Waiting for the buyers to show themselves more and looking for exit around 3943.00.
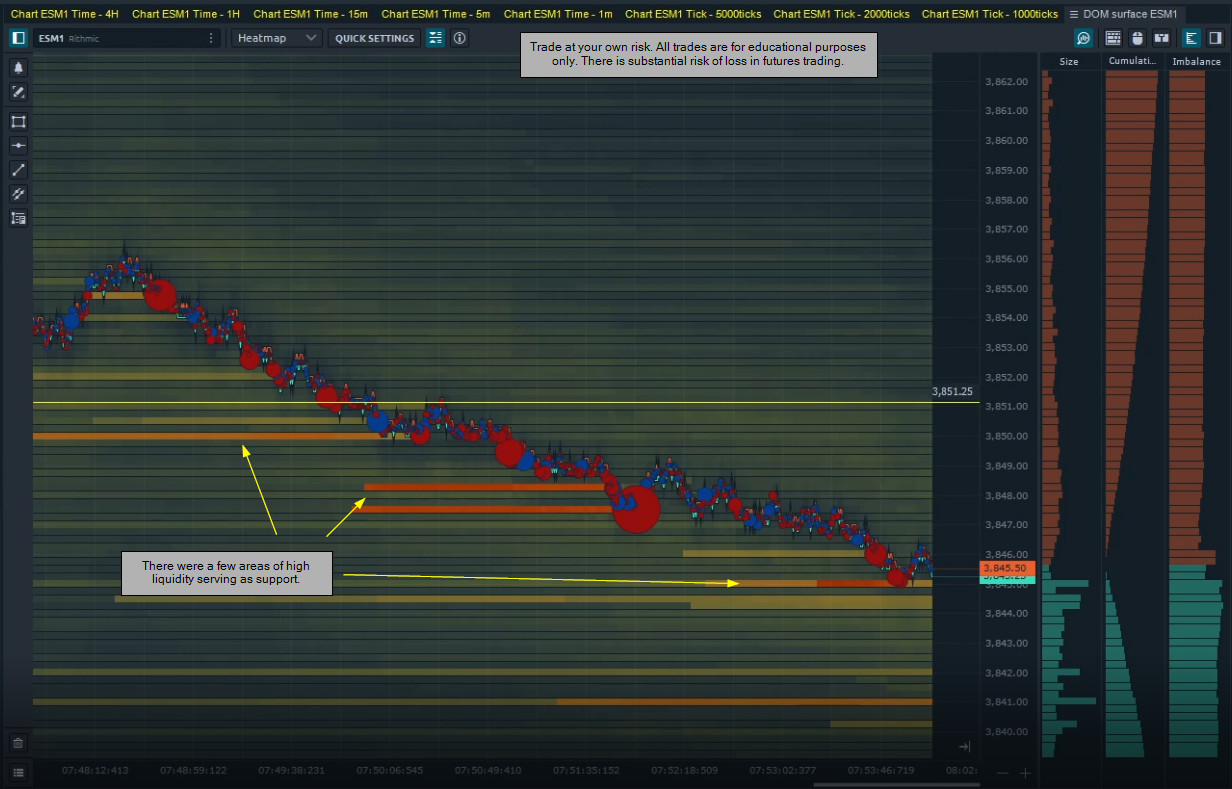
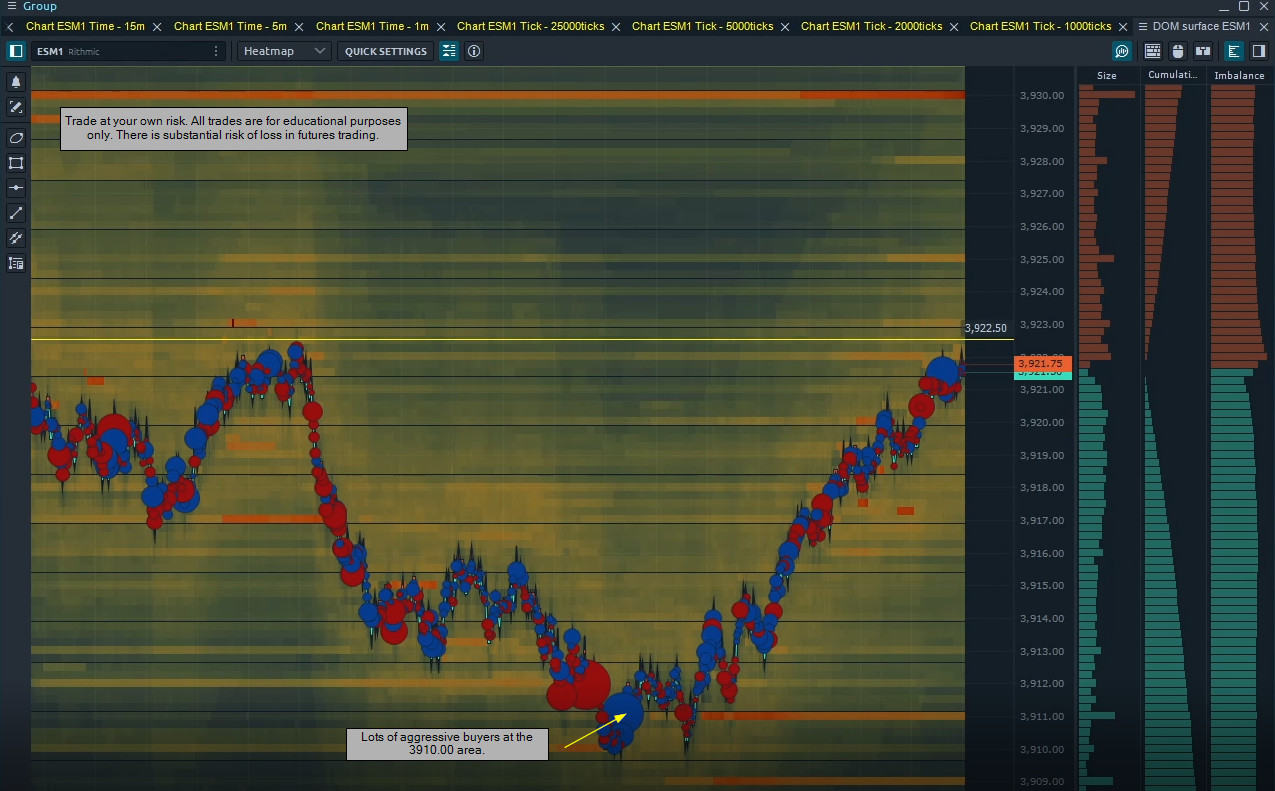
I saw sellers not being able to drive price down further which attracted buyers to come back into the market.
It’s still a super slow grind but the long term order flow seems to be playing out the way it “should” or makes sense.
There is a substantial risk of loss in futures trading. Past performance is not indicative of future results. The figures here represent an opinion. The placement of contingent orders by you or broker, or trading advisor, such as a “stop-loss” or “stop-limit” order, will not necessarily limit your losses to the intended amounts, since market conditions may make it impossible to execute such orders. Please conduct your own due diligence if Futures are an appropriate instrument for you.