S&P 500 Futures Market Outlook - Trends and Levels ES MES

Hey Ben, I really appreciate the fact that you recorded and posted your trading session! If you don’t mind, I’ll write a bit of unsolicited feedback on some things I noticed (I watched the first 51 minutes of “Trading session 4/7/21 Wednesday”):

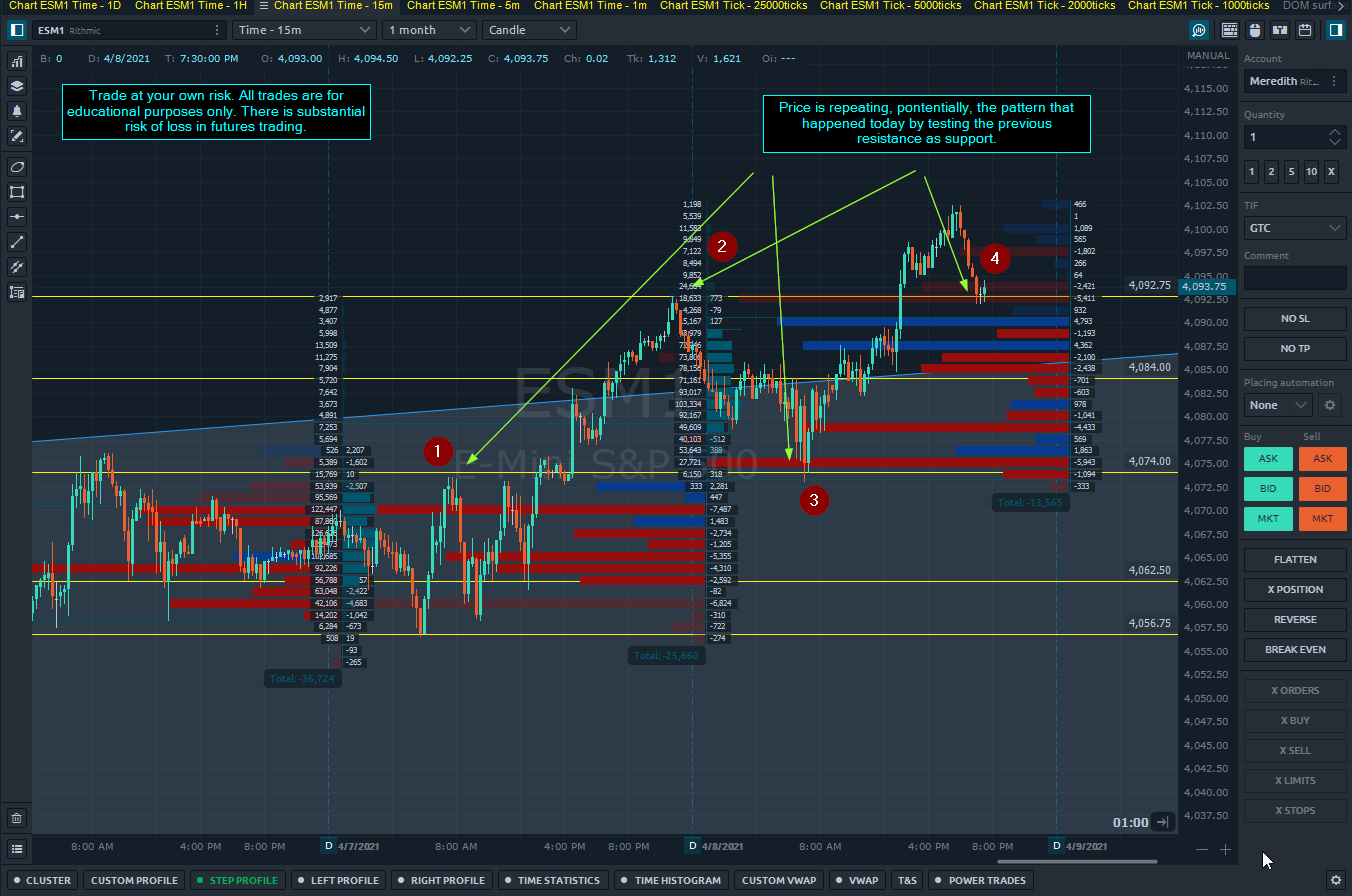
  1. The first trade was a short late after a strong sell off. The overall context up to that point made it more likely that that was a bear leg in a trading range (strong bull leg up earlier in the session and within the prior session’s range) rather than the start of a new bear trend, so selling low is relatively risky. Looking at the few bars leading into that entry: the third to last bear bar on the sell off had a very prominent tail below (bears likely covering and bulls starting to buy more aggressively). The next bar was a very large bear bar which in this context is more likely a sell vacuum test of the lows and sell climax (climax doesn’t necessarily mean it’ll lead to a reversal) rather than a measuring gap into a new bear trend (this bar also had a lot of overlap with the bar before it and bears who sold too low were likely going to use that bar an an opportunity to cover). The follow through bar was a doji (a 1 bar trading range) with only a small bear body which is disappointing follow through for any bears who sold low on the large bear trend bar. There’s a saying, “big up, big down, big confusion” and confusion is a hallmark of a trading range, so it’s better to be looking to buy in the lower portion of the range and sell in the upper portion of the range. Prior to the short entry that was taken, the bar had a prominent tail below that went through the lowest close so any bears who did want to get out of their shorts at breakeven, aside from those who entered at the bottom tick or two, would have been able to do so. Limit order bulls would be looking to buy in the same area which adds to the buying pressure. Those few bars also constituted a higher low micro double bottom (it went down and up with the bear bars followed by the two bull bars and then went down and up on the bar that you entered on) and technically entering above that bull bar is a second entry long which tends to be reasonably high probability in this context. Given the larger trading range and overall bullishness of the market taking a short low in the range is actually a contrarian stance despite the recent sell off. In this sort of context, the market will tend to try to test to at least the top of the sell climax bar.
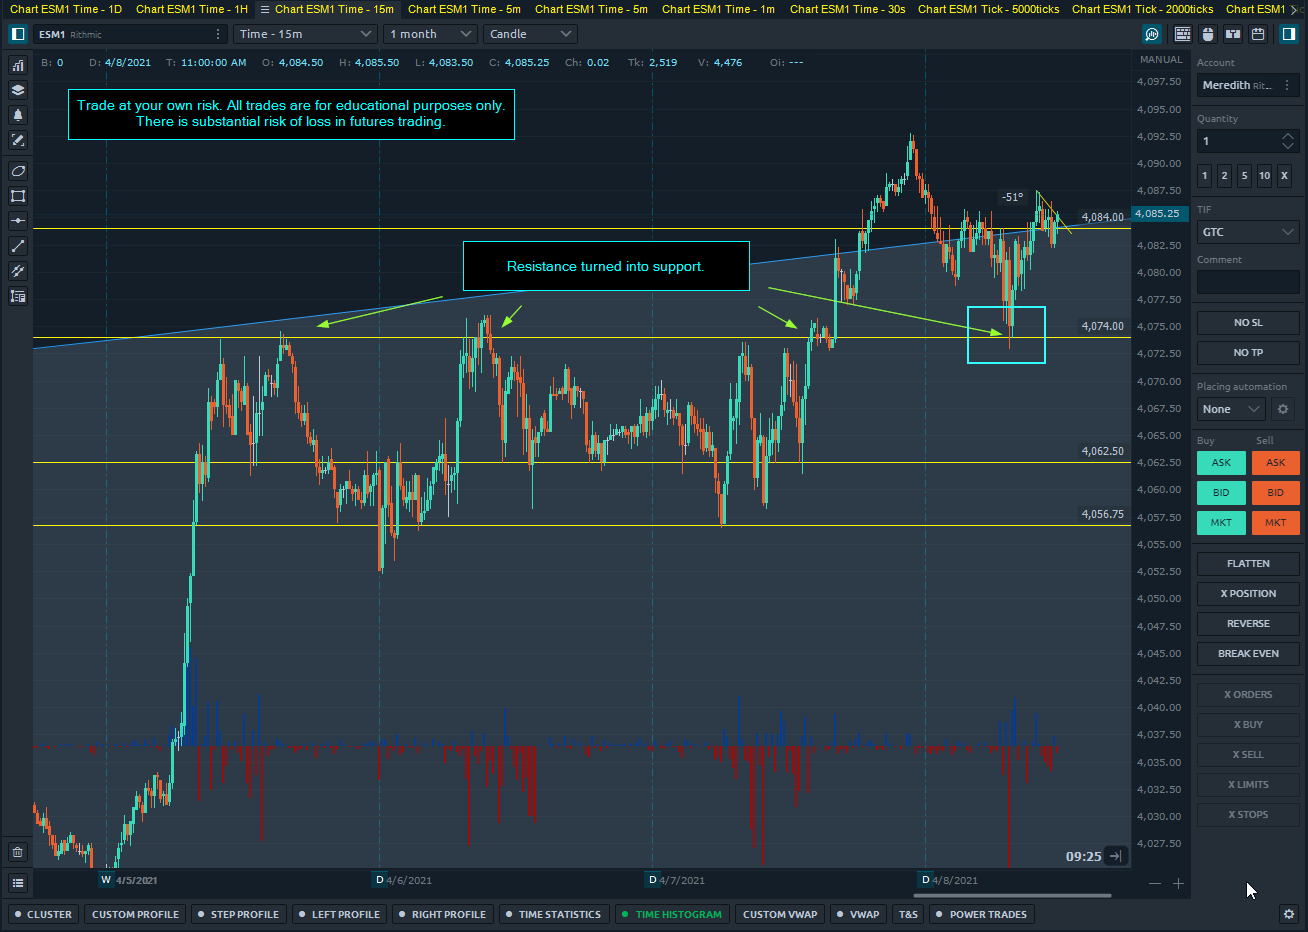
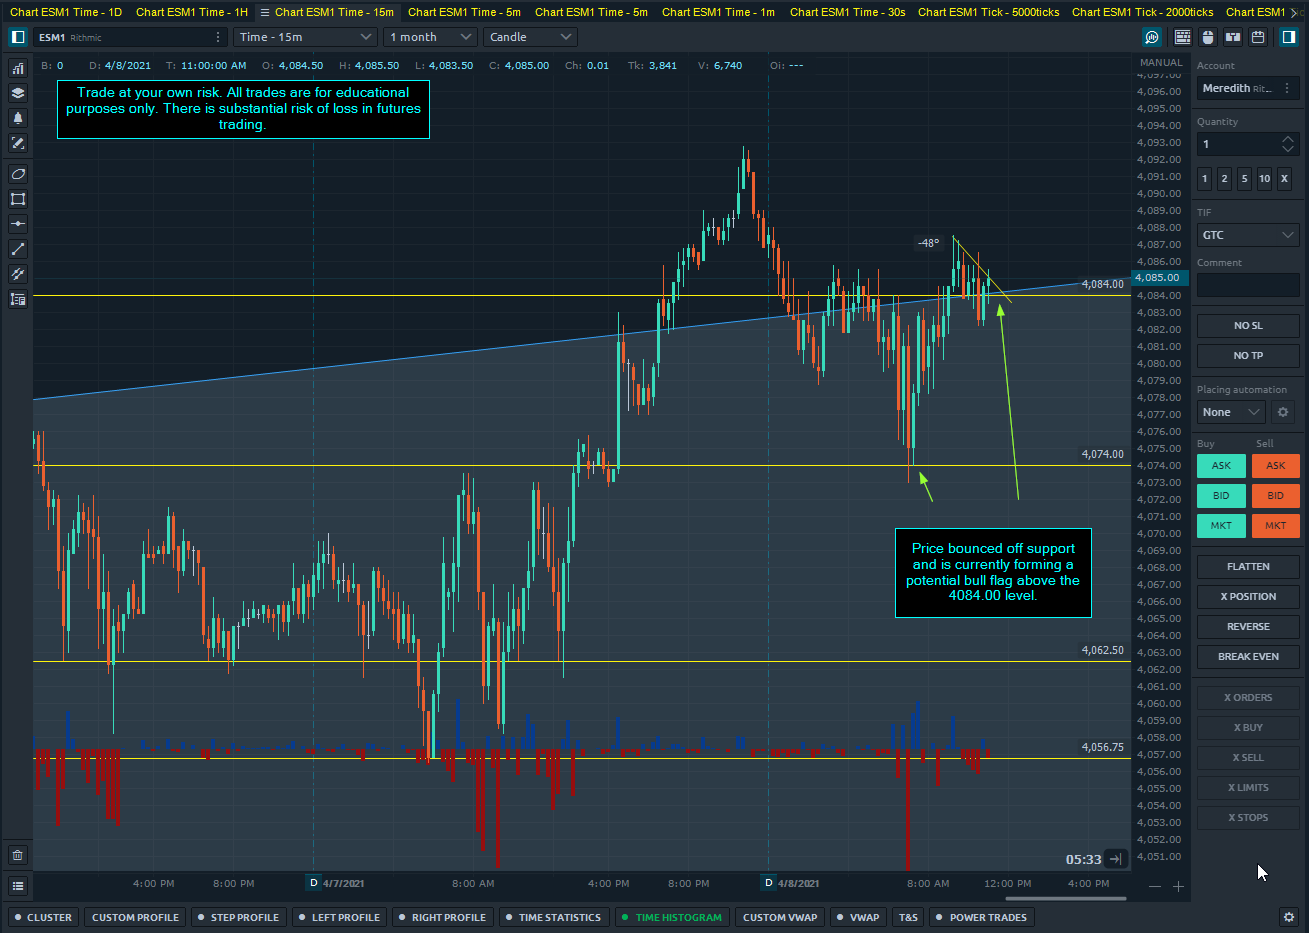
  2. Notice how when the market did wind up selling off again, it formed large bear trend bars with very poor follow through (large bull trend bars), so again bears and bulls were buying the lows rather than having the bears continuing to be interested in shorting the lows. There were other signs in the price action as it unfolded, but this is becoming another long post so I’ll refrain from commenting too much on other things. Many of the things that I talked about above came into play again.
  3. I think you may be looking at too many things. If it helps you, then keep doing it, but I’ve noticed in my own trading that when I look at too many things it leads to decision fatigue, paralysis by analysis, and cognitive overload which subsequently causes errors in my decision making. I noticed that at times you added more indicators and studies while sitting in a position that was moving against you which may be a sign that you’re looking to confirm a bias towards the position that you’re currently in. This potential bias could also be seen in the way that the trend lines and channels were being drawn.
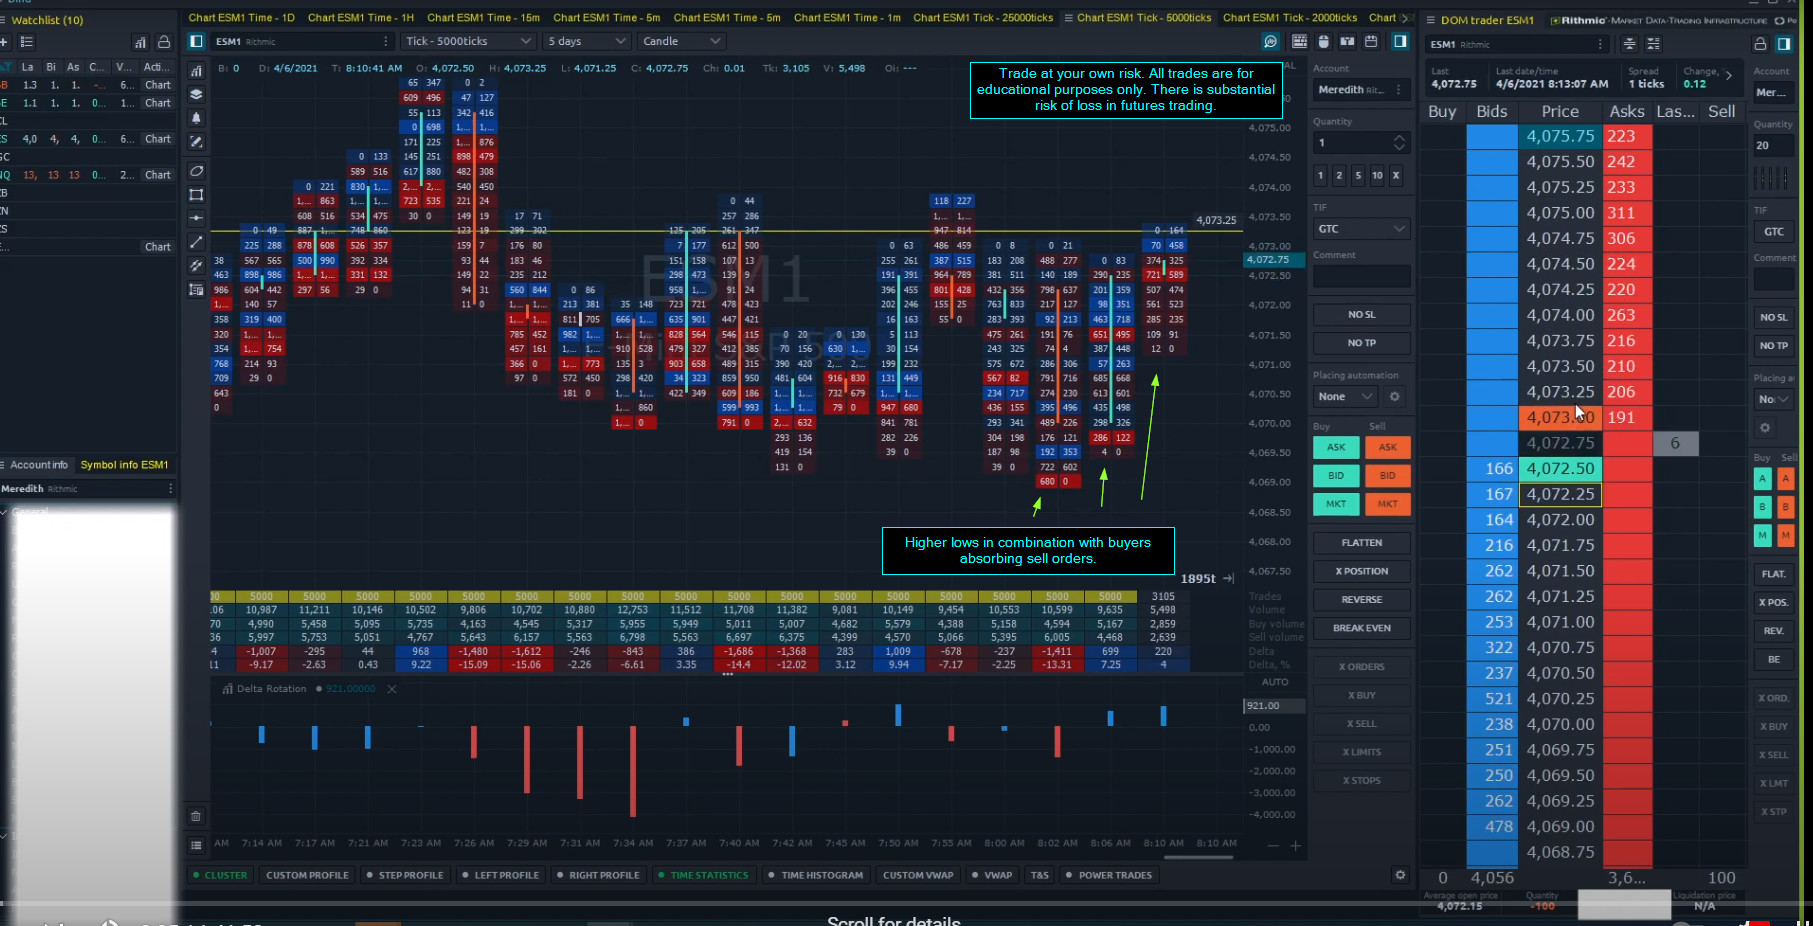
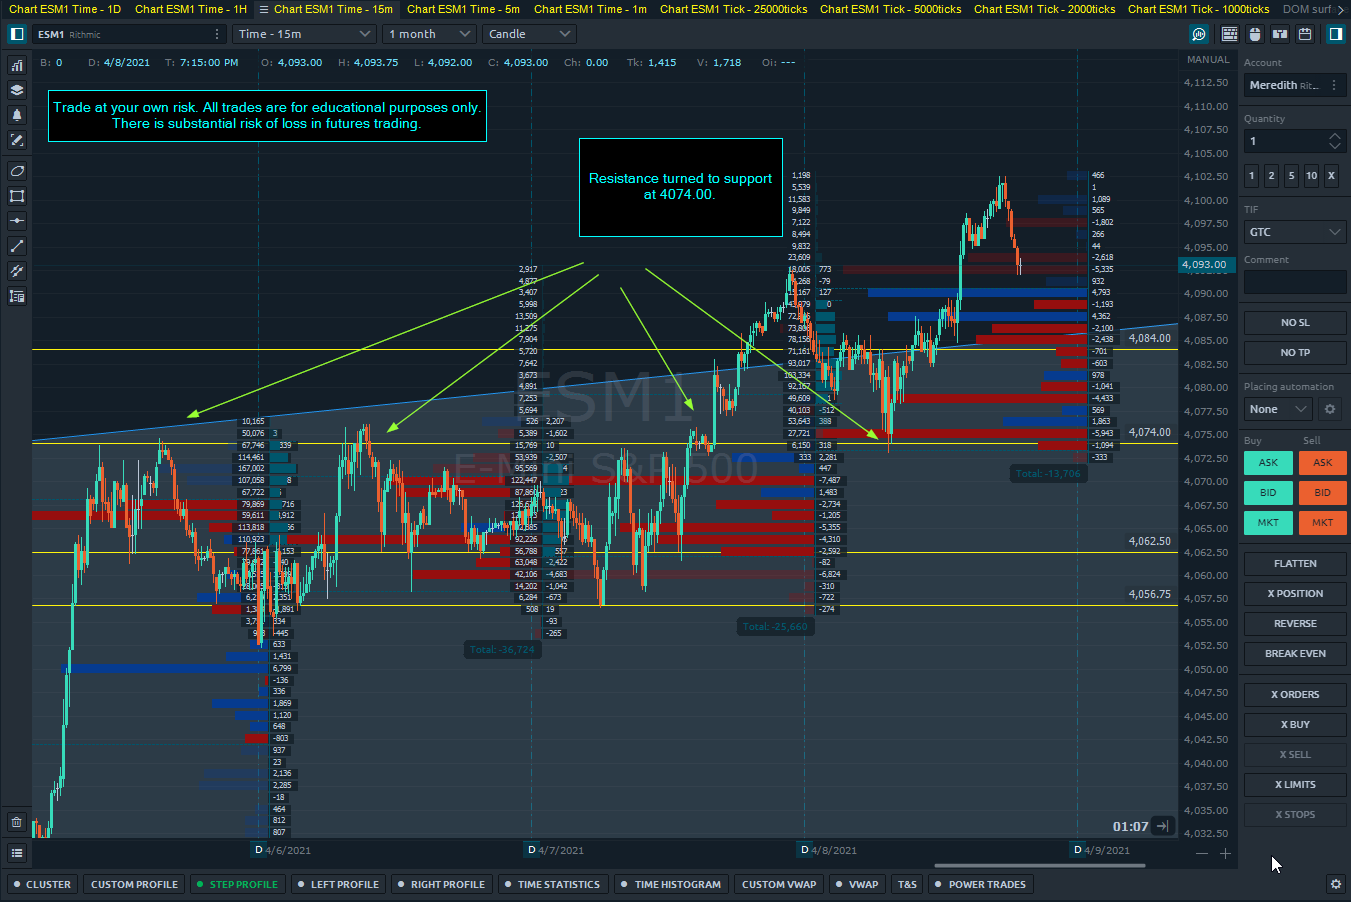
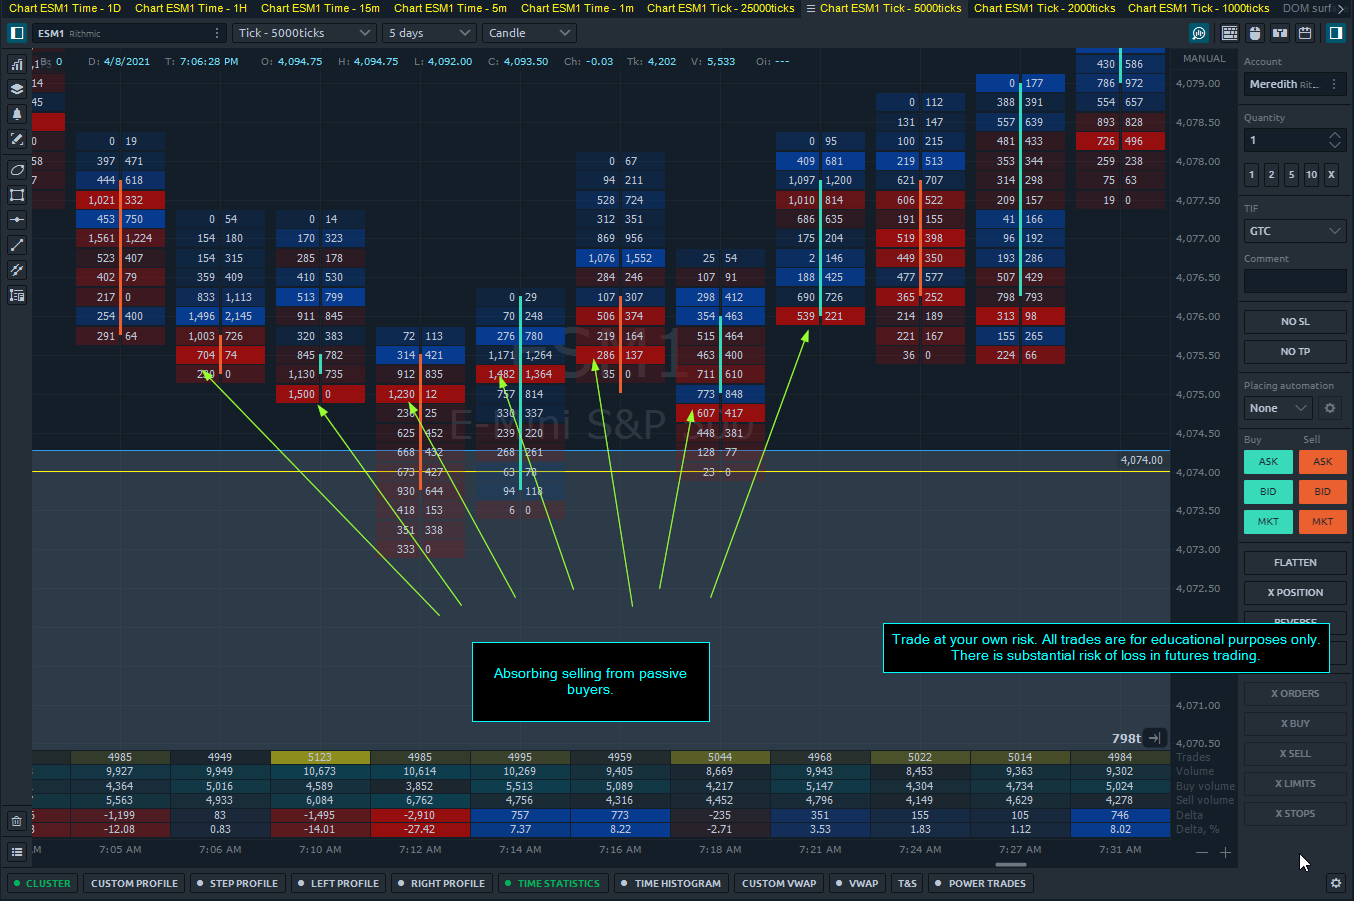
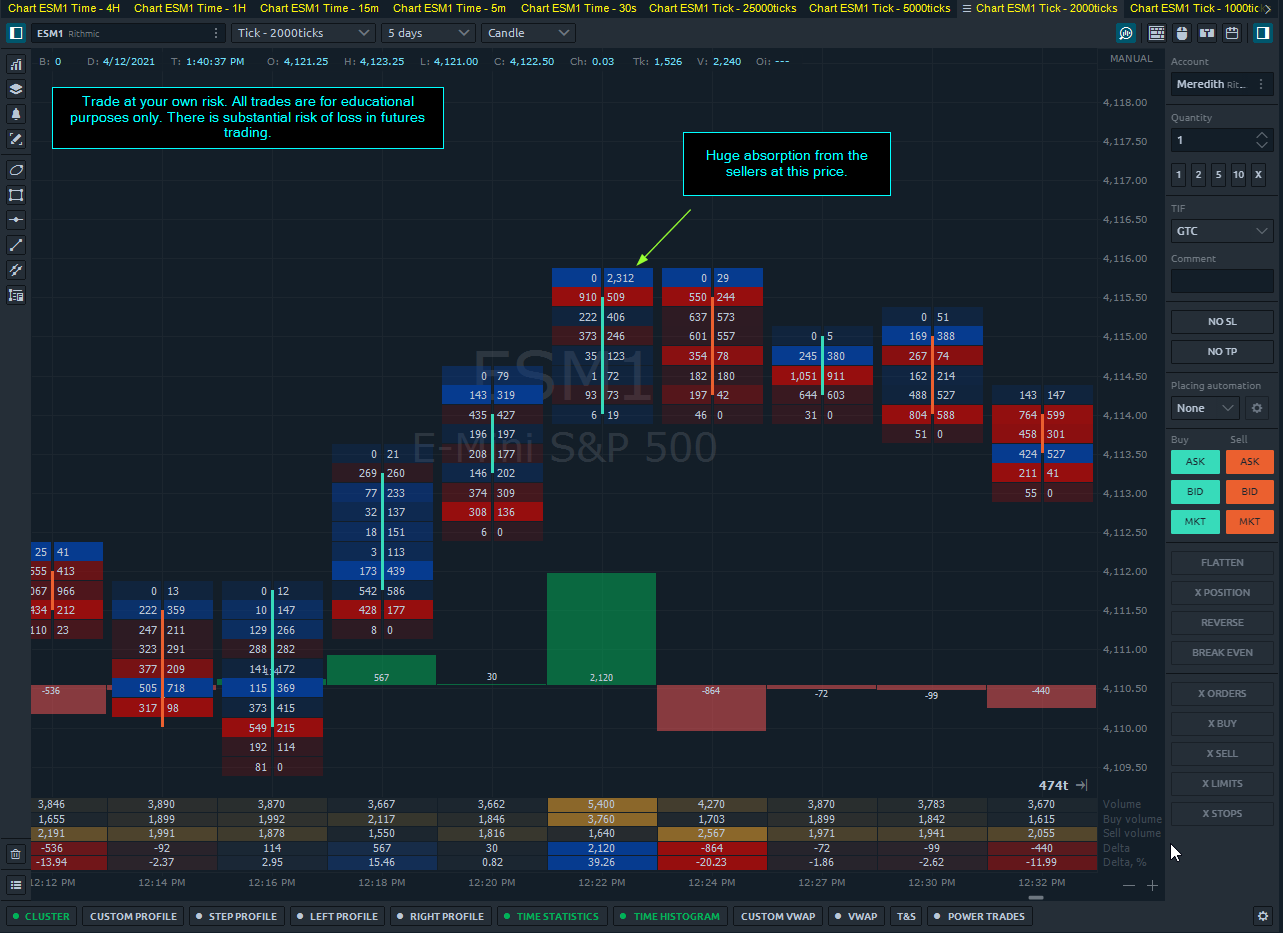
  4. Speaking of information overload, it’s worth noting that there was buy side absorption before the short that was taken around 34 minutes into the video. This could be seen on the lower portion of the footprint chart around 35:10 (and on the heat map, but it was harder to see), then the buyers stepped up and held the market higher between 4062.75 and 4064.00. I’m guessing you noticed that too which is why you got out of the trade. I think there would be less of a temptation to reverse from long to short and vice versa if less information is considered. It becomes easier to miss things (particularly the overall context when order flow is watched too closely) when too much information is viewed.
1 Like

Market Update 4/8/21 Thursday.

ES Mini Futures opened around 4087.00 then traded down to our level at 4074.00. This was a significant resistance level since 4/5/21. Price consolidated in a range between 4056.00 and 4074.00 then finally broke to the upside yesterday after the close.

At 7:00 am, price touched the 4074.00 support level then traded up above 4084.00. It is currently consolidating in a potential bull flag, which could continue to develop if buyers keep bidding to hold price up.

The custom profile shows that the POC for the time period from 9:00 am until now at 4084.00 with price currently trading above that. We have seen a good amount of aggressive selling, but as we have known this entire week, the buyers keep absorbing any selling pressure.

There is a substantial risk of loss in futures trading. Past performance is not indicative of future results. The figures here represent an opinion. The placement of contingent orders by you or broker, or trading advisor, such as a “stop-loss” or “stop-limit” order, will not necessarily limit your losses to the intended amounts, since market conditions may make it impossible to execute such orders. Please conduct your own due diligence if Futures are an appropriate instrument for you.

@Trader thanks for taking the time to write this up! I never turn down outside feedback and observations, it’s always a fresh look on things that I may not be seeing or attune to, so thanks very much.

  1. Completely agree on this, not to mention when I made that trade I failed to look at the overall scope of the market. I had tunnel vision looking at the range it was trading in. I thought it would test the bottom part of the range again. The one thing I should have caught on to was the range dissolving as it made higher lows.

In terms of my trading style, it was justified as the risk should have been only 3-4 ticks. However, I broke my rules and let it go further against me. The other thing, looking back through the video, I noticed is the continued pattern of buyers absorbing the sellers. You can see it happen right at the top of the range before it rallied.

  1. I see what you’re talking about, the bull candles are much more fluid and consistent while the bear candles seem to be choppy and forced. Another indication that buying was going to be the path of least resistance.

  2. [quote=“Trader, post:134, topic:3546”]
    I noticed that at times you added more indicators and studies while sitting in a position that was moving against you which may be a sign that you’re looking to confirm a bias towards the position that you’re currently in. This potential bias could also be seen in the way that the trend lines and channels were being drawn.

  • This is great feedback, and something I wasn’t consciously aware of. The fact that I was in trade and adding more indicators or looking at different things. That says to me that I wasn’t confident in the trade or as you mentioned, looking for validation after the fact. That’s a huge red flag in my opinion and something I’ll be making sure I’m aware of.

Looking back, I do think it was an effort to justify an unsure trade or idea. However, I need to be doing that before entering or using that information to validate or foil my idea.

  1. Buy-side absorption has been a common theme this week, well, the only theme. Price has continued to rally even though sellers are outnumbering buyers (on the aggressive side). Looking back I didn’t keep this front of mind, but did notice it after the fact and was able to adjust my plan a bit.

On today’s trade, 4/8/21, I was still biased to the sell-side but did notice when there was buy-side absorption and reversed a few times.

There is a substantial risk of loss in futures trading. Past performance is not indicative of future results. The figures here represent an opinion. The placement of contingent orders by you or broker, or trading advisor, such as a “stop-loss” or “stop-limit” order, will not necessarily limit your losses to the intended amounts, since market conditions may make it impossible to execute such orders. Please conduct your own due diligence if Futures are an appropriate instrument for you.

1 Like

Market Outlook for 4/9/21 ES Mini.

Today was an interesting day. Tons of choppy trade with small ranges, then a quick rally right before the close. Absorption, aggressive selling, etc, etc. Let’s take a look:

The past few days we were testing resistance at 4074.00. Yesterday we broke that level to the upside and then price came down to test it as support.

As it has been the past few days, sellers outnumbered buyers in terms of the delta but there have been so many buyers backing up the bid that price continues to rise.

Today’s trade showed more buying at the higher prices, this could be attributed to stops being hit as well.

Here is the moment when price touched the 4074.00 level.

Price dipped below that level briefly, with buyers soaking up liquidity and keeping price moving higher.

Right now we are seeing price potentially repeat a pattern where previous resistance turns to support. We will continue to watch for heavy selling absorbed by passive buyers. As it has played out recently, price has continued to move up despite the aggressive selling. Until buyers really have backed off, price may continue to rise no matter how much volume the sellers throw at the market.

There is a substantial risk of loss in futures trading. Past performance is not indicative of future results. The figures here represent an opinion. The placement of contingent orders by you or broker, or trading advisor, such as a “stop-loss” or “stop-limit” order, will not necessarily limit your losses to the intended amounts, since market conditions may make it impossible to execute such orders. Please conduct your own due diligence if Futures are an appropriate instrument for you.

Market Update 4/9/21 Friday 8:52 AM Pacific.

Price moved up straight from the open to test the highs and is following an uptrend slope.

We are seeing less passive buying driving price up, which has allowed the market to better respect resistance levels.

Plan is to keep trading ranges while capitalizing on bigger moves when buyers and sellers can’t defend the support/resistance.

There is a substantial risk of loss in futures trading. Past performance is not indicative of future results. The figures here represent an opinion. The placement of contingent orders by you or broker, or trading advisor, such as a “stop-loss” or “stop-limit” order, will not necessarily limit your losses to the intended amounts, since market conditions may make it impossible to execute such orders. Please conduct your own due diligence if Futures are an appropriate instrument for you.

Potential double top if price holds here at 4098.50.

There is a substantial risk of loss in futures trading. Past performance is not indicative of future results. The figures here represent an opinion. The placement of contingent orders by you or broker, or trading advisor, such as a “stop-loss” or “stop-limit” order, will not necessarily limit your losses to the intended amounts, since market conditions may make it impossible to execute such orders. Please conduct your own due diligence if Futures are an appropriate instrument for you.

1 Like

Market Update 4/9/21 Friday 10:40 AM Pacific.

Price just broke above the 4098.50 level we were watching, appears to be moving toward the all time high at 4102.50.

I exited my short position and am waiting for price to consolidate at a new level to see where buyers and sellers are.

The last leg of this move showed clear direction in delta which is what drove price.

There is a substantial risk of loss in futures trading. Past performance is not indicative of future results. The figures here represent an opinion. The placement of contingent orders by you or broker, or trading advisor, such as a “stop-loss” or “stop-limit” order, will not necessarily limit your losses to the intended amounts, since market conditions may make it impossible to execute such orders. Please conduct your own due diligence if Futures are an appropriate instrument for you.

1 Like

Market Update 4/9/21 Friday 11:18 AM Pacific.

Price did make new highs but didn’t move high enough to hit any stops that were significant enough to move the market up.

We have held in a range and are creeping up to the highs again with less than 2 hours left in trading.

If buyers can control the market and keep inching price up, we could potentially some nice movement above 4104.00.

There is a substantial risk of loss in futures trading. Past performance is not indicative of future results. The figures here represent an opinion. The placement of contingent orders by you or broker, or trading advisor, such as a “stop-loss” or “stop-limit” order, will not necessarily limit your losses to the intended amounts, since market conditions may make it impossible to execute such orders. Please conduct your own due diligence if Futures are an appropriate instrument for you.

1 Like

WOW! these are awesome! I had asked a question on a previous message board but this pretty much answered my question. I took a short 9:53 at 4097 and I got beat up as a result. I think I need to really learn the process of passive buying, all I was seeing was heavy short selling volume.

1 Like

Market Update 4/11/21 Sunday.

Globex opened and gradually sold off, currently at 4107.00. If we continue to slide down there is resistance at 4102.50, 4098.50 and 4095.00.

If price does not come down below those areas and specifically to 4091.25, there is a potential VPOC at that level.

Price movement has followed a similar pattern on the way up, potentially forming a new wave similar to the prior moves:

Strategy will be watching for buyers to hold price up at resistance levels and getting long. If we see a change in buyer strength we will look for momentum on the downside while respecting support levels.

There is a substantial risk of loss in futures trading. Past performance is not indicative of future results. The figures here represent an opinion. The placement of contingent orders by you or broker, or trading advisor, such as a “stop-loss” or “stop-limit” order, will not necessarily limit your losses to the intended amounts, since market conditions may make it impossible to execute such orders. Please conduct your own due diligence if Futures are an appropriate instrument for you.

Glad you find them useful, thank you.

Yes, the passive buying has been interesting to watch lately. I believe on Friday we noticed huge amounts of iceberg orders on the bid side.

I’m curious to see how the trade is tomorrow and if that pattern is going to change.

Fib Levels.

Forgot to mention, fib levels have been followed fairly closely by price lately. @autobahn pointed this out to me last week, thank you!

Market Update 4/12/21 Monday.

Price is creeping back toward the highs as we approach the opening bell. This move may potentially have follow-through if buyers are aggressive from the gate.

There is a substantial risk of loss in futures trading. Past performance is not indicative of future results. The figures here represent an opinion. The placement of contingent orders by you or broker, or trading advisor, such as a “stop-loss” or “stop-limit” order, will not necessarily limit your losses to the intended amounts, since market conditions may make it impossible to execute such orders. Please conduct your own due diligence if Futures are an appropriate instrument for you.

Market Update 4/12/21 Monday.

Sellers are pushing price lower to overnight support levels. We will watch buyers at those levels to see how they respond.

There is a substantial risk of loss in futures trading. Past performance is not indicative of future results. The figures here represent an opinion. The placement of contingent orders by you or broker, or trading advisor, such as a “stop-loss” or “stop-limit” order, will not necessarily limit your losses to the intended amounts, since market conditions may make it impossible to execute such orders. Please conduct your own due diligence if Futures are an appropriate instrument for you.

Market Update.

The quick move down was just that, quick. Price has moved right back into the trend line drawn before the open.

If the market is indeed going to continue the uptrend it will have to keep respecting support levels and make higher lows.

There is a substantial risk of loss in futures trading. Past performance is not indicative of future results. The figures here represent an opinion. The placement of contingent orders by you or broker, or trading advisor, such as a “stop-loss” or “stop-limit” order, will not necessarily limit your losses to the intended amounts, since market conditions may make it impossible to execute such orders. Please conduct your own due diligence if Futures are an appropriate instrument for you.

Hey Ben!

How do you monitor large passive buying. I really am having a hard time grasping this. I find a-lot of what I read turns out to be contradictory. For ex: If we’re at resistance, and we’re seeing large bid volume at the high of the bar. I always took this as an indication that the shorts were building a wall. However this can also indicate passive buying right? So like how do you interpret this information?

Thank-you

Great question, and can be a very frustrating one.

Your hunch that it can be contradictory is accurate, that’s because it depends on the situation.

Here’s the 2000 tick chart from 12:22 today. Price came up to 4115.75 and stopped due to heavy absorption from the offer.

This was an iceberg order that just kept on filling up, moving price down 8 ticks before continuing up.

There are probably many opinions on what this is. We don’t necessarily want to determine what it is or isn’t, but how to use the information to make better decisions for trades.

To do that we need to look at what the market is/was doing.

Price had sold off to form a range, it looked like it was going to make lower lows but then rallied to the top of the range a few ticks through it (4115.75 area), then stopped here with that order.

Maybe it is longs getting out of their trade, or a big short position. We will never know. However, if we are seeing the sentiment change in the market where buyers started dominating we could use this to our advantage. Something like:

I see a lot of selling here, passive selling. I’m still biased to be long, so I’m going to wait for a retest of the range or bottom of the range to enter and watch this level if price reaches it again.

At that point, I may exit or ride a rally with potentially added volume from short traders covering.

That’s about the best we can do!

There is a substantial risk of loss in futures trading. Past performance is not indicative of future results. The figures here represent an opinion. The placement of contingent orders by you or broker, or trading advisor, such as a “stop-loss” or “stop-limit” order, will not necessarily limit your losses to the intended amounts, since market conditions may make it impossible to execute such orders. Please conduct your own due diligence if Futures are an appropriate instrument for you.

Market Update 4/13/21 Tuesday.

At 4:00 AM Pacific time price dropped to 4101.25 then grinded back to the highs at 4126.50. We are currently trading in a range that seems to be sensitive to selling activity, making lower highs on the 5 minute.

We will watch to see if sellers can push price lower that may potentially force buyers to puke, pushing price to lower support levels.

There is a substantial risk of loss in futures trading. Past performance is not indicative of future results. The figures here represent an opinion. The placement of contingent orders by you or broker, or trading advisor, such as a “stop-loss” or “stop-limit” order, will not necessarily limit your losses to the intended amounts, since market conditions may make it impossible to execute such orders. Please conduct your own due diligence if Futures are an appropriate instrument for you.

Market Update Trading Into Close.

ES Mini Futures just hit a new all time high at 4139.75. Price pulled back to 4136.75.

We will see how buyers respond to price as it approaches the recent high again.

Note - 10 mins before 1 PM Pacific starts to get a bit wild with algos and traders exiting positions.

There is a substantial risk of loss in futures trading. Past performance is not indicative of future results. The figures here represent an opinion. The placement of contingent orders by you or broker, or trading advisor, such as a “stop-loss” or “stop-limit” order, will not necessarily limit your losses to the intended amounts, since market conditions may make it impossible to execute such orders. Please conduct your own due diligence if Futures are an appropriate instrument for you.

Market Update 4/14/21 Wednesday.

ES Mini Futures opened up at the lows and immediately rallied to new highs at 4144.00. On the 5 minute chart bars had a wide range of up to 5 points with price action going in various directions with no clear pattern.

Right now the market is in a clear range and trade opportunities should be trading the range until there is clear evidence that buyers or sellers have the momentum to push price out of the range.

There is a nice trendline that is currently holding on the 15 minute chart, continuing to push price up. That will need to be broken with volume to turn to the downside.

There is a substantial risk of loss in futures trading. Past performance is not indicative of future results. The figures here represent an opinion. The placement of contingent orders by you or broker, or trading advisor, such as a “stop-loss” or “stop-limit” order, will not necessarily limit your losses to the intended amounts, since market conditions may make it impossible to execute such orders. Please conduct your own due diligence if Futures are an appropriate instrument for you.