S&P 500 Futures Market Outlook - Trends and Levels ES MES

Trading plan 3/24/21 Wednesday.

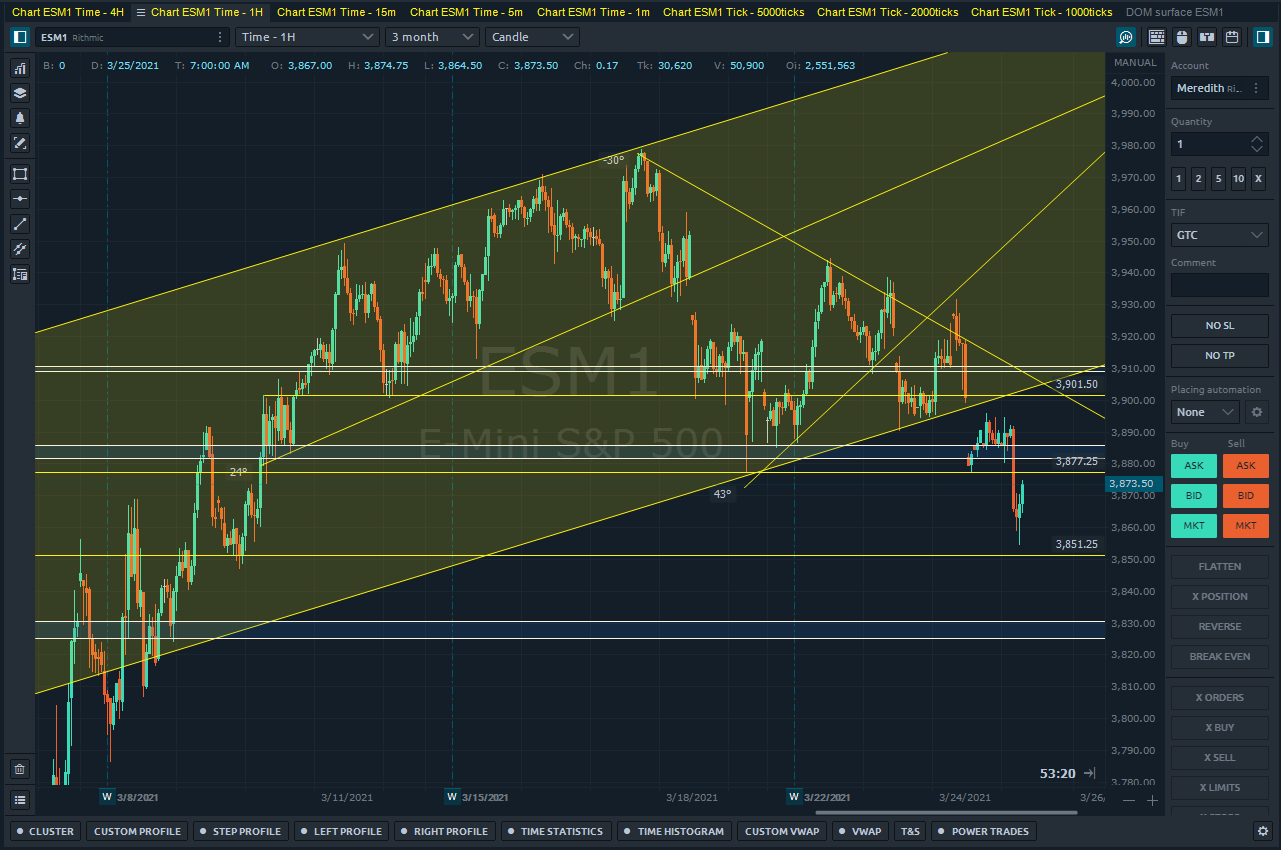
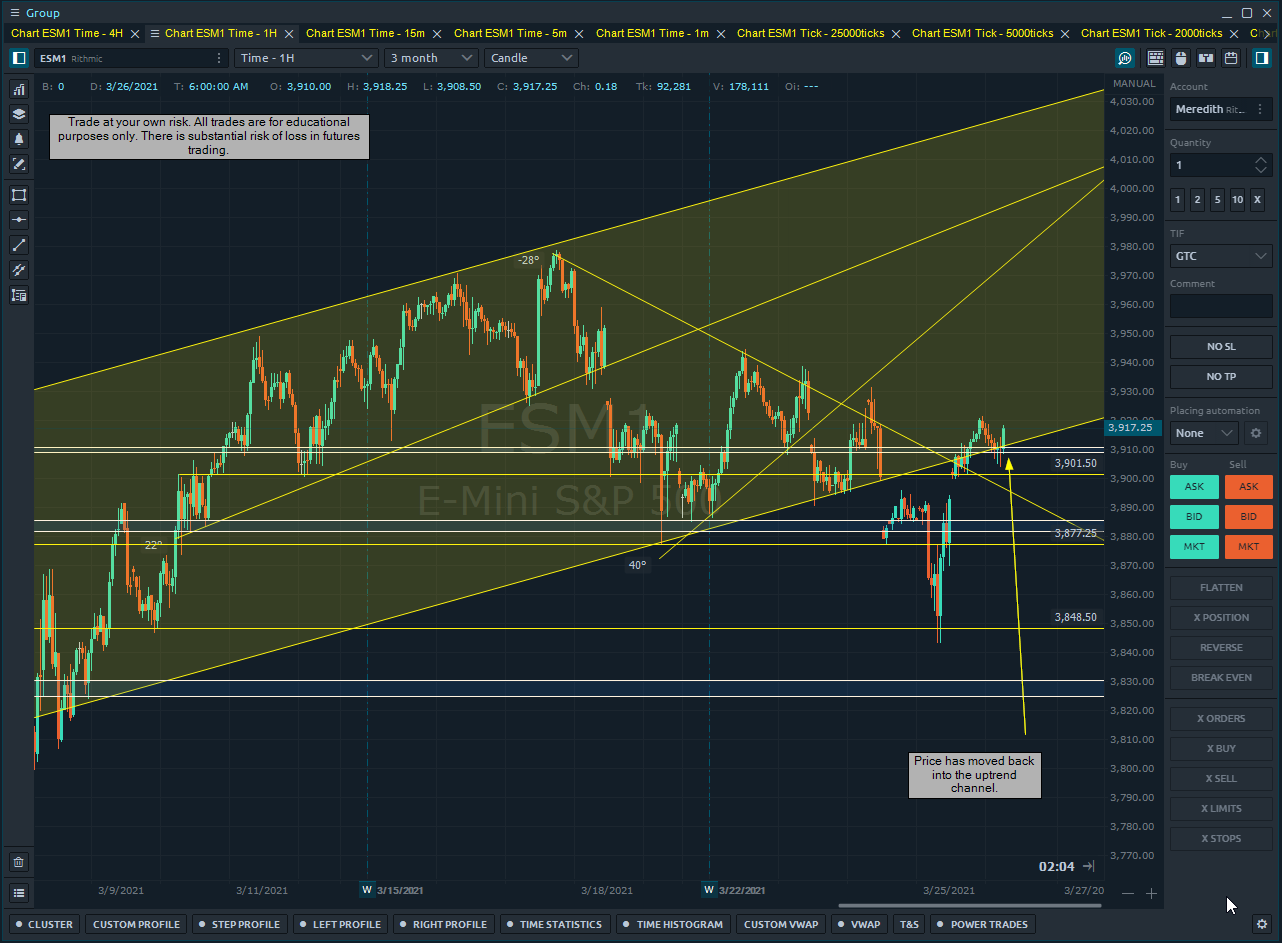
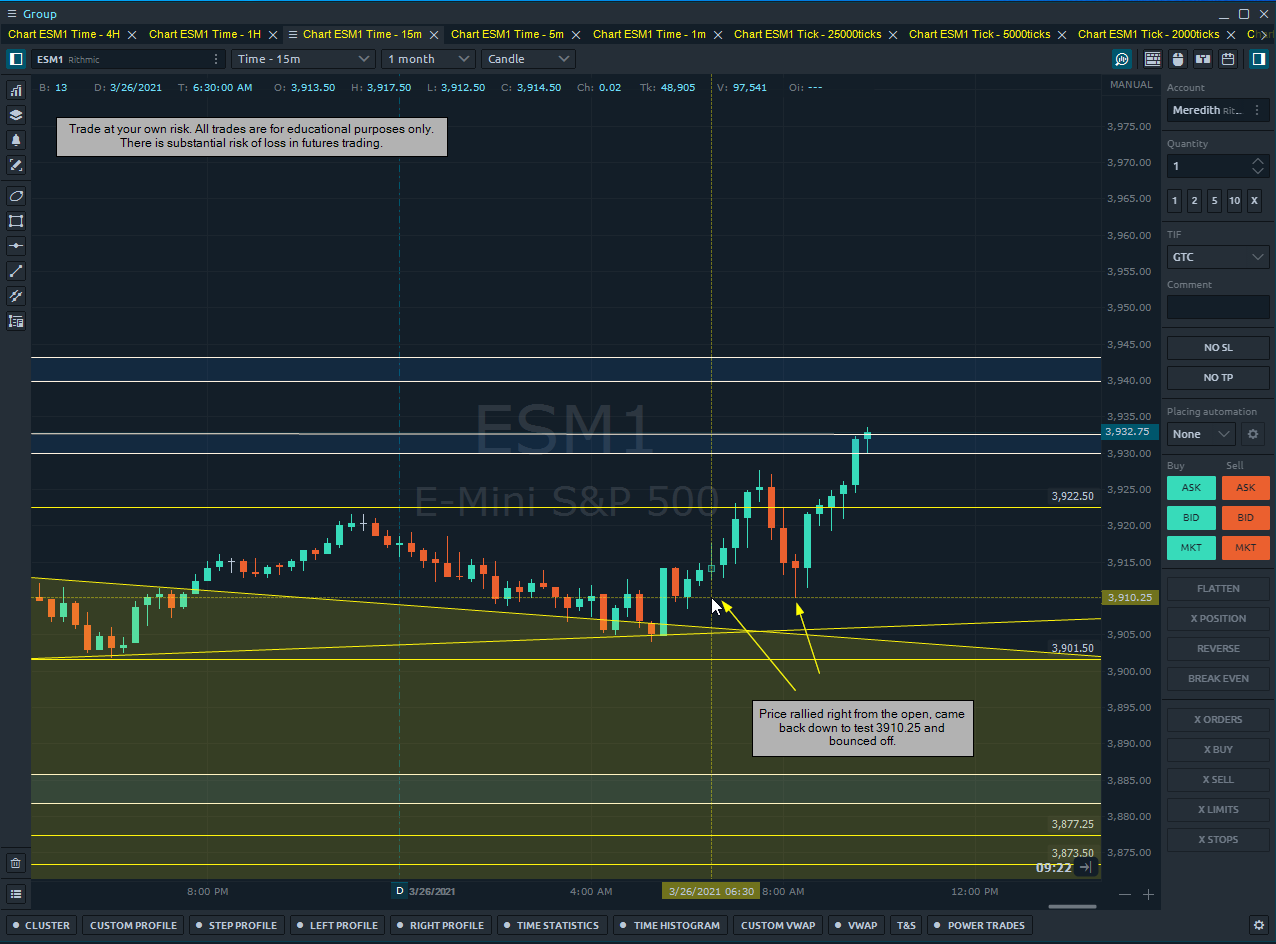
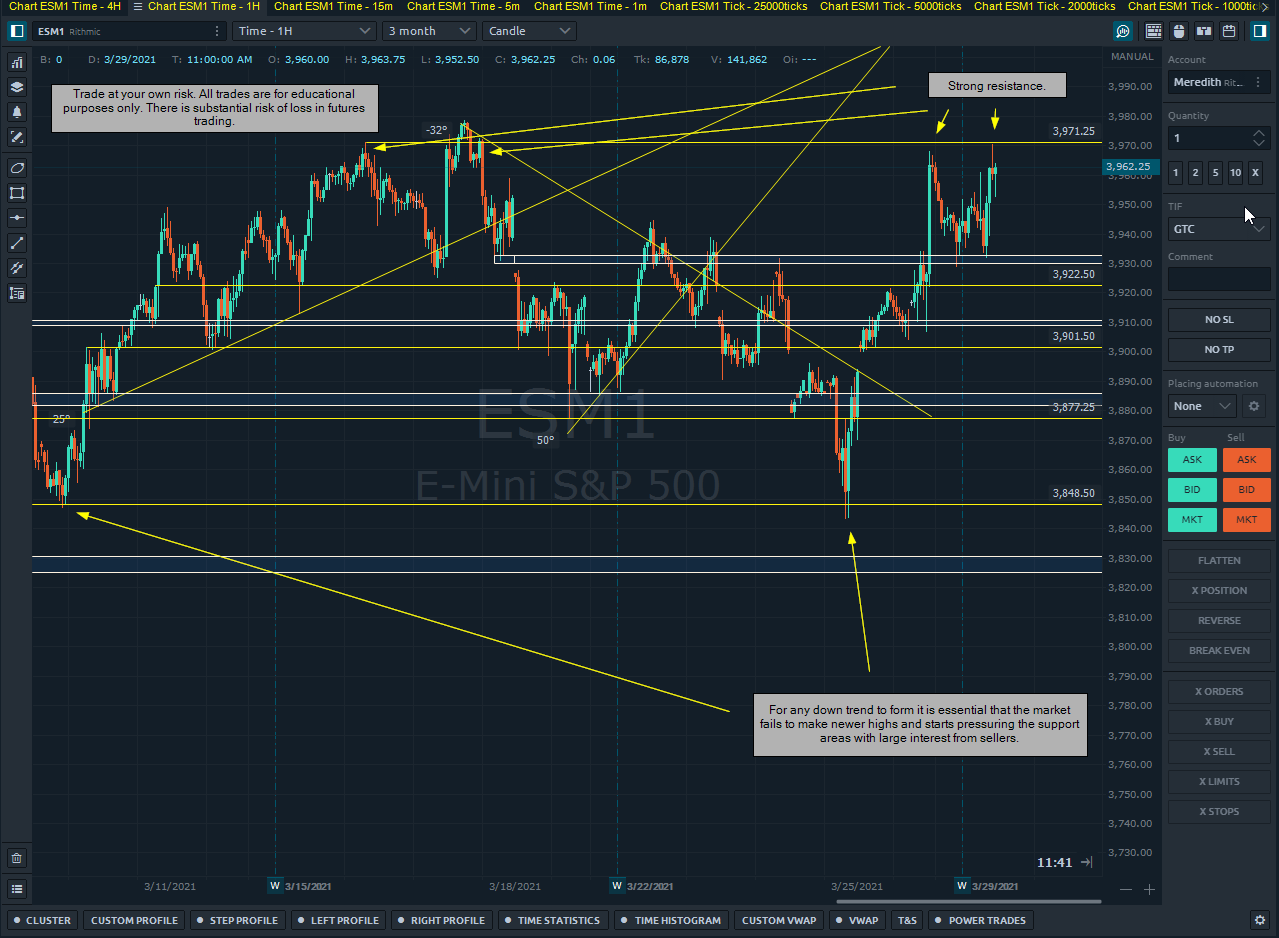
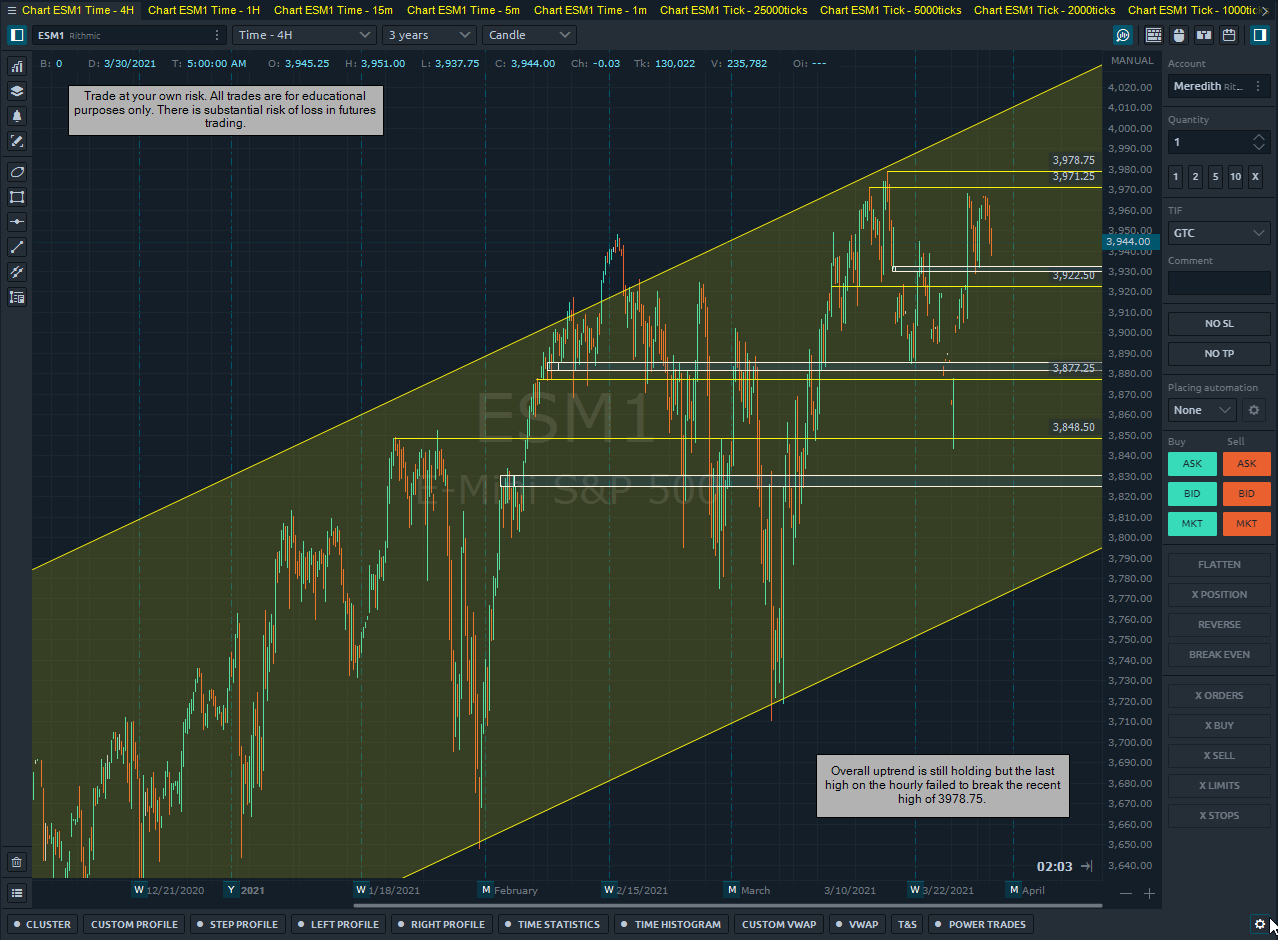
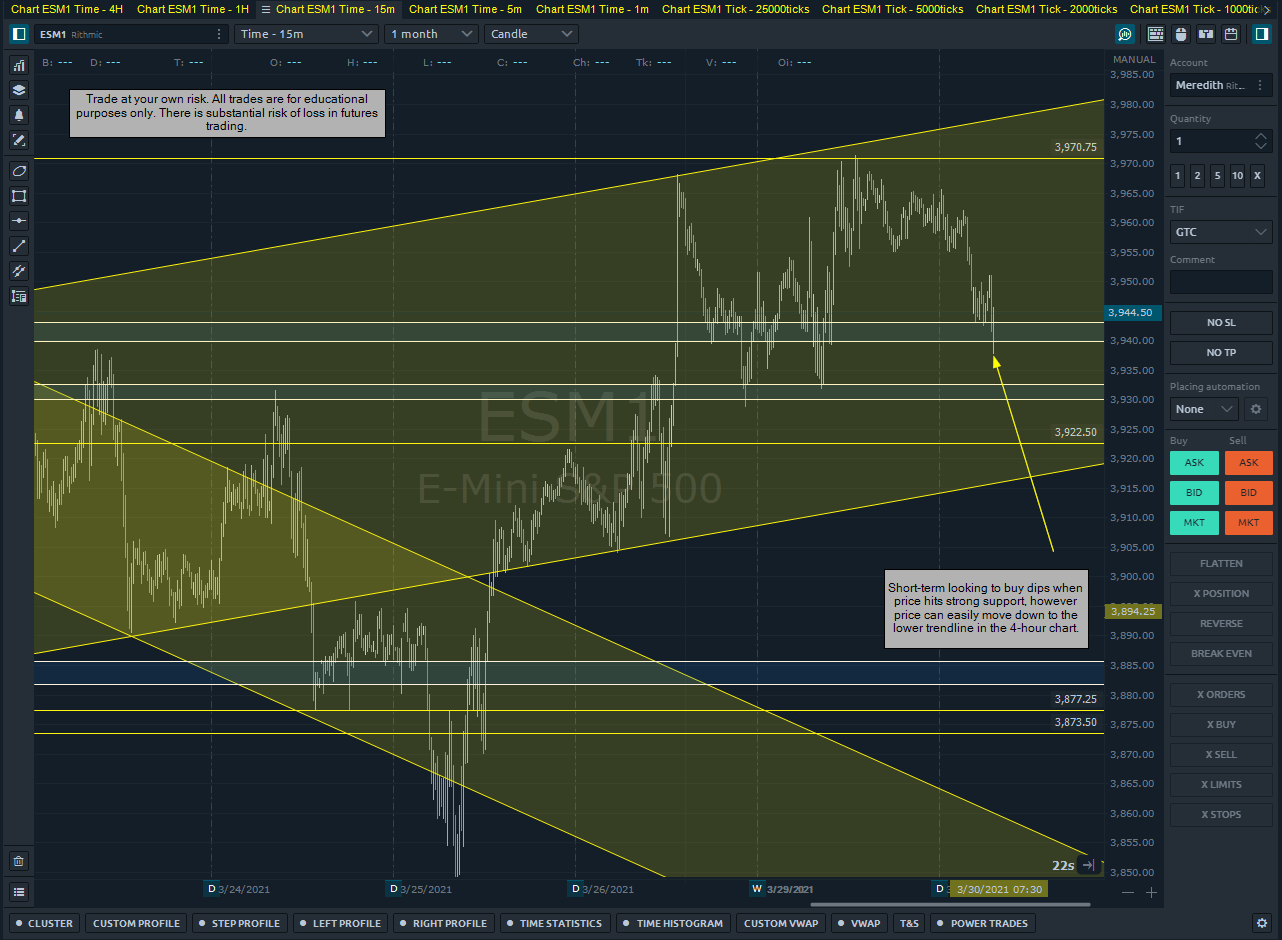
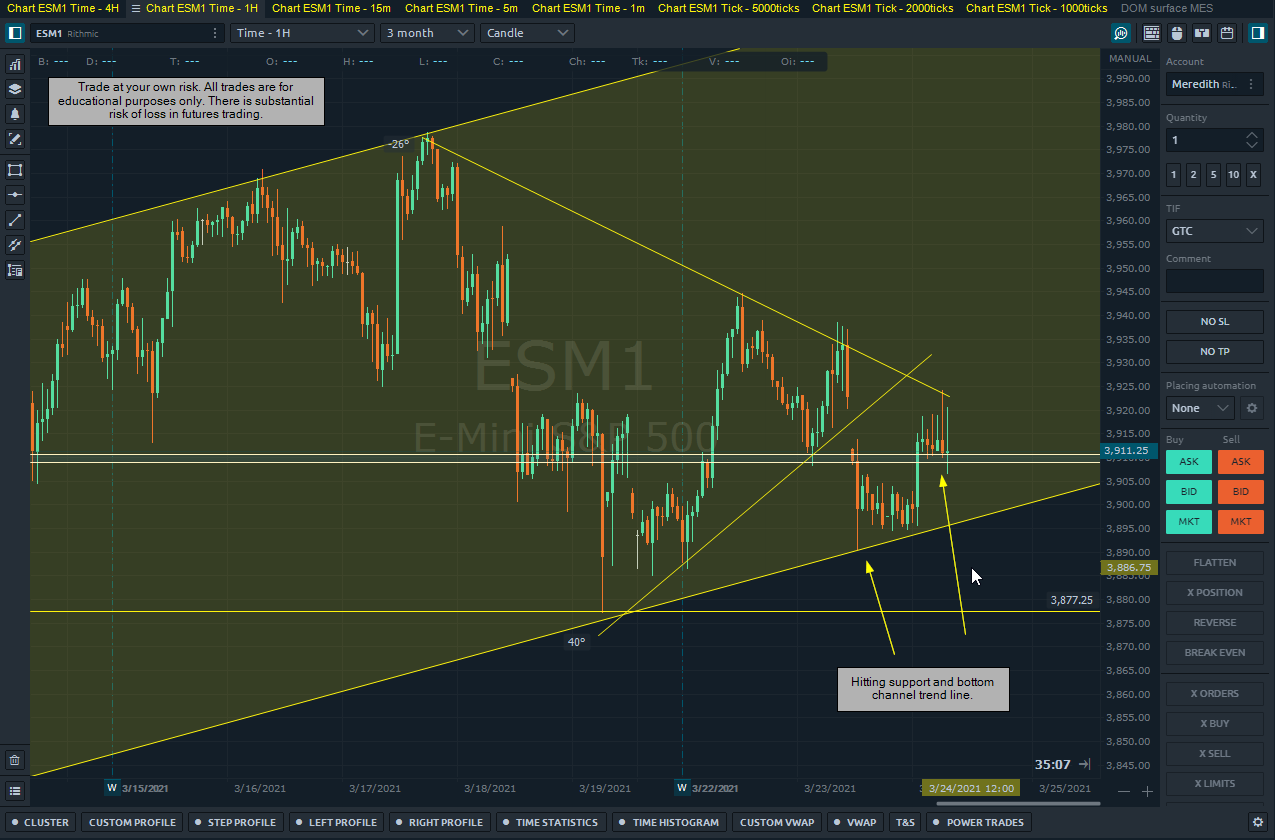
Price has moved lower in the channel and I’ll still be looking for areas to buy dips. Any short term breakout to the downside I’ll watch out for to see if it can be caught as well.

Mental Prep:

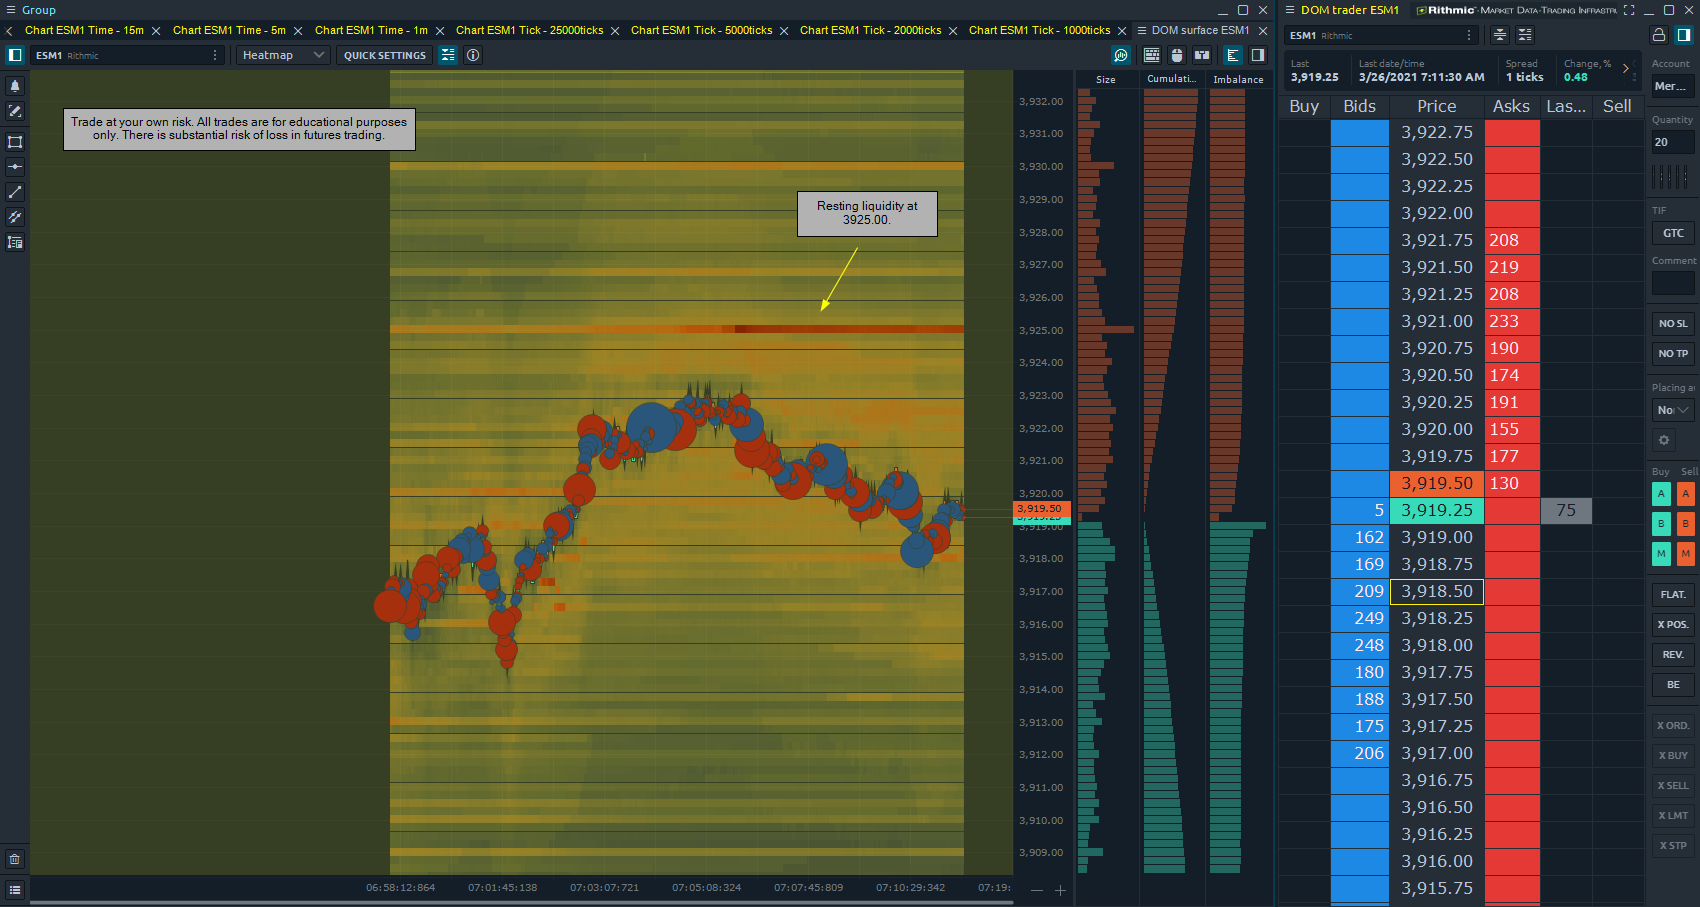
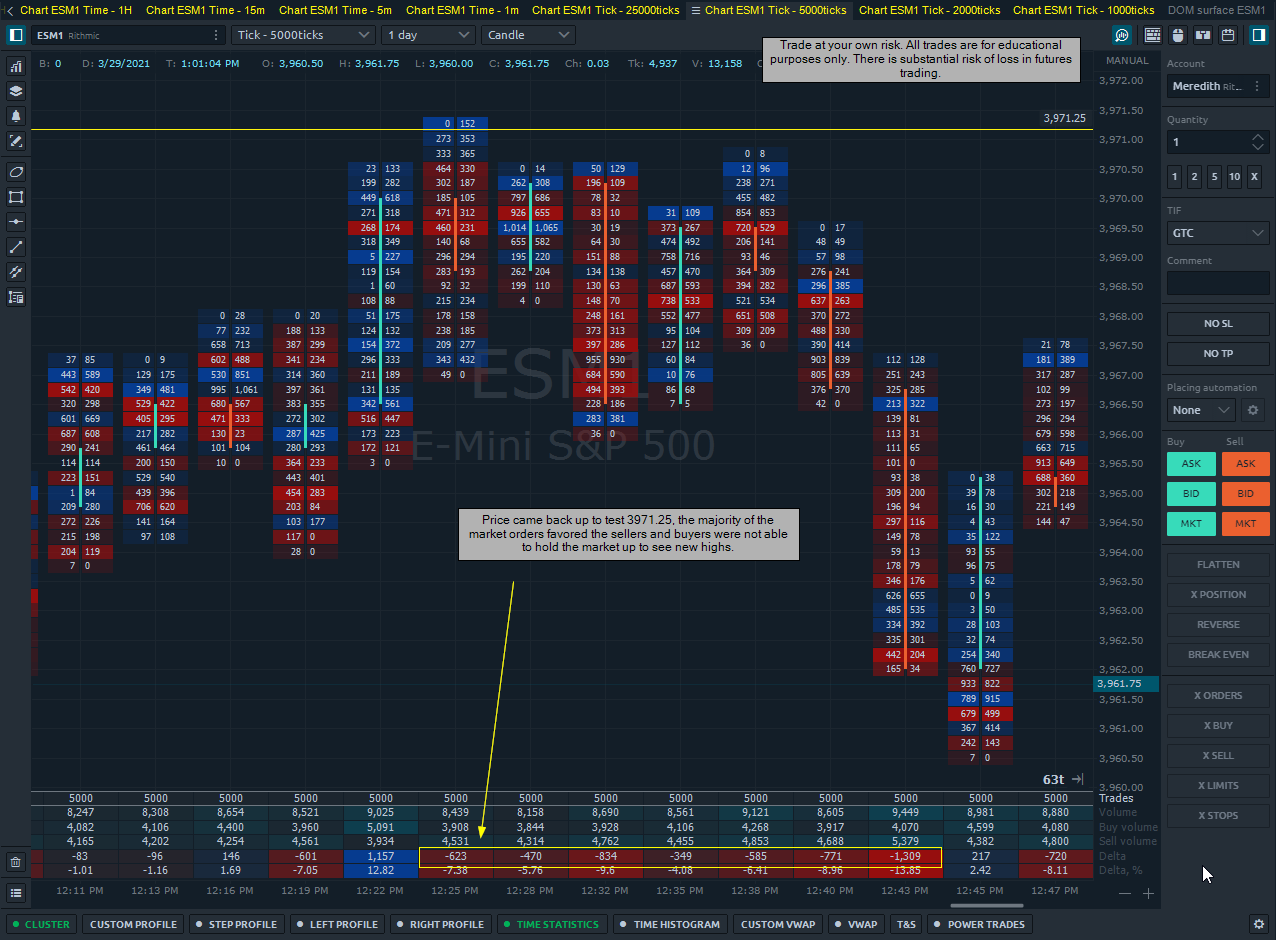
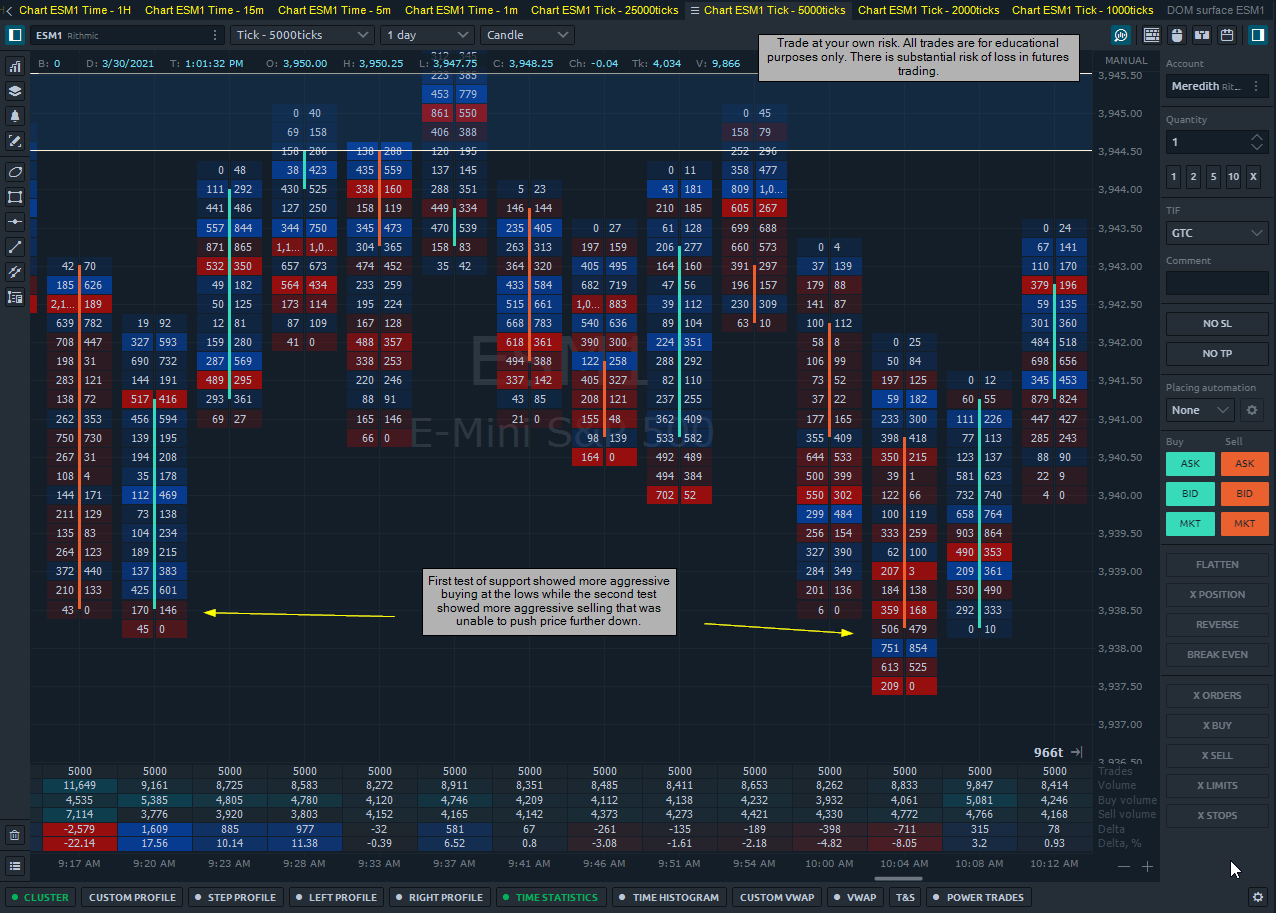
More tired today but still mentally clear and ready. I have a better picture of my plan today and I know I can find the right spots to enter the market. I’ll be watching the DOM surface as well to ensure I’m entering at key levels with liquidity.

Market and self-assessment:

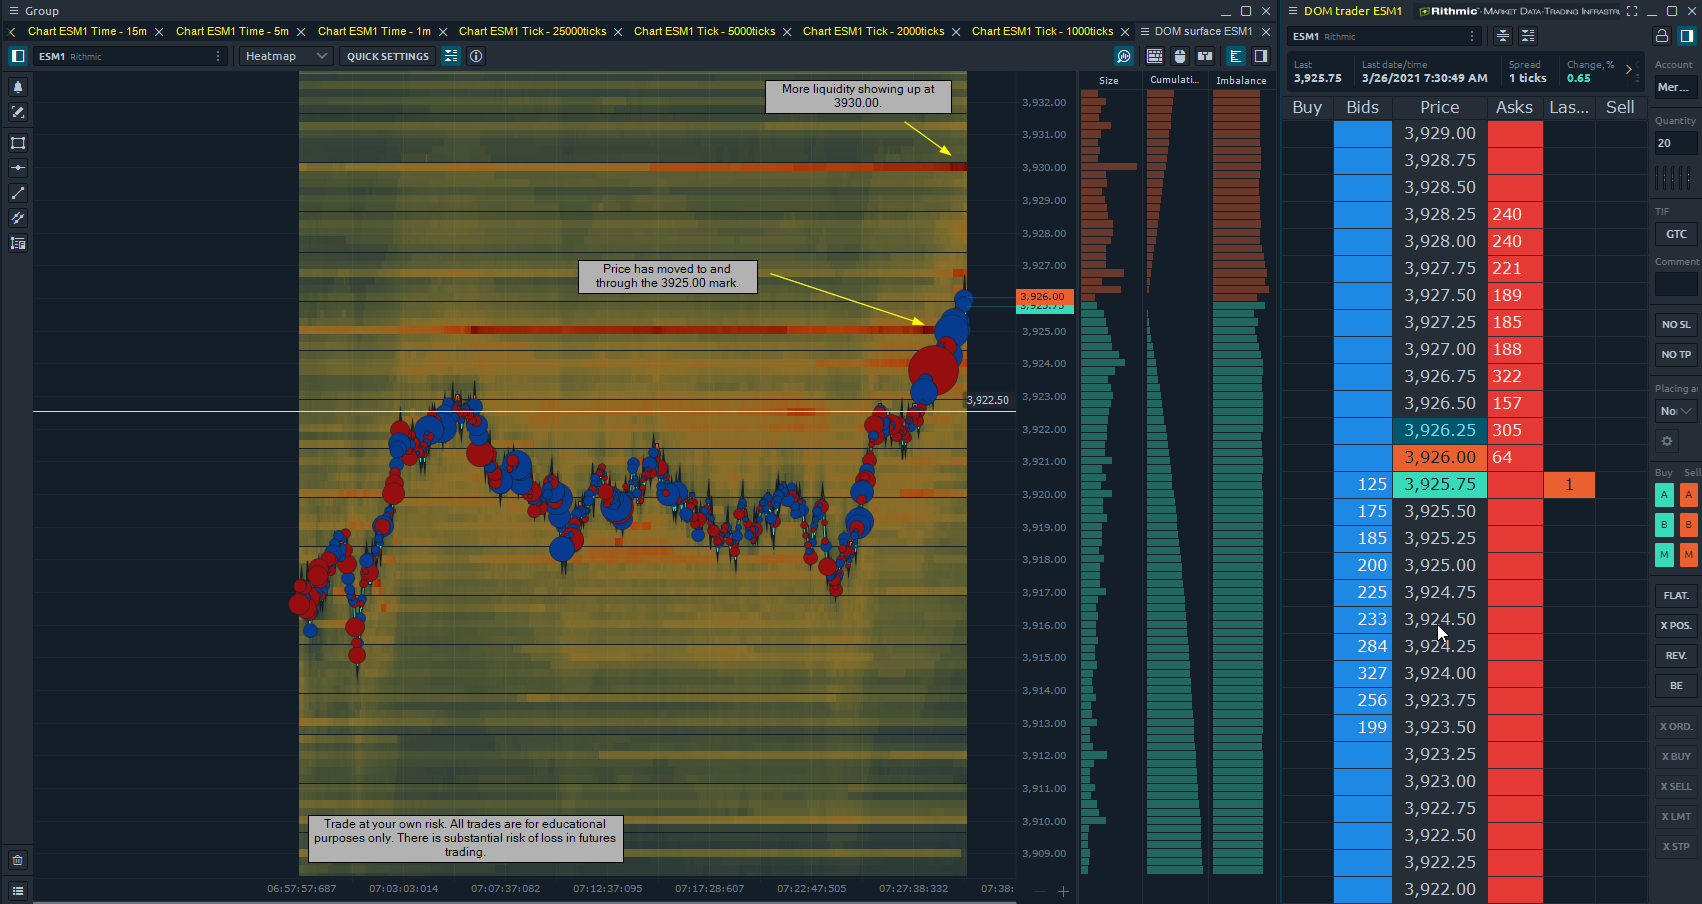
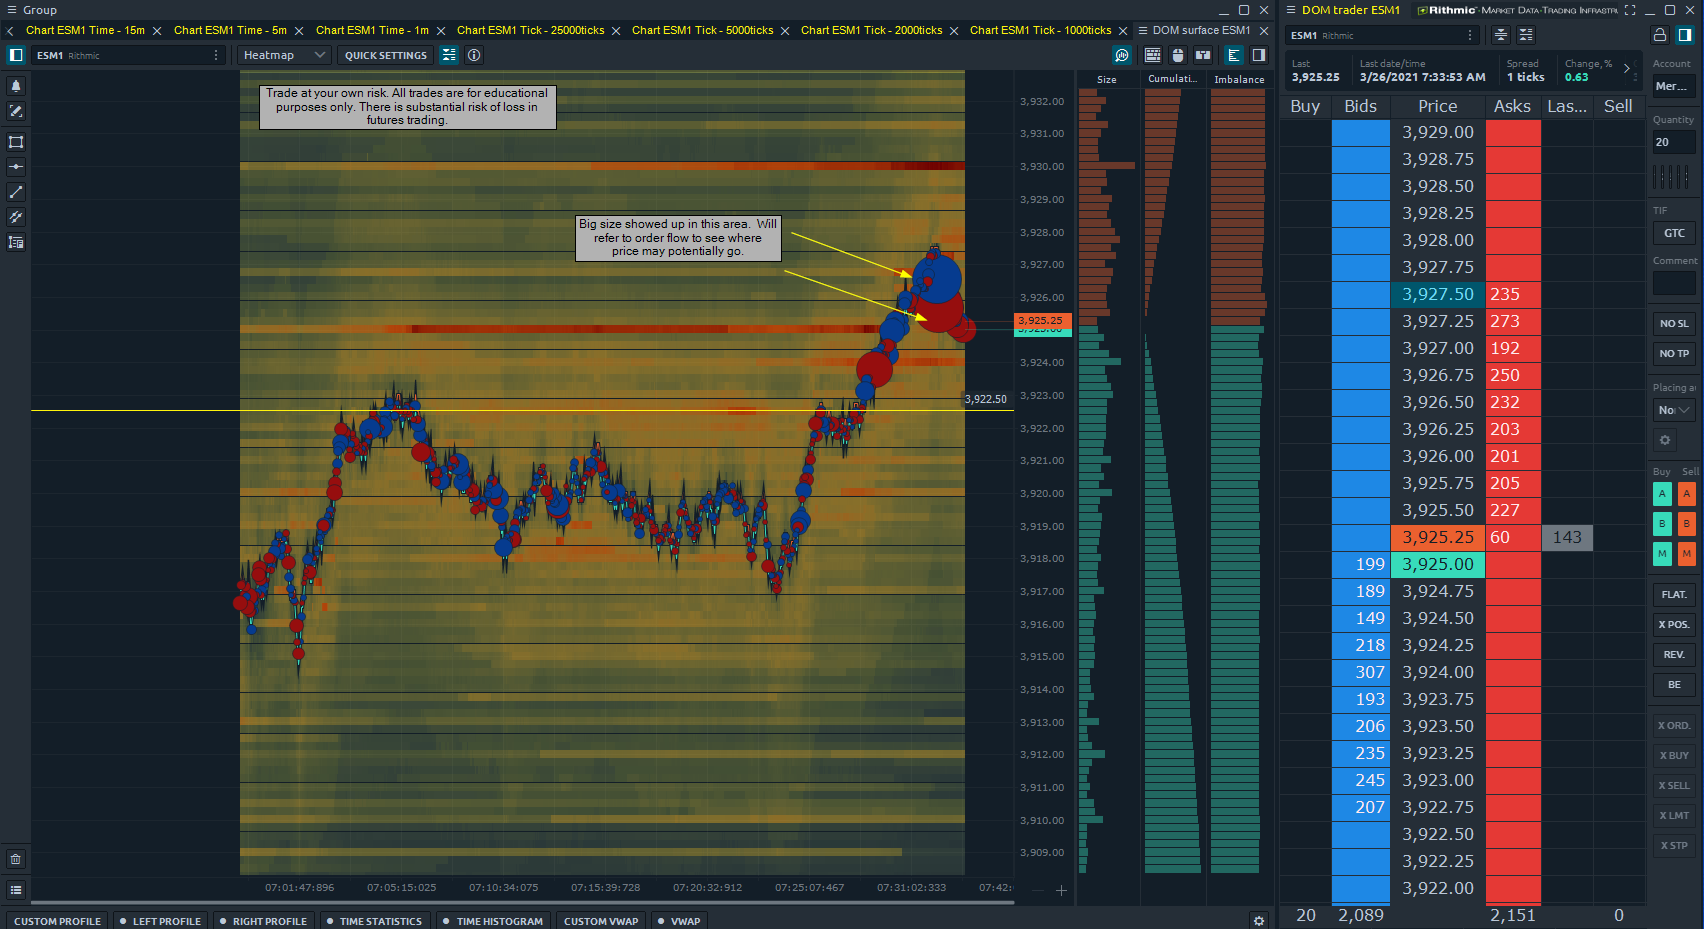
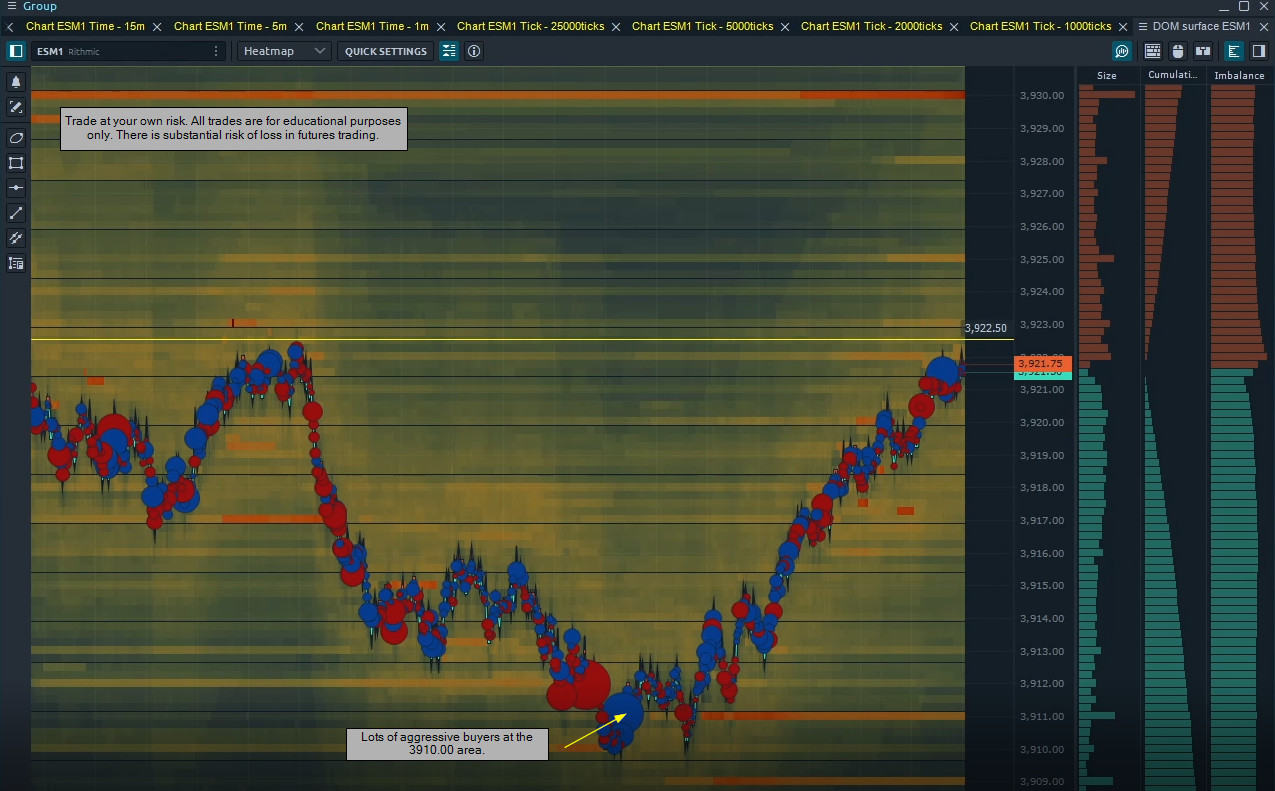
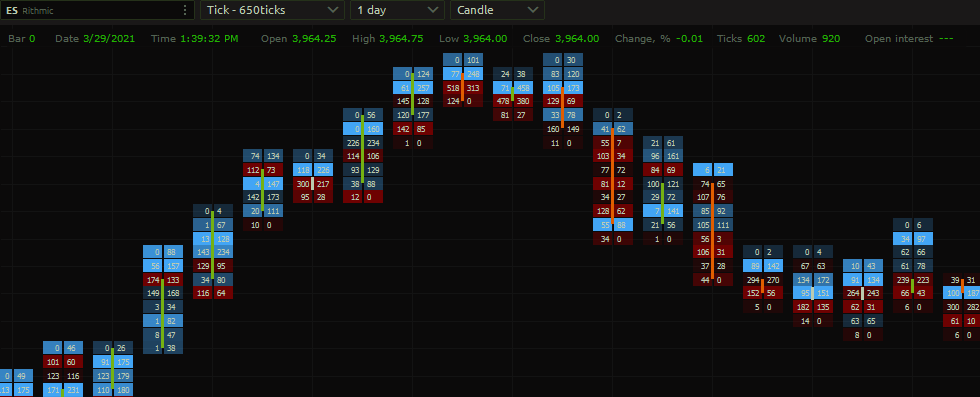
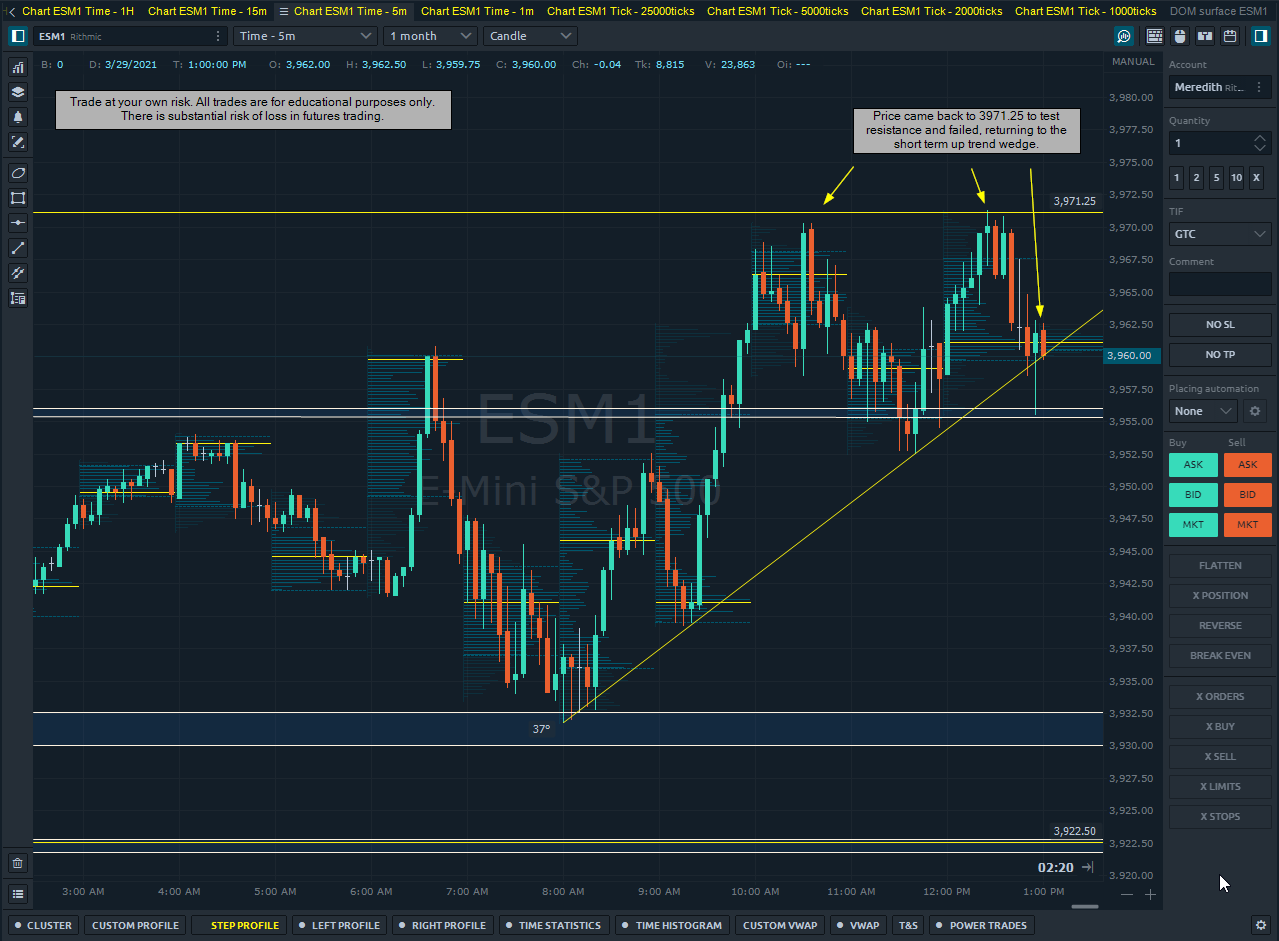
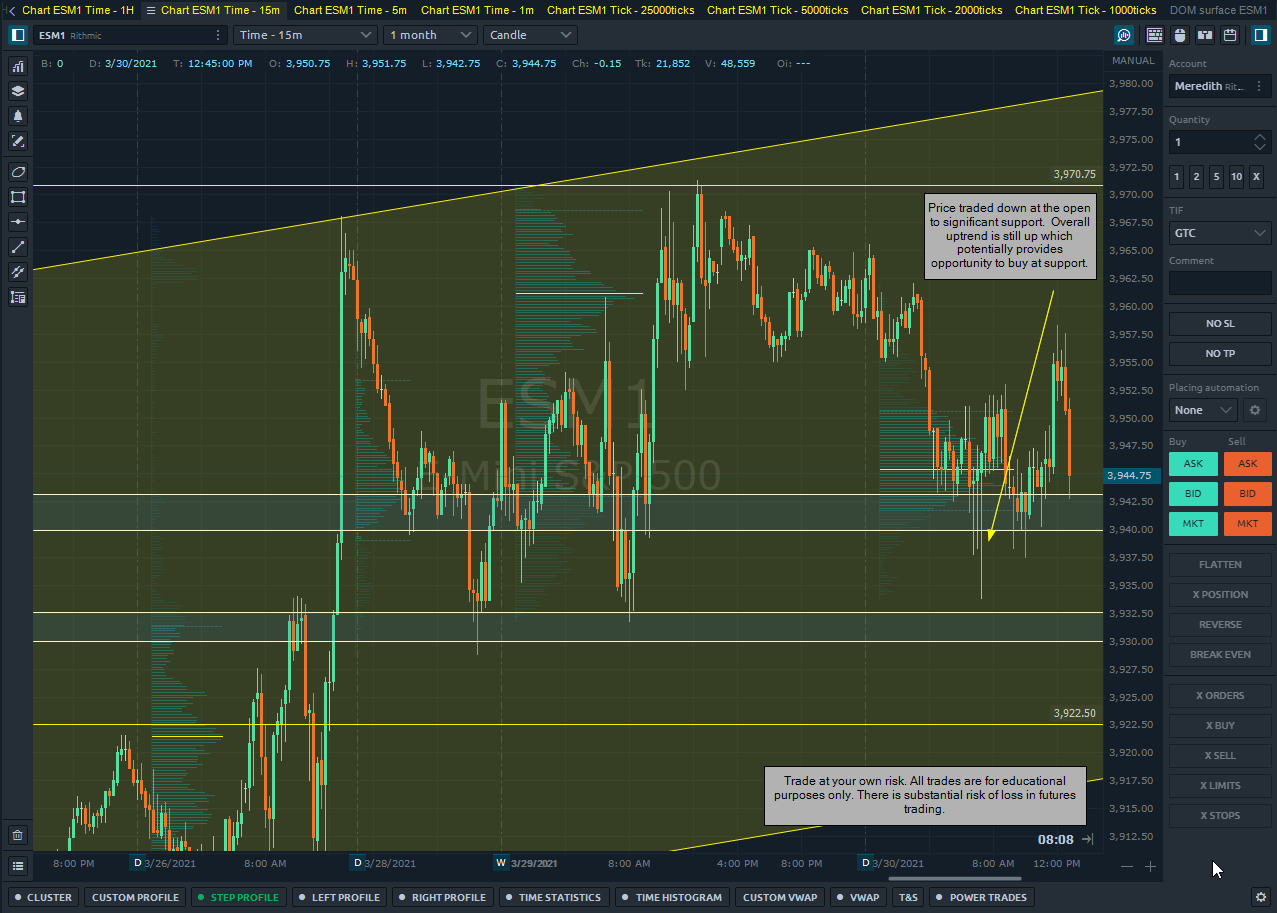
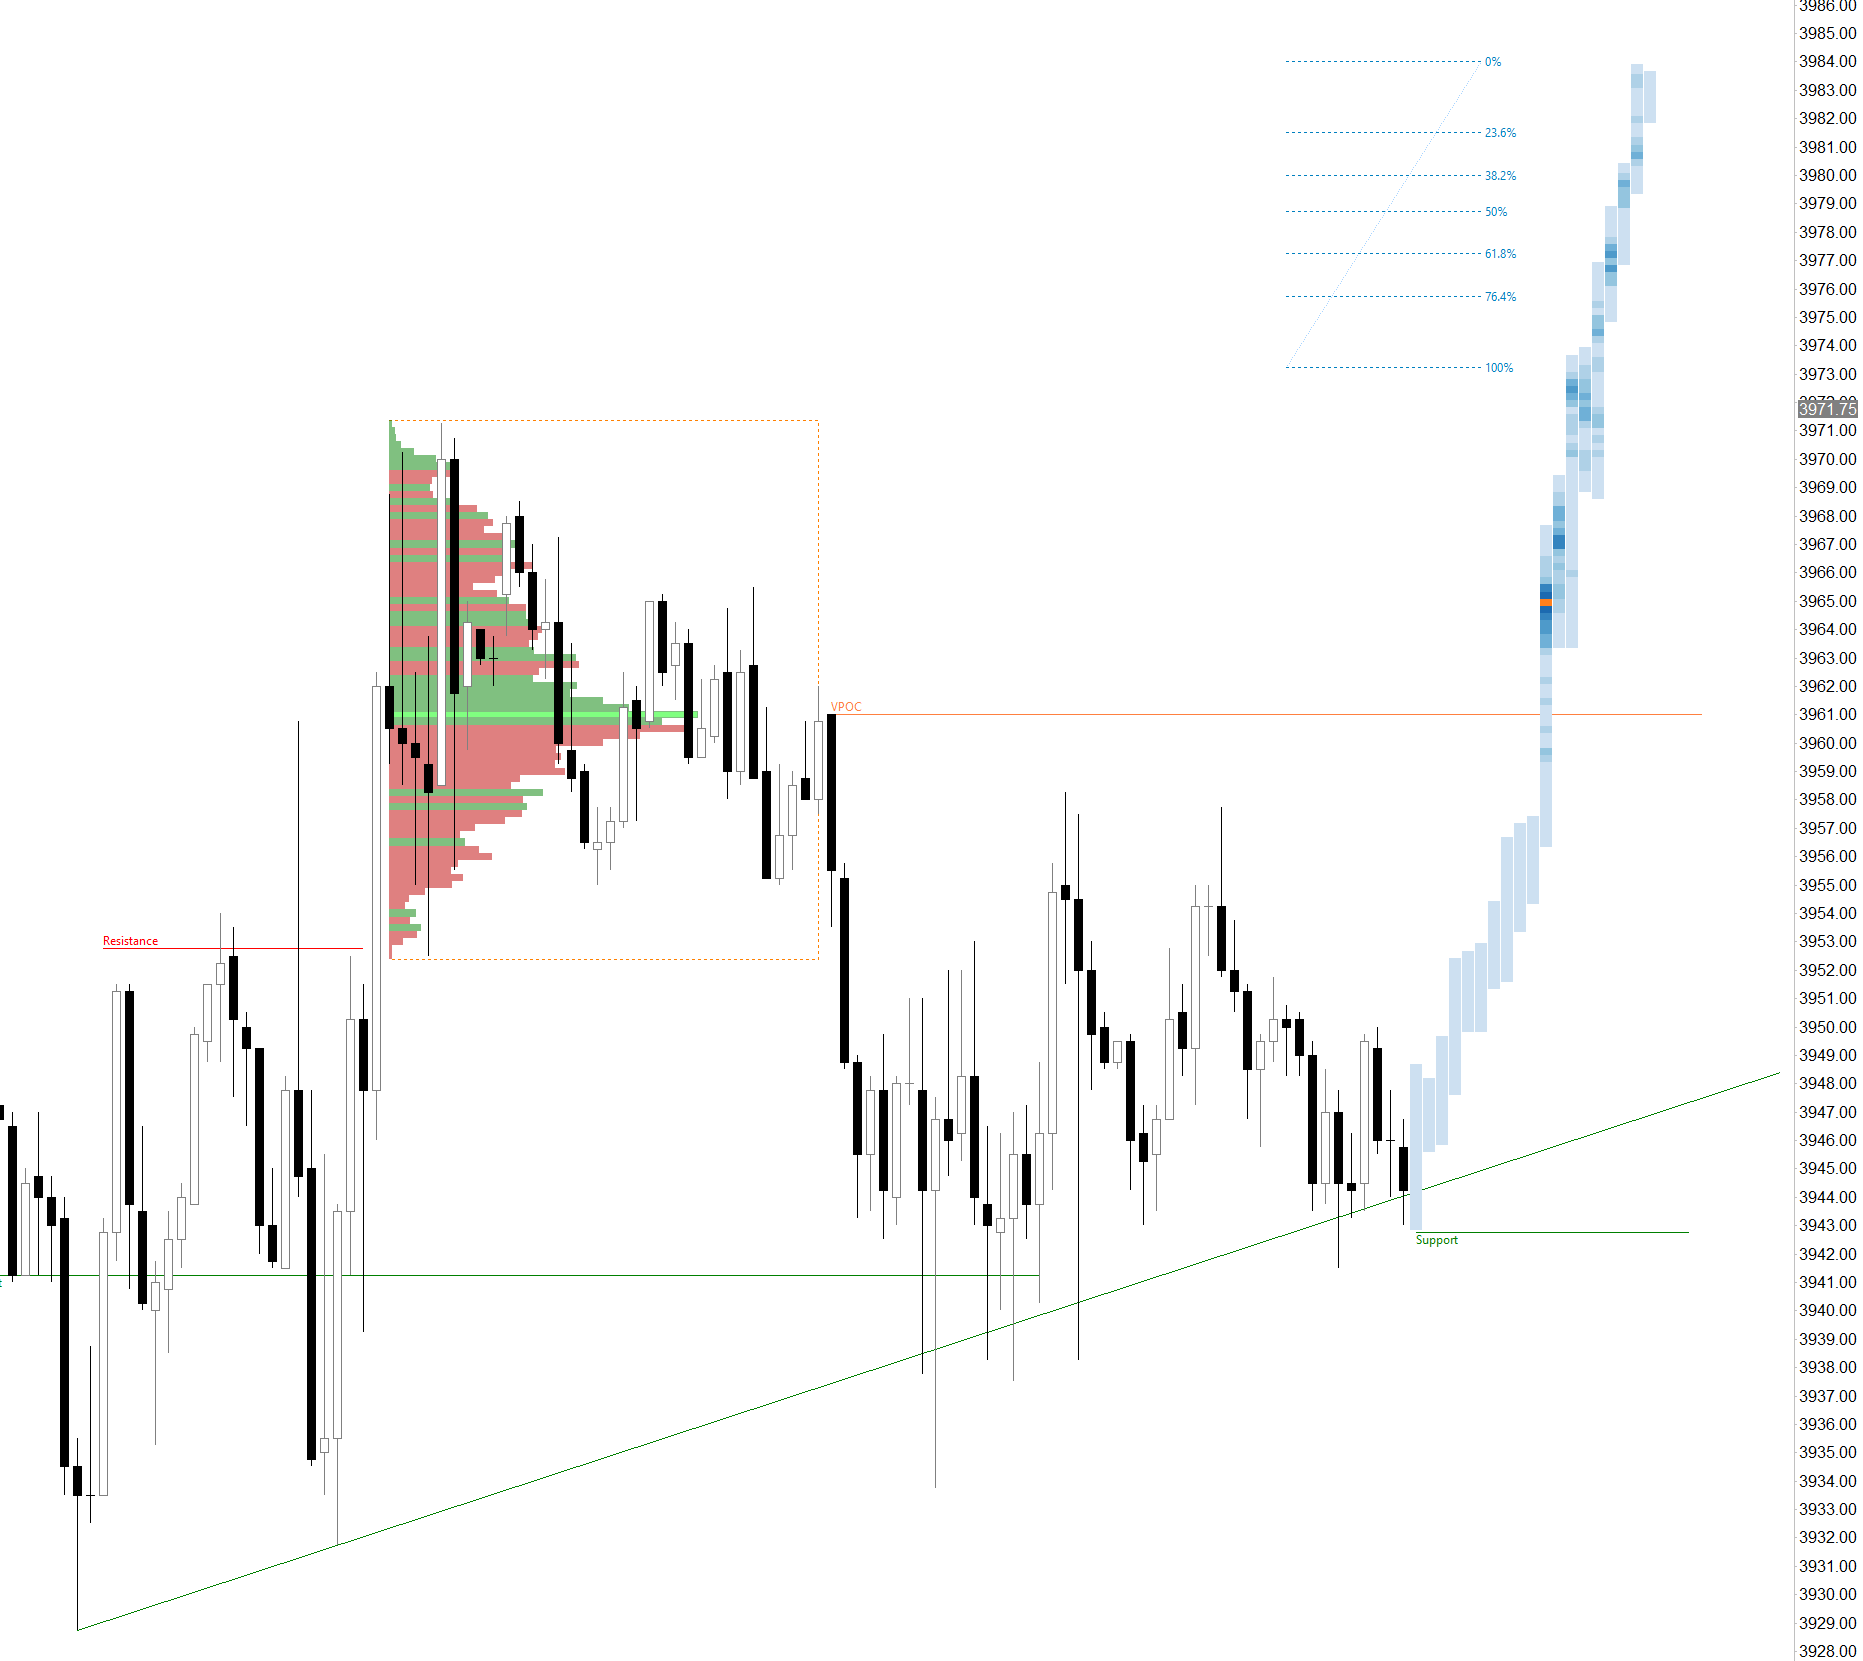
Price is currently on some support that could potentially hold. I’m watching order flow to time my entry and validate anything.

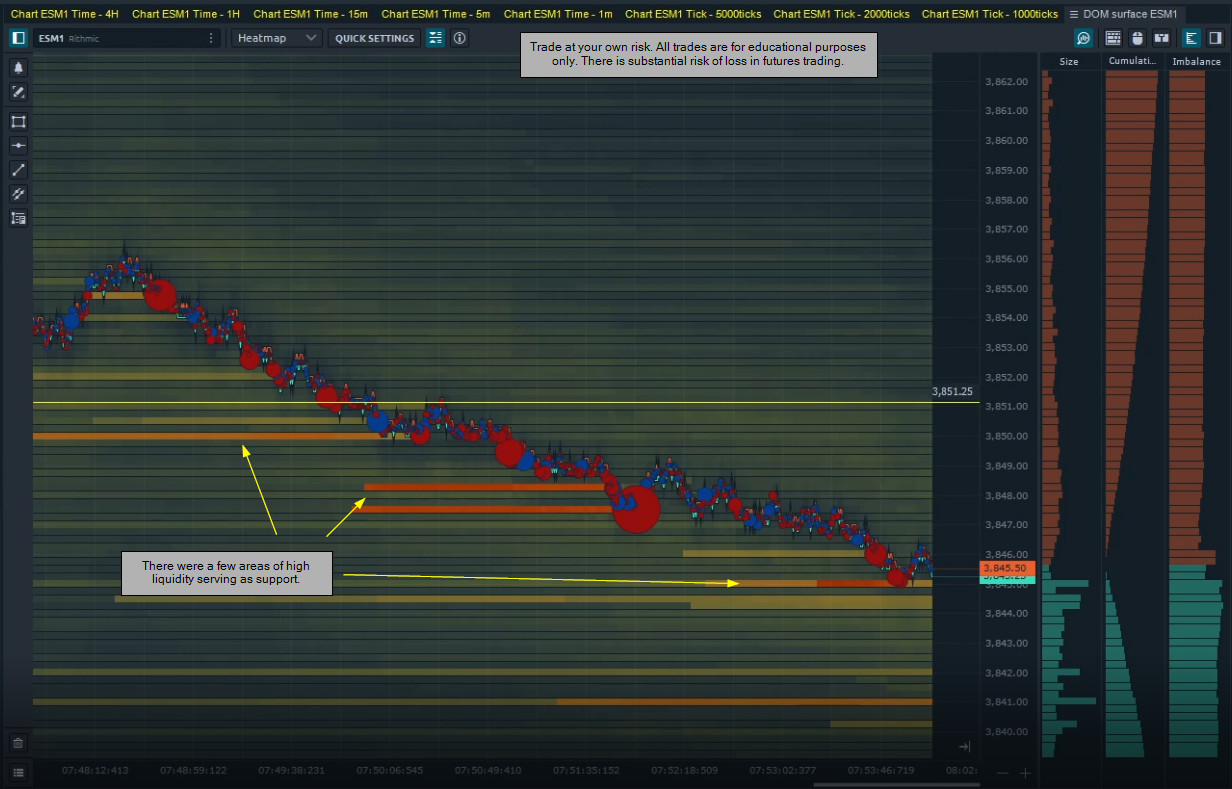
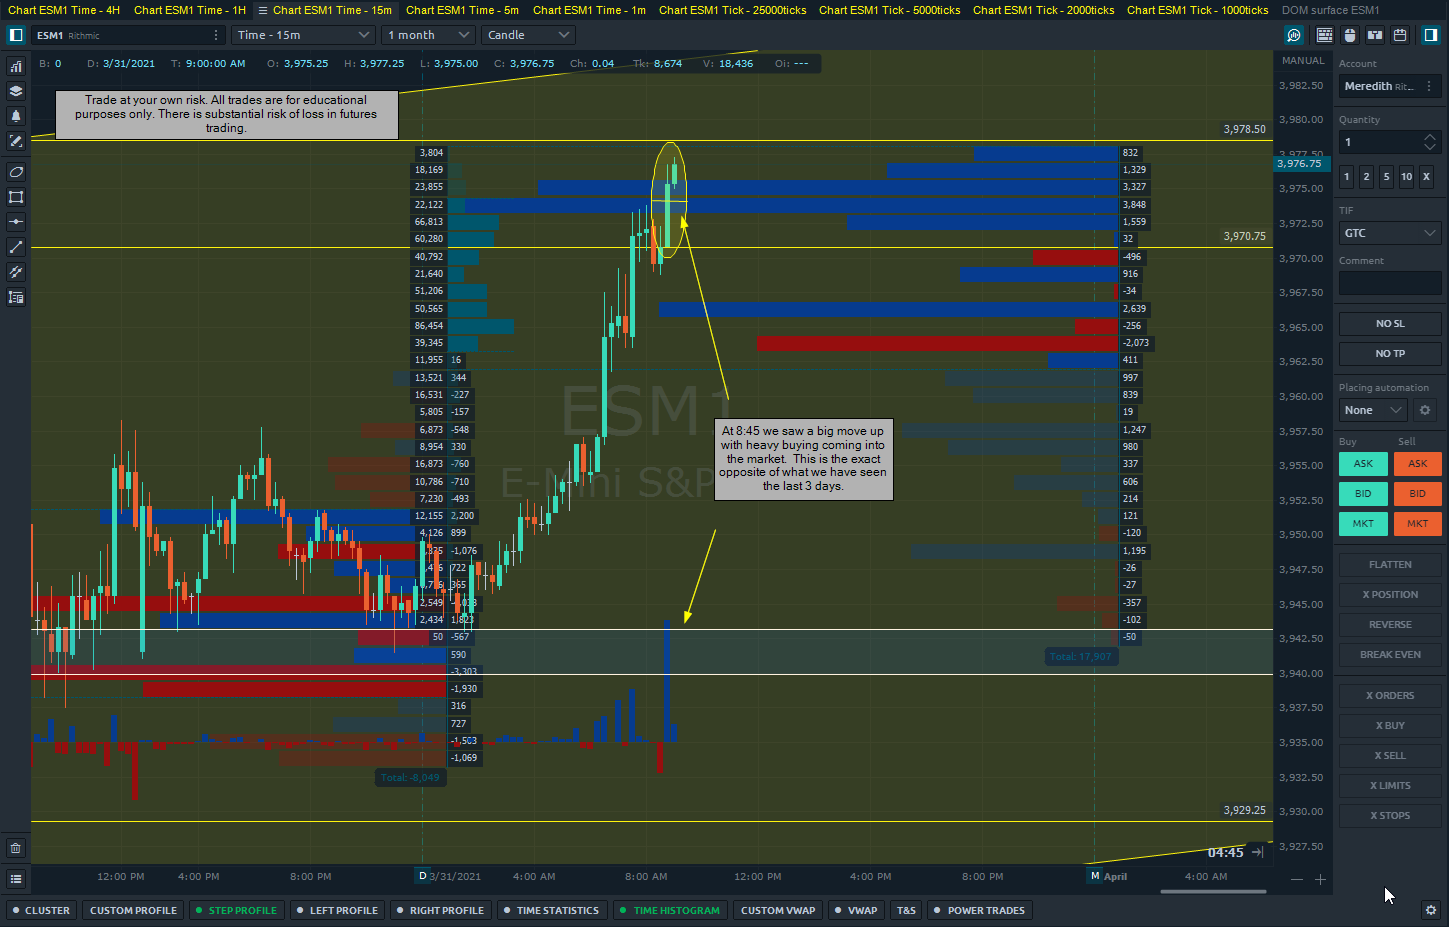
Price came down to an area that formed support. Watch the video below to see where I entered and what price action was doing.

Today, I’m going to follow my gut and stop trading. I’ve been very selective about my process and I’m going to focus the rest of the day on research, posting topics and replies and planning for tomorrow.

A good mental break is always helpful, especially rewarding after a positive day.

There is a substantial risk of loss in futures trading. Past performance is not indicative of future results. The figures here represent an opinion. The placement of contingent orders by you or broker, or trading advisor, such as a “stop-loss” or “stop-limit” order, will not necessarily limit your losses to the intended amounts, since market conditions may make it impossible to execute such orders. Please conduct your own due diligence if Futures are an appropriate instrument for you.

Trading plan 3/25/21 Thursday.

Today I will be looking to sell rallies for major moves while scalping key levels. The market has broken out of the uptrend channel it has been in since 3/11/21. This may continue and attract sellers to start controlling the auction.

Price is respecting major levels of support and resistance and those will be key areas to enter the market in, all with watching order flow.

I don’t have major expectations in terms of levels or direction, I do expect however that we can lean on sellers at resistance levels to enter.

Mental Prep:

I feel clear mentally and good physically. Working out daily and eating better to maintain energy levels and focus.

I’ve been better at sitting out of the market more (one of my 80/20 items) and watching order flow more intently.

Affirmations:

I can receive information from the market objectively.
I can make good decisions, I am not forced to make any decision that is outside of my comfort zone.
Money can flow freely to me.
When I’m wrong, I’m wrong and that is OK. It is not a reflection of me or me as a trader.

12:30 PM Pacific Update:

I started to look for rallies to sell as stated in my plan, however, I found myself turning to buying dips. I don’t know if it was because of what I saw or because I missed my sell spot.

I do know that when I was buying dips I remember thinking this is against my plan today and I was careful.

Had some winning trades then made a trade on the long side at a key level, but my entry was WAY off. I risked more than I should have and ended up hitting the flatten button. It didn’t process that though and I added more size at a level at a better price, a trade I still would have taken if I was able to flatten prior to that.

I removed most of the position within 5 points and let the rest ride a few more points. The last two spots that I had offers on were filled and fully exited.

What I saw here changed my strategy to get long:

There is a substantial risk of loss in futures trading. Past performance is not indicative of future results. The figures here represent an opinion. The placement of contingent orders by you or broker, or trading advisor, such as a “stop-loss” or “stop-limit” order, will not necessarily limit your losses to the intended amounts, since market conditions may make it impossible to execute such orders. Please conduct your own due diligence if Futures are an appropriate instrument for you.

Thank you for all these posts Ben. I am going to start watching these videos and trying to learn how this flow stuff works. This is like the college course on order flow. :).

1 Like

Trading plan 3/26/21 Friday.

We are 30 minutes into trading and price has moved back into an uptrend channel around 3910.00. While this channel is relevant, it is a short-term trend so we will be cautious of any selloff.

After the selloff yesterday, price moved back up rapidly and continued to trade up into the range.

Strategy today will be buying dips, looking for price to range trade and play those edges.

Mental prep:

Today I’m in a place of gratitude and objectiveness. I will focus my attention on how I respond to results of my trading and monitor internal dialogue.

Affirmations:

I can choose how to respond to wins or losses.
I can make good decisions that align with my plan and strategy.
I see data objectively and respond accordingly, without emotion.
I’m tenacious about my execution and risk management.

Update:

On the DOM Surface there is liquidity in the book at 3925.00 Assuming the uptrend is valid and buyers continue to control the auction, price may potentially gravitate toward that area.

With the plan being buy dips, we will see how price responds to any resistance by sellers at key levels.

Update:

Price moved to and through the 3925.00 area. As price came to this point, more liquidity showed up at the 3930.00 level.

The market also saw bigger size enter at 3925 - 3927.50 area:

Update:

ES Mini opened and started to rally immediately. Price came back down to the 3910.25 level and bounced off of it making new highs.

Our trading plan today was to buy dips and look for areas of support to lean on.

Let’s look at the DOM Surface:

While there was active selling going on while price approached the 3910.00 level, we saw big, aggressive buyers come to market resulting in a quick reversal.

Overall, the market shifted from a short-term downtrend and is now bouncing off levels of support while retracing at major resistance levels.

There is a substantial risk of loss in futures trading. Past performance is not indicative of future results. The figures here represent an opinion. The placement of contingent orders by you or broker, or trading advisor, such as a “stop-loss” or “stop-limit” order, will not necessarily limit your losses to the intended amounts, since market conditions may make it impossible to execute such orders. Please conduct your own due diligence if Futures are an appropriate instrument for you.

Thank you Jeff! Glad you are enjoying them.

Never hesitate to ask anything regarding them or post about them.

1 Like

Ben,
Thank you for sharing your insights.


I hope this question is not to elementary.
On the a cluster bar there is volume recorded on both sides. (I have sell and then buy volume)
My understanding is that on the sell side the trades are short sellers and trades getting stopped out and the opposite on the buys side. It this correct or is there more players.

Thank you,
Dean

Hi Dean! Thanks for the question. If you have the chart set to sell and buy volume, the numbers on the left are all market sell orders while the right is all market buy orders.

They can indeed be stops, but more so it is showing the aggressive sell and buy orders that hit the market.

If I didn’t have a position and wanted to enter the market and sold, the number of contracts I sold at the market would show up on the left bar. If my position went against me to the point of puking, I would have to buy it back at a higher price. The buy exit could be a stop or manual market order that shows up on the right side.

However, if I’m short but then I bid (passive limit buy order) and I get filled (someone sells into my bid) the number of contracts I purchase would NOT show up on this chart because it was placed as a limit buy order.

Does that help?

1 Like

Thank you Ben,
Your explanation gives me a better understanding.

Regards,
Dean

1 Like

Trading plan 3/29/21 Monday.

Below is the hourly chart for es mini futures. We can see some good resistance at the 3971.25 level and it has hit there about 4-5 times.

Although this is still in an uptrend overall, if the market is unable to continue to make newer highs it could be a sign of weakness.

Mental prep:

Today I’m focused on making good decisions and following my rules and strategies. I’m strong enough to not get swayed by flashy objects or opportunities.

Just focus on myself and the market.

Affirmations:

I can make good decisions.
I have the ability to see the market.
I can be patient and wait for my entry signals.
When I’m in a trade I observe the market objectively and process the information it’s telling me.

Update:

The market came off the highs of 3971.25 to test a small support area at 3956.00. Trade below this briefly then straight back to test resistance.

Our plan was to sell rallies and watch for the market to fail to make new highs. While there was a good amount of passive buying near the highs, the majority of the transactions at the market were seller biased.

When price came to this high again, every 5000 tick bar from 12:25 to 12:43 had more market sellers than buyers. The build-up and resulting price movement to the downside forced buyers to puke their position and drive the price down.

There is a substantial risk of loss in futures trading. Past performance is not indicative of future results. The figures here represent an opinion. The placement of contingent orders by you or broker, or trading advisor, such as a “stop-loss” or “stop-limit” order, will not necessarily limit your losses to the intended amounts, since market conditions may make it impossible to execute such orders. Please conduct your own due diligence if Futures are an appropriate instrument for you.

2 Likes

Trading plan 3/30/21 Tuesday.

Still in an uptrend on the 4-hour chart.

With that being said, the longer-term trend being up, if price cannot break to new highs there is a lot of room to the downside of the existing channel.

Mental prep:

Today I’m tired, physically but also mentally. I’ll be more selective with any entry to make sure I’m seeing setups correctly.

Affirmations:

I am selective.
I am careful but decisive.
I am patient and able to wait for my entry and exit.

Morning trading session recording:

Afternoon update:

The market traded down right at the open and hit support at the 3940.00 level. Our plan was to buy dips or levels of support to go with the trend. The major test at 3940.00 held up and buyers kept price above this area.

The 15-minute chart shows the POC for today at 3945.50 with price closing at 3949.75, within 5 points of the POC.

The POC can potentially show where large positions have been acquired, which means that if price trades too far away from that area it may potentially result in volatile moves with participants exiting their position.

Afternoon trading session recording.

This is a much longer session than normal but I took a long position near the lows and had planned to stay in it longer than normal. By planning and looking at where the bias was we were able to develop a plan that set us up for this trade.

Performance review:

I traded my plan today. At the beginning of the day, I was taking smaller, short-term positions with good entries and exits. When price came to support at 3940.00 I took a long position that I held for the rest of the day.

Ultimately I’m happy with my execution today and also sitting out when I didn’t see setups.

There is a substantial risk of loss in futures trading. Past performance is not indicative of future results. The figures here represent an opinion. The placement of contingent orders by you or broker, or trading advisor, such as a “stop-loss” or “stop-limit” order, will not necessarily limit your losses to the intended amounts, since market conditions may make it impossible to execute such orders. Please conduct your own due diligence if Futures are an appropriate instrument for you.

1 Like

Thanks for posting the videos, it is very interesting to watch somebody else trade.

Trading plan 3/31/21 Wednesday.

Yesterday we analyzed the daily POC and cross-referenced that with the corresponding delta. This allowed us to see what the majority of traders were doing at the high volume prices.

The last 3 days we saw an overall negative delta with an imbalance biased toward selling at the POC areas.

Today we opened at support of 3942.00 ad the market rallied, almost touching 3978.50, a double top from the 15th. What’s interesting is that from 3942.50 to 3964.00 there wasn’t a huge amount of volume driving price up. Above 3964.00, more volume started coming into the market and it was heavily weighted to aggressive buyers seen in the chart below:

I’m going to be watching how price responds in this area and what buyers and sellers are doing at the 3978.50 level.

@autobahn @Mod-MattZ - What is your perspective on this analysis with this aggressive buying showing up at the highs? I’m trying to integrate these types of charts into my daily trading and develop a longer-term strategy as well.

Mental prep:

Trade my plan and be flexible. Watch what price does at the high and see how the influx of active buying is affecting price at key levels.

I’ll be trading quick moves in either direction with a possible longer term short trade if sellers come back in, preferably at the 3978.00 level.

Affirmations:

I take the highest probability trades.
I don’t let me losers run.
I let my winners run when the market allows.

There is a substantial risk of loss in futures trading. Past performance is not indicative of future results. The figures here represent an opinion. The placement of contingent orders by you or broker, or trading advisor, such as a “stop-loss” or “stop-limit” order, will not necessarily limit your losses to the intended amounts, since market conditions may make it impossible to execute such orders. Please conduct your own due diligence if Futures are an appropriate instrument for you.

Price action the past few days has been unusual. I’ve seen what looks like significant algo action aggressively selling as if liquidity was in short supply, yet there is clearly liquidity as price continues to move up. For example, large spoof buy orders in the book, and when price moves a few ticks away from the order, a massive block sell at the bid and then the spoof order is removed. I am guessing someone has a requirement to sell based on time constraints, irrespective of liquidity and market conditions.

This still looked to be the case to me today, prior to the breakout at 3973.

The last few days I’ve decided to do a Jesse Livermore - not question the why, and just look at the what.

Thank you.

How do you get the candlesticks to show the blue and dark blue on the right side of the chart?

I wrote that myself (custom study).

1 Like

Nice that’s pretty cool!

What do you need from me to allow you to write stuff like that for Flow and integrate it?
Ideally, I’d like to share that with the community on the free platform.
(As long as they do not reveal your method and are display tools only. I do respect IP).

Matt

1 Like

I will take a look at the Optimus API and see what is possible. It looks straightforward.

Currently my efforts are in developing tools to assist my own trading, especially scalping. If you see my recent post on How I test my futures trading strategies, there is so much that a trader needs to consider, in real time, and it can be overwhelming! Not only that, the information received needs to be untainted by bias, stress and ego. It is easy to get engrossed scalping, watching the DOM, and then forget an event is due, or that a small breakout on a 30s chart can be straight into a major resistance level on a 1H chart.

I’m putting together some scalping tools that provide the key information I require as a scalper, sort of like “Lane Keep Assist” or “Automatic Windscreen Wipers” in a car. These are not fully automated algos, but rather assists that are activated and managed by the trader using hotkeys while displaying key information in a Heads-up display.

2 Likes

Being in the business as long as I have been, I can appreciate the effort that planning requires and put the components together even if they are simple. Work on your scalping and method; I understand that it takes priority.

I am looking for better visual displays of any data a professional trader like you would look at. Objective data that it would be up to the traders to find ways to use it. If you have additional ideas, I am happy to entertain them. My goal is to make Optimus Flow a better tool for traders.

Thanks,
Matt

1 Like

This sounds awesome. I had a friend who traded for a firm in Chicago that really focused on assistive trading macros/algos etc.

I like the idea that it can be personalized to your strategy and essentially do what you would normally do but faster.

I asked about being able to record macros and Jake informed me it has to be done with code, NOT my specialty.

However, I’d love to help however I can if needed with ideas or testing.