S&P 500 Futures Market Outlook - Trends and Levels ES MES

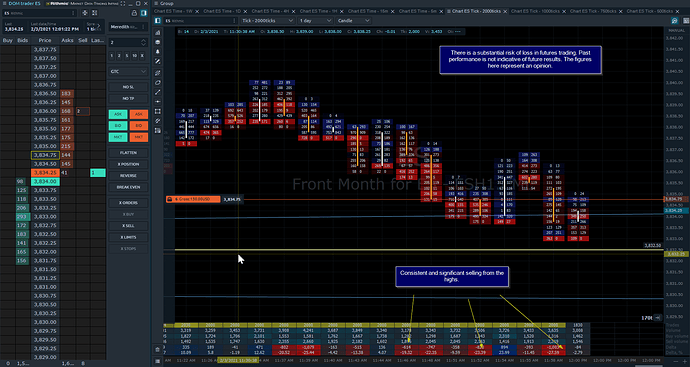
On the 2000 tick chart we are seeing significant selling with lower lows.

There is a substantial risk of loss in futures trading. Past performance is not indicative of future results. The figures here represent an opinion. The placement of contingent orders by you or broker, or trading advisor, such as a “stop-loss” or “stop-limit” order, will not necessarily limit your losses to the intended amounts, since market conditions may make it impossible to execute such orders. Please conduct your own due diligence if Futures are an appropriate instrument for you.

1 Like

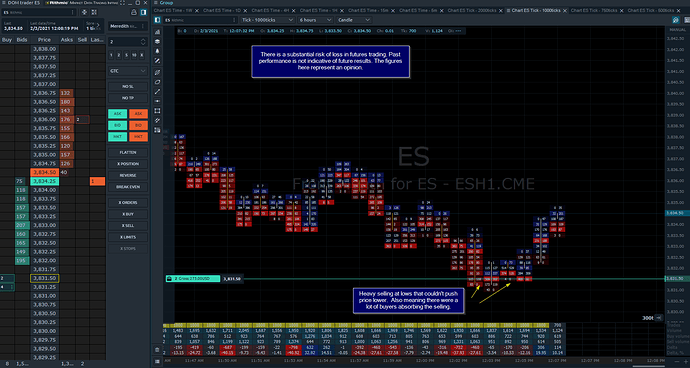
Be careful of these reversals. It’s easy to get caught up in the momentum, especially on the short side since it typically trades faster.

However, watch the tick charts for short term reversals where you can see heavy selling that can’t push the market down further.

Those sellers have to get out of their position and their risk tolerance effects when they buy it back.

There is a substantial risk of loss in futures trading. Past performance is not indicative of future results. The figures here represent an opinion. The placement of contingent orders by you or broker, or trading advisor, such as a “stop-loss” or “stop-limit” order, will not necessarily limit your losses to the intended amounts, since market conditions may make it impossible to execute such orders. Please conduct your own due diligence if Futures are an appropriate instrument for you.

4 Likes

Happy Monday!

Here’s a quick chart update for ES Mini.

There is a substantial risk of loss in futures trading. Past performance is not indicative of future results. The figures here represent an opinion. The placement of contingent orders by you or broker, or trading advisor, such as a “stop-loss” or “stop-limit” order, will not necessarily limit your losses to the intended amounts, since market conditions may make it impossible to execute such orders. Please conduct your own due diligence if Futures are an appropriate instrument for you.

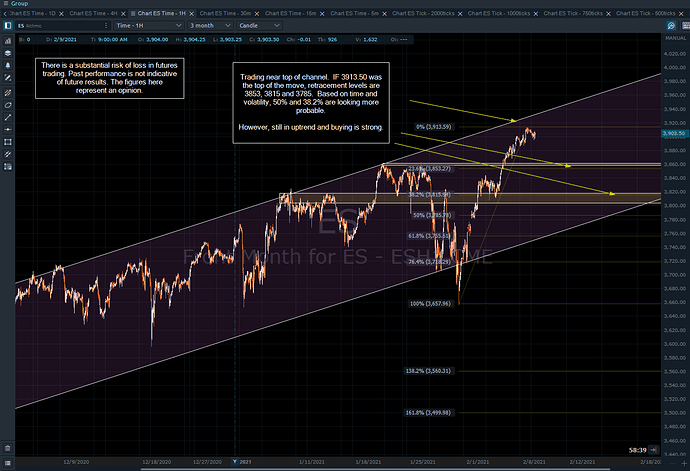
ES Mini is trading up near top of channel on hourly charts.

IF* the top of the move is 3913.50, fib retracement levels are set on chart. Still in uptrend but it’s trading back and forth pretty well, good for range trading and scalping.

Short term trades I’m going long and short, longer term is looking for short trades only.

There is a substantial risk of loss in futures trading. Past performance is not indicative of future results. The figures here represent an opinion. The placement of contingent orders by you or broker, or trading advisor, such as a “stop-loss” or “stop-limit” order, will not necessarily limit your losses to the intended amounts, since market conditions may make it impossible to execute such orders. Please conduct your own due diligence if Futures are an appropriate instrument for you.

1 Like

Weekly recap of charts for ES Mini.

There is a substantial risk of loss in futures trading. Past performance is not indicative of future results. The figures here represent an opinion. The placement of contingent orders by you or broker, or trading advisor, such as a “stop-loss” or “stop-limit” order, will not necessarily limit your losses to the intended amounts, since market conditions may make it impossible to execute such orders. Please conduct your own due diligence if Futures are an appropriate instrument for you.

2 Likes

I’ve posted a video on order flow entry and live trading with cluster charts on a new thread, here is the link!

There is a substantial risk of loss in futures trading. Past performance is not indicative of future results. The figures here represent an opinion. The placement of contingent orders by you or broker, or trading advisor, such as a “stop-loss” or “stop-limit” order, will not necessarily limit your losses to the intended amounts, since market conditions may make it impossible to execute such orders. Please conduct your own due diligence if Futures are an appropriate instrument for you.

Also, here is video from today’s trading on cluster charts.

There is a substantial risk of loss in futures trading. Past performance is not indicative of future results. The figures here represent an opinion. The placement of contingent orders by you or broker, or trading advisor, such as a “stop-loss” or “stop-limit” order, will not necessarily limit your losses to the intended amounts, since market conditions may make it impossible to execute such orders. Please conduct your own due diligence if Futures are an appropriate instrument for you.

Hi everyone!

Here’s a quick update on the ES Mini charts:

There is a substantial risk of loss in futures trading. Past performance is not indicative of future results. The figures here represent an opinion. The placement of contingent orders by you or broker, or trading advisor, such as a “stop-loss” or “stop-limit” order, will not necessarily limit your losses to the intended amounts, since market conditions may make it impossible to execute such orders. Please conduct your own due diligence if Futures are an appropriate instrument for you.

1 Like

Post market close Wednesday 2/17 ES Mini.

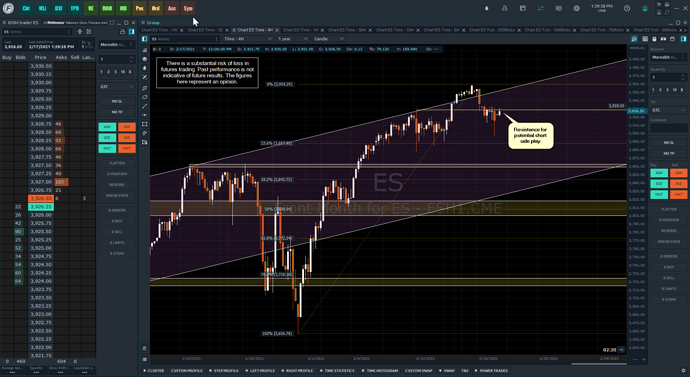
Today we traded down then retraced up to the 3926.00 level which is potential resistance for short traders.

Keep in mind that overall we are still trending up but near the top of the price channel.

There is a substantial risk of loss in futures trading. Past performance is not indicative of future results. The figures here represent an opinion. The placement of contingent orders by you or broker, or trading advisor, such as a “stop-loss” or “stop-limit” order, will not necessarily limit your losses to the intended amounts, since market conditions may make it impossible to execute such orders. Please conduct your own due diligence if Futures are an appropriate instrument for you.

1 Like

Ben, I’ve been watching your videos and am interested in learning to trade using the cluster chart footprint. I’m fairly new to futures and was a little overwhelmed with some of the volume analysis options initially, but I think I’m ready to start devoting the time to learn how to incorporate some of those tools into my trading. Any advice on how to go about starting the learning process with these tools (footprint specifically)? I’ve obviously started by reading what comes up on Google, but sometimes hard to know what is reliable. Thanks. I appreciate the content you’ve been contributing.

Greg

3 Likes

Thanks @greg! Glad you are liking the posts.

What do you typically trade? I have a video I’m editing on how to incorporate chart analysis with order flow and footprint charts to optimize entries and validate/disprove trade ideas. It should be done Sunday.

I’m also finding it challenging, but still possible, to pinpoint exactly what topics and questions to address in the videos because trading styles differ from trader to trader.

The good news is that I’m going to be having a webinar with some broad topics on footprint charts and also Q & A.

In addition, I was thinking it would be beneficial to have an open room to all Optimus users in the morning to collaborate, ask each other about ideas and strategies.

I’ll confirm with Matt and if it’s possible I’ll post times and days it’s open with the necessary links.

I’m Pacific time and usually don’t trade until 8:30 my time but want to start earlier if there’s enough interest.

Does that sound like something you think would be beneficial?

Thanks for the response Ben. The video you described that you are currently working on sounds great, I’m looking forward to it. Sounds like what I’m looking to learn.

I’ve only traded index futures. I started with the NQ because that’s what my dad trades and he introduced me to futures, but I’ve found the ES is probably more my style. Had some initial success, but struggles of late have me wanting to understand volume analysis more. The webinar you mentioned sounds very interesting.
I’m PST too, but have limited trading time. Mostly 630-730 before I have to go to work. I’d be up for trying the open room idea you mentioned if times worked out. I’ve never done anything like that but would be up for giving it a try.

Here is a quick video on how we can use order flow to validate or disprove trade ideas.

There is a substantial risk of loss in futures trading. Past performance is not indicative of future results. The figures here represent an opinion. The placement of contingent orders by you or broker, or trading advisor, such as a “stop-loss” or “stop-limit” order, will not necessarily limit your losses to the intended amounts, since market conditions may make it impossible to execute such orders. Please conduct your own due diligence if Futures are an appropriate instrument for you.

2 Likes

@Ben_M - Good video, thanks! Your explanation of what you’re seeing in the footprint chart helps me understand it a bit more.

1 Like

Hi @greg, that sounds good. I’m discussing logistics with Matt on the open room.

I actually started trading Nasdaq when I first started as well but that’s when the ES book was super thick. Sometimes the inside market would have 3-4 thousand contracts on the bid and offer, made it difficult to scalp.

I’ll keep you posted on what we come up with for the room or Q&A!

1 Like

Thanks @colosean!

Like Matt said, it’s hard to explain what we see because so much is pattern recognition and in many cases subconscious.

I do believe that the footprint chart can really help identify areas of tension between buyers and sellers. But it’s still a lot of watching and seeing how it trades.

3 Likes

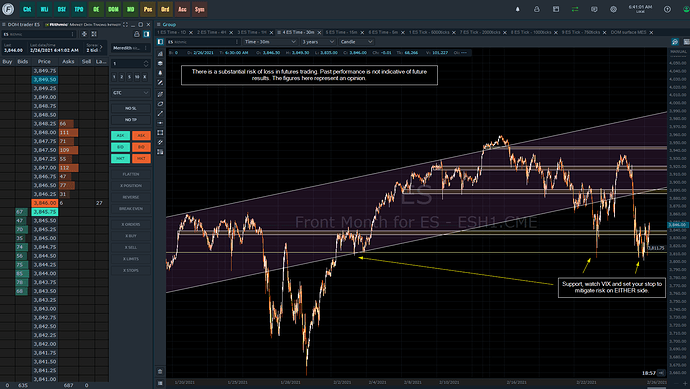
Currently waiting to see how the market is going to trade today.

Looks like ES is sitting on some support but after yesterday I’m pretty hesitant either way.

It’s also trading very thing right now, something to be aware of in terms of volatility.

There is a substantial risk of loss in futures trading. Past performance is not indicative of future results. The figures here represent an opinion. The placement of contingent orders by you or broker, or trading advisor, such as a “stop-loss” or “stop-limit” order, will not necessarily limit your losses to the intended amounts, since market conditions may make it impossible to execute such orders. Please conduct your own due diligence if Futures are an appropriate instrument for you.

2 Likes

Thank you Ben, your video’s have helped me fine tune my cluster charts.

2 Likes

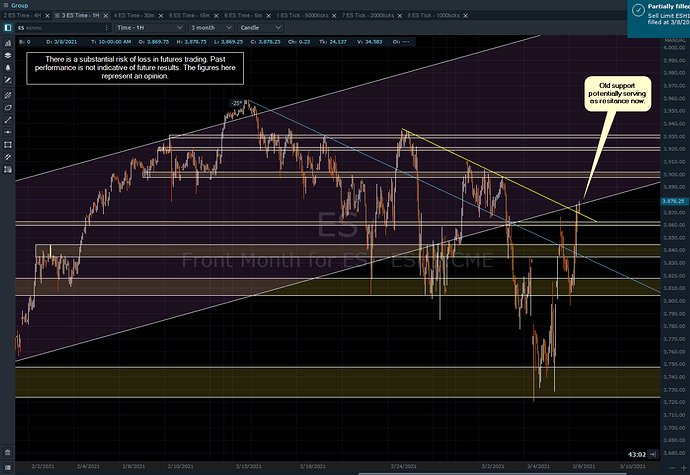
Here’s a quick outlook of the market for this week.

I plan to increase my intent with every trade and really be able to describe why I take the trades I do, then properly analyze them for review.

As I always say, the levels and channels that are drawn on long term charts play a significant role in identifying potential areas for opportunity.

The -25 degree line on this chart was drawn weeks ago and it has held up on retraces.

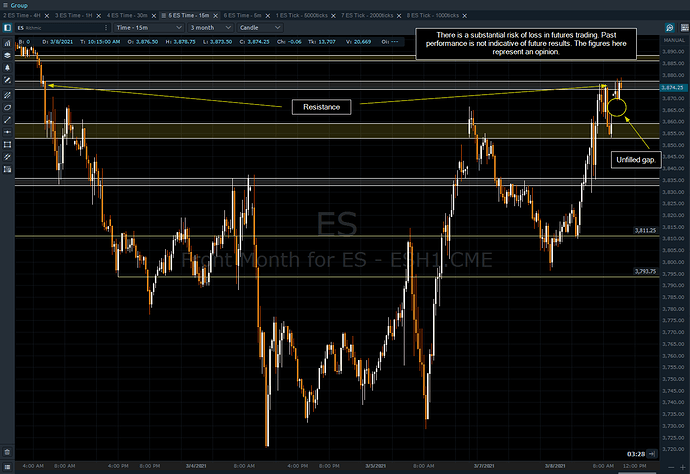
The 15 minute chart shows an unfilled gap with price being at a potential resistance level:

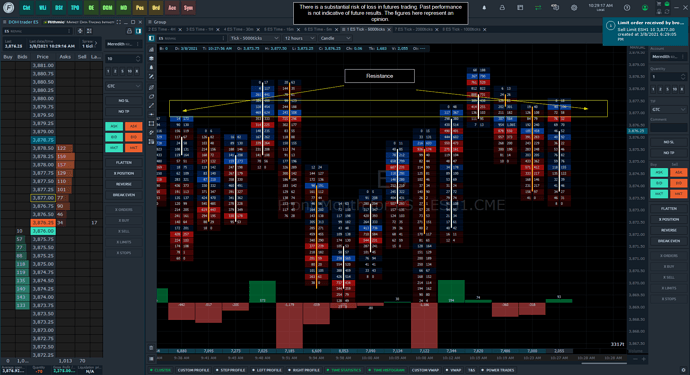
The 5000 tick Footprint chart shows some minor resistance in the short term. We will be watching order flow to determine entry points and potential moves.

There is a substantial risk of loss in futures trading. Past performance is not indicative of future results. The figures here represent an opinion. The placement of contingent orders by you or broker, or trading advisor, such as a “stop-loss” or “stop-limit” order, will not necessarily limit your losses to the intended amounts, since market conditions may make it impossible to execute such orders. Please conduct your own due diligence if Futures are an appropriate instrument for you.

I realized that I have not updated my charts and levels lately. I went through and kind of cleaned it up, here’s the video version:

There is a substantial risk of loss in futures trading. Past performance is not indicative of future results. The figures here represent an opinion. The placement of contingent orders by you or broker, or trading advisor, such as a “stop-loss” or “stop-limit” order, will not necessarily limit your losses to the intended amounts, since market conditions may make it impossible to execute such orders. Please conduct your own due diligence if Futures are an appropriate instrument for you.